Thanks to you for the work!
Regarding the YTD % I am not sure to understand the formula, if you dont mind explaining?
As there is “net worth on 1st of January” (B31), I guess the whole column B for your January net worth, is to be filled up at the end of the month.
To make thing easier with number, if I start the year with 10chf (B31), and at the end of January I Have 15 chf, my YTD % increased of 50% (B29/B31).
But if at the end of February if have 20 chf, I should have an increase of 100% of my networth, but with your formula (C29/B26) it shows 66%
shouldn’t u always divide every YTD month by the B31?
An other little feedback: as the currency fluctuate, I actually do the exchange on that given day at the end of the month index(GOOGLEFINANCE("CHFEUR","price","2020/01/31"),2,2)
Or, if I use the automatic today date with the standard googlefinance("CHFEUR") formula, I will then “freeze” the cell value at the end of the month, by copying and pasting just the value of the cell, so my graph doesn’t change in time and I know exactly how much I really had at the end of that month
You’re totally right, it was a bug! Thanks for finding it and notifying me! The sheet is updated now.
And regarding your last remark, you’re right as well. The way the sheet works now, we’ll see old net worth values change slightly because of the exchange rate. Your suggestion will fix this, but it’ll add complexity to the sheet (have to change things if we use it next year, and stuff like this). I have to think of a way to make it work in an easy way. We can discuss this in pm, as I’m not sure it is interesting for everyone here.
Btw, the sheet is currently in french. If someone is interested to have it in English, please like this post, so that I know and can start the translation
Since you snapshot it just once a month, why even introduce complexity with having “live” forex rates?
(I don’t see how it would “add complexity”, as you state, to remove the currency conversion )
What I do is just literally google “X eur to chf” (or whatever your base tracking currency is) on the date of data entry, and put that into the sheet.
Then maybe keep another column which tags the original account currency (EUR/CHF/USD).
I meant that adding currency exchange for a specific date would add complexity when one wants to reuse the sheet for another year for example. Of course, removing the currency conversion remove complexity ahah. What I did in my previous sheet is that I have a cell in my sheet that converts currency X to currency Y, then I type the CHF value in the cell, as you said. It’s the easiest, I agree on this!
I did not. Only reevaluate it when informing the Bank that I will rent it out. Value increased and they decrease the amortization from 7k to 4k annually, as the apartment was evaluated for 250k more than I bought it 7 years ago.
As each sheet would be valid for a certain year anyway, you can add the reference to the year in a specific cell (e.g. in the first) tab and then embed it in the index formula which @danfaiz pointed out to make it more abstract / reusable
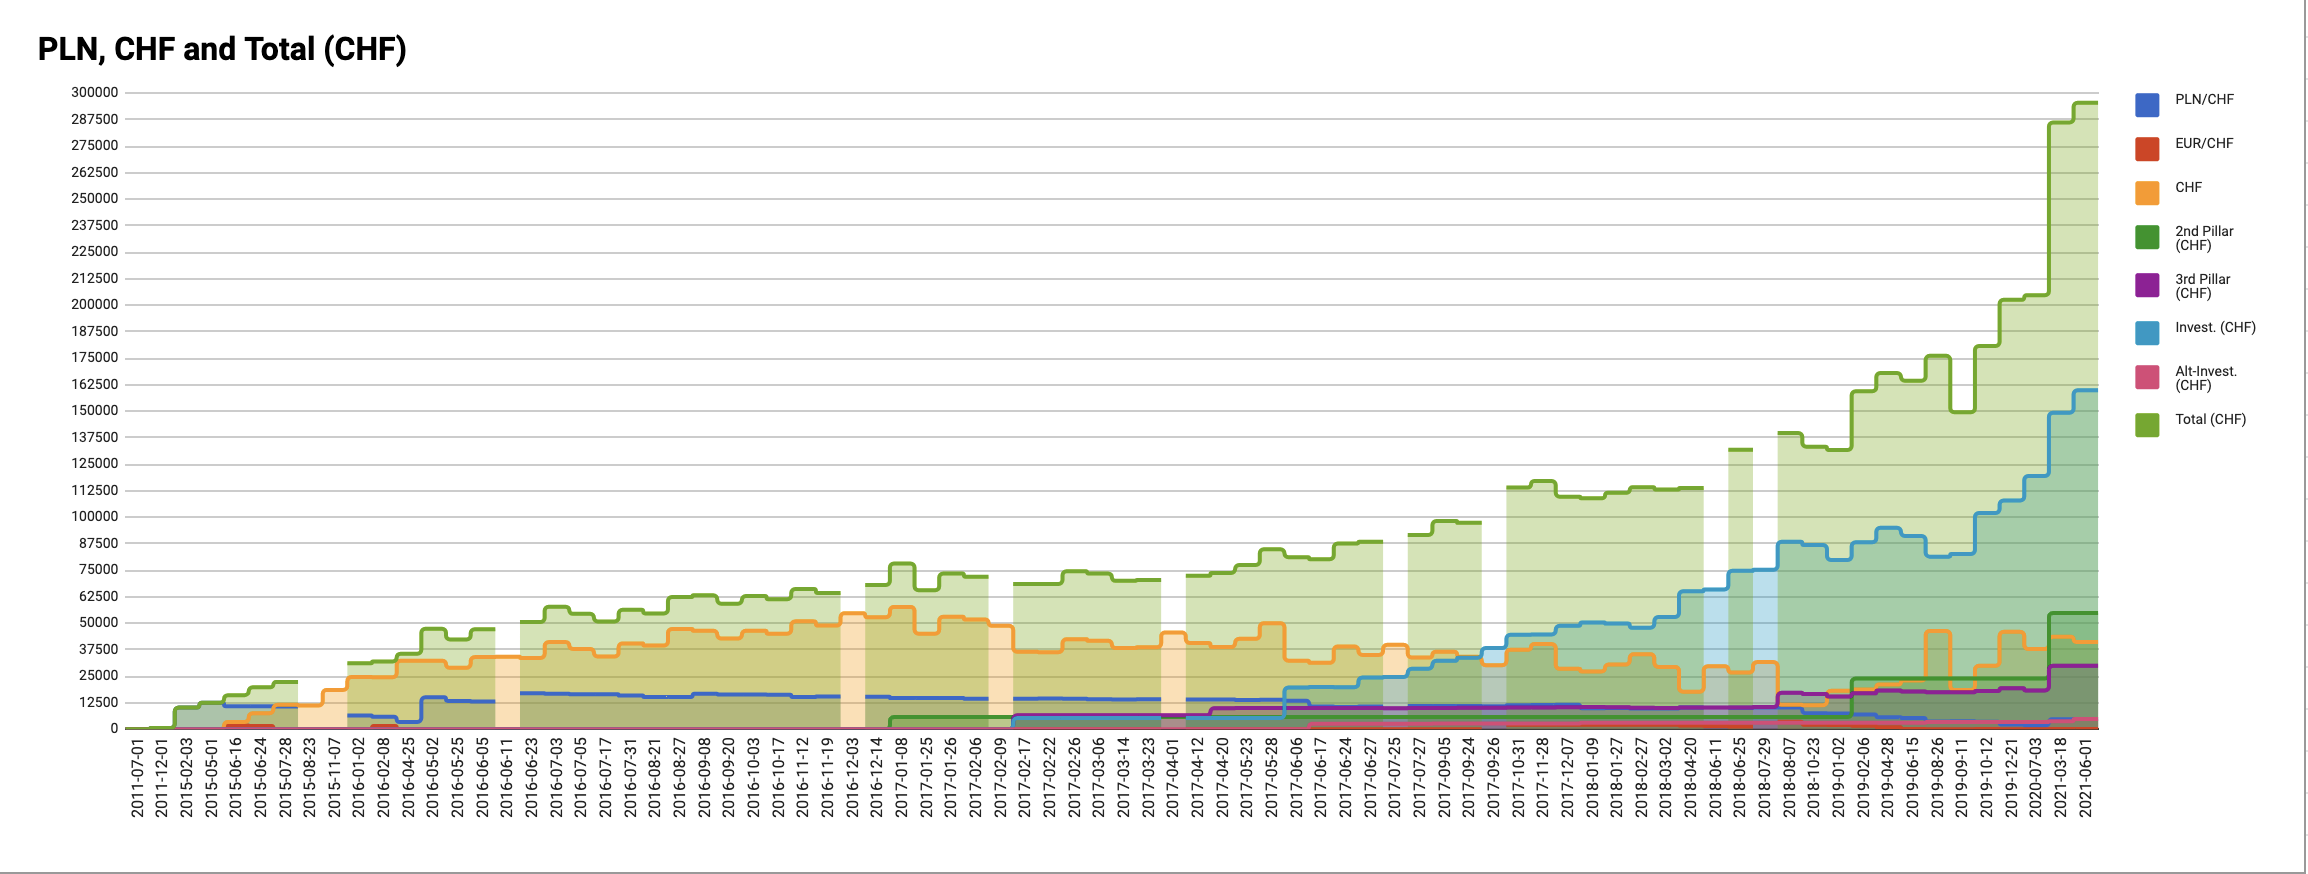
It’s not March but July last year, so it’s basically a year difference (I haven’t been updating my sheet because I wasn’t investing for a year - I got a little bit scared and a little bit confused with my life situation). And it’s not 600k, but 90k - jump from 204k to 295k.
Haha here you can see how spoiled this community is. Not a lot of people would assume 600k might even be possible.
No offense, I added a zero at the first glance as well.
I hope people don’t get intimidated by some of the ridiculous NWs here and don’t compare too much. @1000000CHF seems to be very disciplined and is on the right track, moving forward with big steps.
I don’t think we see the average user in this thread, but I’d like to see more stories of FIRE paths with average salaries. Not everybody can aim for many millions and most people don’t need to as well.
Even though 1000000CHF for example would probably also end up with millions in the long run.
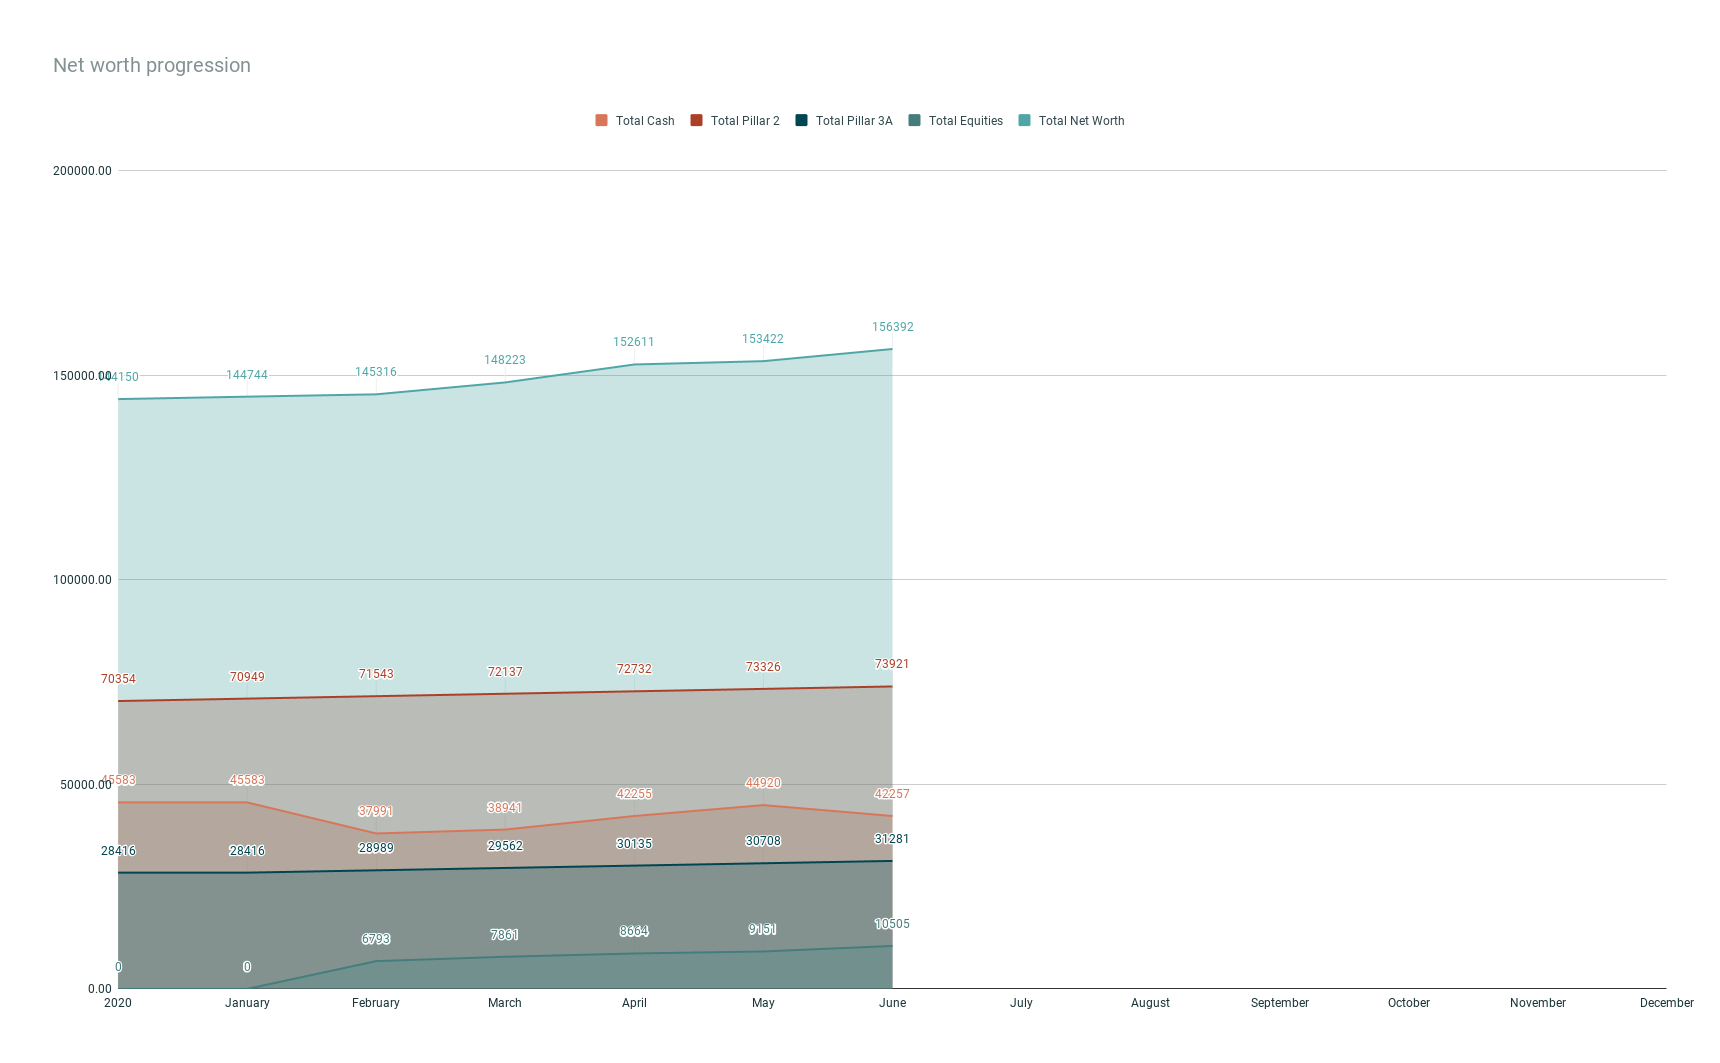
You want modest NW? I got you covered pal 37 YO here, I’ve only been starting to track from the start of the year, I just started my investing journey also. “Lots” of cash which is because my car is getting old and I’ll have to buy a new one soonish
I agree.
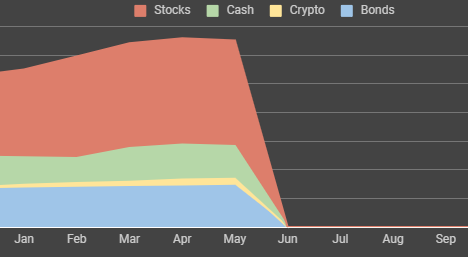
Either set it as a regular line chart, or a stacked area chart.
This blend of “worst of both worlds” is tough to look at.
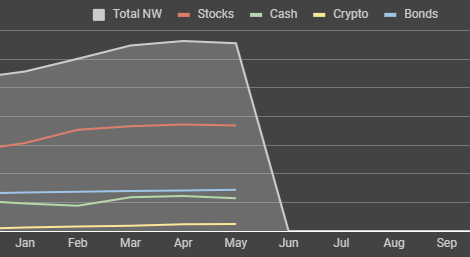
Edit: Or you could keep the total NW series as area with sensible opacity, and the rest as line charts - if you want to keep looking at individual series’ performance.
Just did a quick simulation:
I’m pretty much following exactly what you described.
For the car since it’s a big expense and I have not saved enough for it right now, I’m keeping my emergency fund at 25K. If the car dies unexpectedly tomorrow I’m able to cover this, however if it lives long enough I’ll have saved to replace it without touching the fund. For the rest I have a list of planned expenses for the year. I then spread the cost of them over each months. This monthly sum of planned expenses savings I put on a seperate account and withdraw from it when the actual expense happens. For now it’s not invested just on a regular 0% bank account. The rest of the money is then invested. I think the timeline for my planned expenses is too short right now to warrant investing it.
Once this car business is handled I’m probably going to lower my emergency fund to 15K
and start saving for the next one
I know you did not come here asking for advice about this but may I ask what is your budget / philosophy regards car? If you are keeping 42k cash for the car replacement, does that imply you are planning to spend 27k? That might seem a little un-mustachian v some other folks, but of course you might have a reason for example you have a big commute
My strategy is paying as little as possible for a car that will last me a lifetime
Seriously I’m not looking to spend so much on a car, just to be clear the cash amount is split into the following: 25K emergency, 9k already saved for car, 5k apartment deposit of both our current and last apartment which half is going to be used for the car and the money saved for my planned expenses of this year, which right now is 2.5K.
I have a daughter so we are looking for a family car which we can take also when going on holidays. There might be another kid on the way so I have to take this into account also. I’m not sure what you guys use but when looking at the market I don’t think I’ll be able to get away with less than 20K. I’d take a used car but not a 100K km one, because honestly I have no interest in having to look after my car, I just want one that works and I don’t have to worry about parts failing. I was looking at Skoda Fabia Combi or Octavia. But I’m not set on that at all it’s just the best from the few we tested.
By reading and partipating to this forum, you confirm you have read and agree with the disclaimer presented on http://www.mustachianpost.com/
En lisant et participant à ce forum, tu confirmes avoir lu et être d'accord avec l'avis de dégagement de responsabilité présenté sur http://www.mustachianpost.com/fr/
Durch das Lesen und die Teilnahme an diesem Forum bestätigst du, dass du den auf http://www.mustachianpost.com/de/ dargestellten Haftungsausschluss gelesen hast und damit einverstanden bist.
 The
The 
 )
)

 37 YO here, I’ve only been starting to track from the start of the year, I just started my investing journey also. “Lots” of cash which is because my car is getting old and I’ll have to buy a new one soonish