When do we reach the bottom of the dip? (2022-24 Edition)

Let’s hope losing faith in the US credit rating is not becoming an avalanche :sweat_smile:

I mean, those who were loosing faith have probably not waited for Fitch to step in to do that already (I mean, Jan 6th and repeated debt ceiling crises with some Republicans, including Trump, openly saying the US should default).

I blame the current dip on algorithmic trading, but I could be wrong.

Of course, if new unexpected shenanigans happen, that could erode the faith in the creditworthiness of the US government even more but Trump supporters shenanigans due to indictments/convictions/the 2024 elections, government shut downs at regular occurences while doing budgets and a new debt ceiling drama in early 2025 should already be priced in at this point…

1 Like

My biggest question on this “development” is if it impacts any reserve requirements for regulated players like bank or insurance? Didn’t touch these topics for a few years already but on the top of my head - I would have thought that if 2 out of 3 were below AAA, an asset would need to be considered below AAA. Therefore - I am not sure if treasuries would still qualify for highest ranked collateral / reserve requirements. Would anyone know anything about this?
Clearly - things will not change over night but the I still don’t think that this won’t have any impact - lets say 2-3 years down the line?

2 Likes

Inflation back to 1.6% in July 2023.

4 Likes

Are there any index/etc. that cares about AAA vs. AA? There’s a ton of sovereign debt that’s AA.

I was mainly thinking about banks/pension funds/insurances‘ collateral requirements and not specific indices as such.
This article thinks that collateral requirements for AA+ and AAA are substantially the same

https://m.investing.com/analysis/us-credit-rating-downgraded-how-will-it-impact-your-investments-200640592?ampMode=1

So no impact I guess…

Thank you for sharing. This never seems to be reported very prominently in Swiss news outlets.

It means interest rates in CH and US might be close to their peak? Swiss core inflation is trending down (1.7% down from a peak of 2.2%). US core inflation is 4.8% down from a peak of 6.7%.

Is anyone following the latest news on energy stocks and potential shortages in winter 2023-24? I am just back from vacation and was shocked that shops and hotels were running high Aircon (doors open…)

I think it‘s getting more likely that 1.75% will be the peak in Switzerland.

I borrowed this from @ChrisQuinn from LinkedIn. It holds rather timeless advice for those who want to succeed in investing and cannot refrain from holding company stocks.

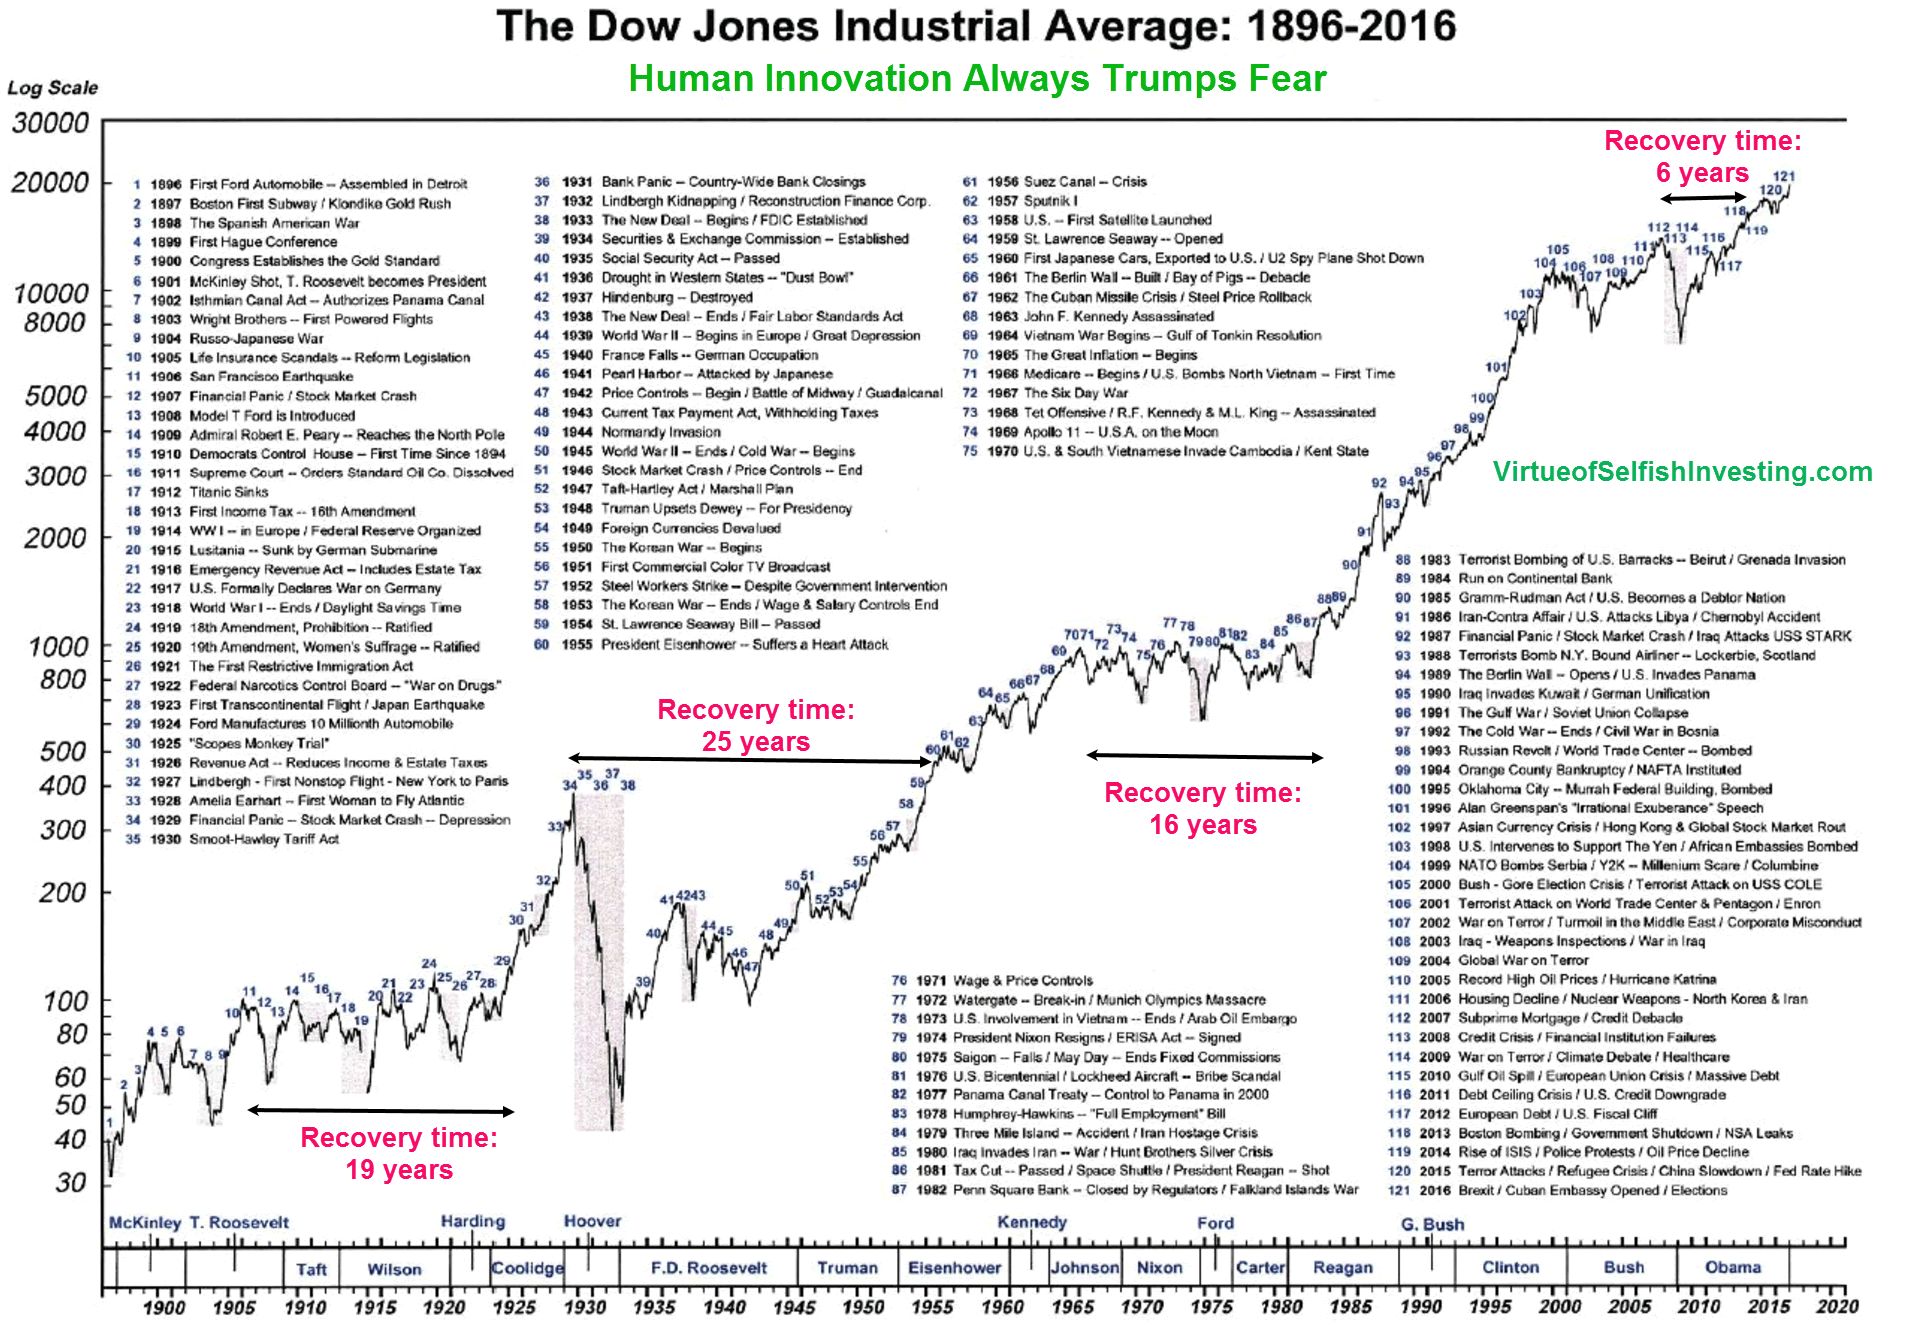
"120 Years of stock market history in one chart

Here are 15 things I learned from 120 years of stock market history:

Lesson 1: Invest for the long term. In the short run, stock returns can be very volatile, but they are very robust in the long run.

Lesson 2: On average, you double your money in the stock market every 10 years.

Lesson 3: In the long run, stocks are less risky than bonds. For 20-year holding periods, stock returns have never fallen below inflation.

Lesson 4: Don’t try to time the market. Time in the market is way more important than timing the market.

Lesson 5: Our world continuously changes. Avoid companies who are highly exposed to rapid changing industry dynamics.

Lesson 6: This time it’s not different. History doesn’t repeat itself. But it often rhymes.

Lesson 7: Let your winners run. Selling your winners and holding your losers is like cutting the flowers and watering the weeds.

Lesson 8: Low stock prices are great for investors.

Lesson 9: Invest in companies that translate most earnings into free cash flow. Earnings are an opinion, cash is a fact.

Lesson 10: In the long term stock prices always follow earnings growth.

Lesson 11: Look at the equity premium. Over the past 200 years, the equity premium (the spread between the return of stocks and return of government bonds) has averaged between 3% and 3.5%.

Lesson 12: In general, small cap stocks outperform. Smaller stocks generate a higher return on the stock market. Between 1926 and 2006, the smallest decile stocks compounded at a CAGR of 14.0% compared to 10.3% for the S&P500.

Lesson 13: Cheaper stocks outperform the market. Based on the price-earnings ratio, the 20% cheapest stocks outperformed the S&P500 by 3.2% between 1957 and 2006.

Lesson 14: Do not invest in IPOs. From 1968 through 2000, a buy-and-hold strategy on IPOs underperformed the index in 29 out of 33 years that were studied.

Lesson 15: The stock market is a leading indicator for the economy. On average, the lead time between what happens on the stock market and what happens in our economy is equal to 6 months."

7 Likes

Stocks picking and factor tilting tips illustrated by a badly constructed index of 30 randomly chosen large cap US stocks?

1 Like

Just a qualifier on that: when he says to ‘invest for the long term’, this holds doubly true for small caps (value). The chart below is from Paul Merriman and it shows the performance of US small cap value vs the S&P500. In the past, most of the additional gains have been concentrated in a few years and you’ve had to endure periods of up to 19.5 years of underperformance in order to capture the outperformance, that’s a very long time during which, in order to be successful, you have to stay your chosen course despite all the probable second guessing going around (while others are able to tout some random investment that is going to the moon).

Source for the chart: https://paulmerriman.com/wp-content/uploads/2021/01/2020-Year-End-Podcast-Charts.pdf

I believe the related podcast is this one: Our most important investment lessons from 2020 - Sound Investing | Podcast on Spotify

7 Likes

I guess it is a matter of available data. If S&P 500 existed back then, it would of course have been a better backdrop for the article.

1 Like

You can obviously through away my forecast. VT in CHF haven’t gone lower than the minimum on 23.06 and higher than the maximum on 15.06. And now we are again closer to the lower limit of this 4-5% wide range.

Is today a warning or just a “normal” -1.25% ?

We’ve had “warnings” for the last few days that the market dynamic may be changing, though it may not.

It’s well within the scope of normal market fluctuations. 5% drops occur on average almost yearly and 10% drops more often than every two years: This Chart Shows How Often Stock Market Corrections Occur | Money

Where the market is going is anyone’s guess. The surest way to profit is to always be ready for a downturn yet always keep investing and staying in. Those who time their exit and entry improperly provide fuel for those who keep buying as it goes down.

That being said, now is as good a time as ever to assess our actual risk tolerance and adopt the allocation that matches it, provided we do adopt it and keep it for the long term afterwards.

1 Like

See the same. From a trend point of view, we have the following situation:

  • Shares - SPI: Short
  • Shares - World: Likely to go Short (by the end of the week)
  • Shares - World CHF Hedged: Long
  • Gold: Short
  • Commodities: Short
  • RE Funds CH: Long
  • Bonds CHF: Long

=> Looks to me like the beginning of a downwards leg. What do I do with this? Nothing :smiley:

You must be qualified as professional trader then, no? :slight_smile:

1 Like

Ok it feels like back to school, so time for some recapitulation.

The index that I am looking at is "MSCI ACWI IMI Net total Return in CHF” as calculated by MSCI.

Some key pivots from 2023:

28.12.2022: 1561.78 CHF, -19.8% from ATH, +2.6% from the 30.09.2022 bottom.
30.12.2022: 1571.63 CHF, -19.3% from ATH, +3.3% from the 30.09.2022 bottom.
02.01.2023: 1574.09 CHF, -19.2% from ATH, +3.4% from the 30.09.2022 bottom, 0.2% YTD.

Januar 2nd, when the index was calculate first time for the year, remains the lowest value for 2023! I am impressed!

We have missed it by a hair during the banking crisis:

13.3.2023: 1574.97 CHF, -19.1% from ATH, +3.5% from the 30.09.2022 bottom, 0.2% YTD.

Afterwards the index was doing more or less consistently higher highs and higher lows. This is a very encouraging trend!

Meanwhile we had a new maximum for 2023:
1.08.2023: 1738.95 CHF, -10.7% from ATH, +14.2% from the 30.09.2022 bottom, 10.6% YTD.
Special congratulations to all calculating your assets in CHF!

After that, there was a healthy pull back:
17.08.2023: 1658.48 CHF, -14.9% from ATH, +9% from the 30.09.2022 bottom, 5.5% YTD, -4.6% from the previous maximum.

Even now the index is at 1718.71 CHF for yesterday, which is very close to the maximum for 2023.

Everything is going great!
Stay tuned for more market news in a month or so!

6 Likes

Thanks for the inputs. I must have missed it upthread but what index are you referring to?

Edit: thanks!

I’ve been selling the peaks throughout this year.