Note: I am in no case an expert in the field nor do i use TA to make my trades (maybe to some smaller degree).
You can, but i simply pulled a chart from Yahoo finance, if you take Tradingview or similar you will have a better owerview (less overlap on the candles).
You can chart longterm lines, but as you said it depends where you start or what you include.
TA - Oversimplified:
Basically you look at the cart and identify where did people sell and where did people buy.
Once you found this (and everyone else). With that information we can guess where the price will move, since everyone is doing it the trades get “front run”.
Say VT had a pullback at 90, but has been bought again at 82, there is a bit chance that next time we go near those numbers we drop/rise. So you set your orders to sell at 88 and buy at 84. This creates the patterns that we see.
Also psychologically if you, say bought lots of VT at 60, are inclined to double down if it reaches that range again. We can identify where lots of stocks changed hands and we can assume that buyer will step up and buy again at those levels.
Not exactly specific to your question, but in this article it discusses Real Estate Bewertungen and Interest Rate sensitivity of one company.
The leverage effect is … somehow huge.
The stock is down almost 40% YTD.
“bei einem Anstieg des zur Bewertung verwendeten Diskontsatzes um 0,4 Prozentpunkte das Portfolio von Peach Property 260 Millionen Franken an Wert verlieren würde. Das entspricht gut 10 Prozent des Gesamtwerts des knapp 2,7 Milliarden Franken schweren Portfolios.”
Regarding support… Yes, some people will base their investment on the („sunk costs“) previous prices they paid for their investments. Big professional investors though? Probably not. Some of them may be leveraged enough that a violation of „support“ may require them liquidate - does that affect the overall longterm market? Probably not, unless they’re big enough to endanger the working of the whole financial system.
Could „support“ levels signal something about the state of the market or investor confidence? Maybe. in the short terms. Few weeks or even few months, as early indicators of change of sentiment.
Over the long term though? I don’t think investors base their decisions on support levels froms years ago in a meaningful way. Same is true for …
…the black line, which (literally) just joins two points on a chart, about 10 years in time between them.
I don’t believe it’s meaningful at all.
That said, I‘m not saying you’re wrong on us „testing“ it within a couple of months.
It‘s more a figure of speech, since there’s no observable mean.
But what we can observe is a long-term upward trend for stock indices - and this yea‘s downturn doesn’t look anything special or exceptional from that trend. It rather seems to confirm it, by approaching the long-term curve.
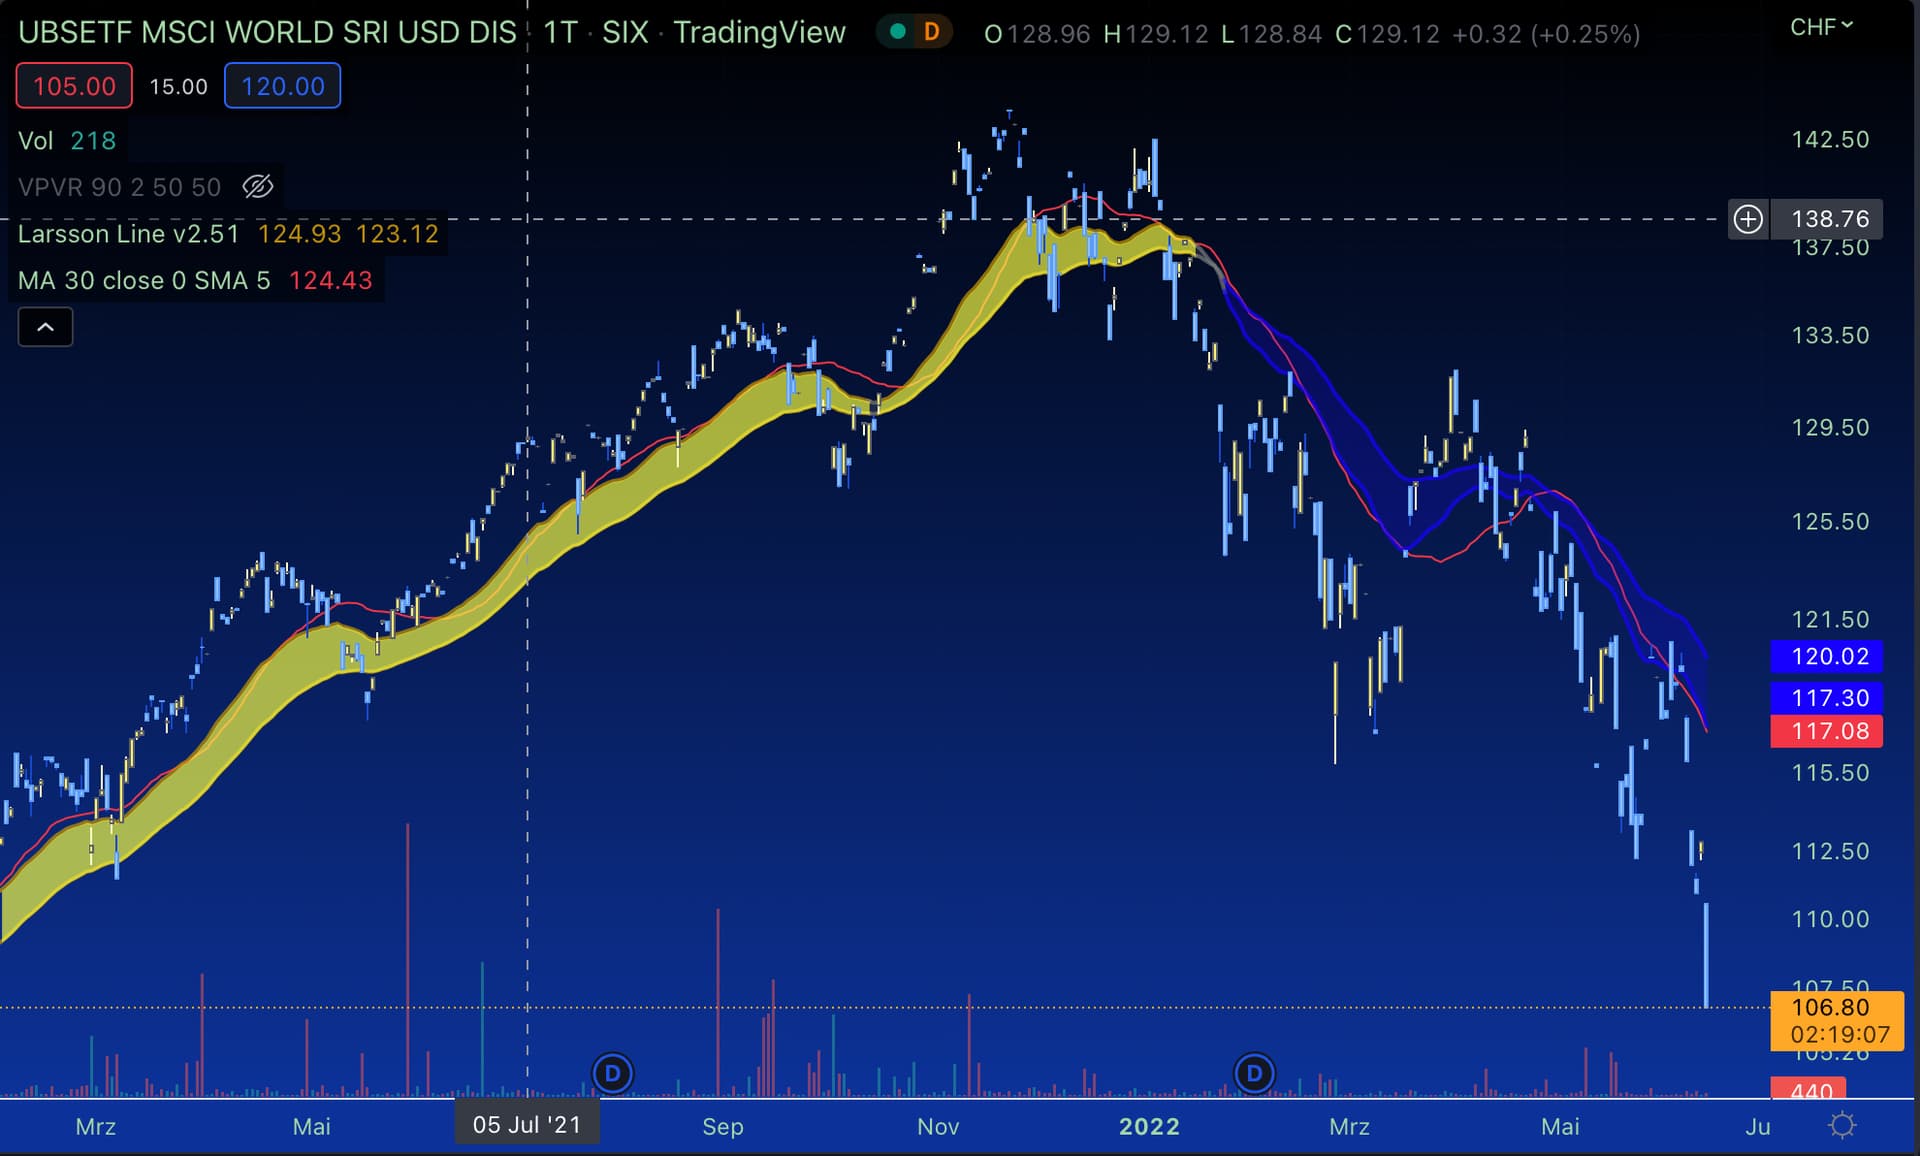
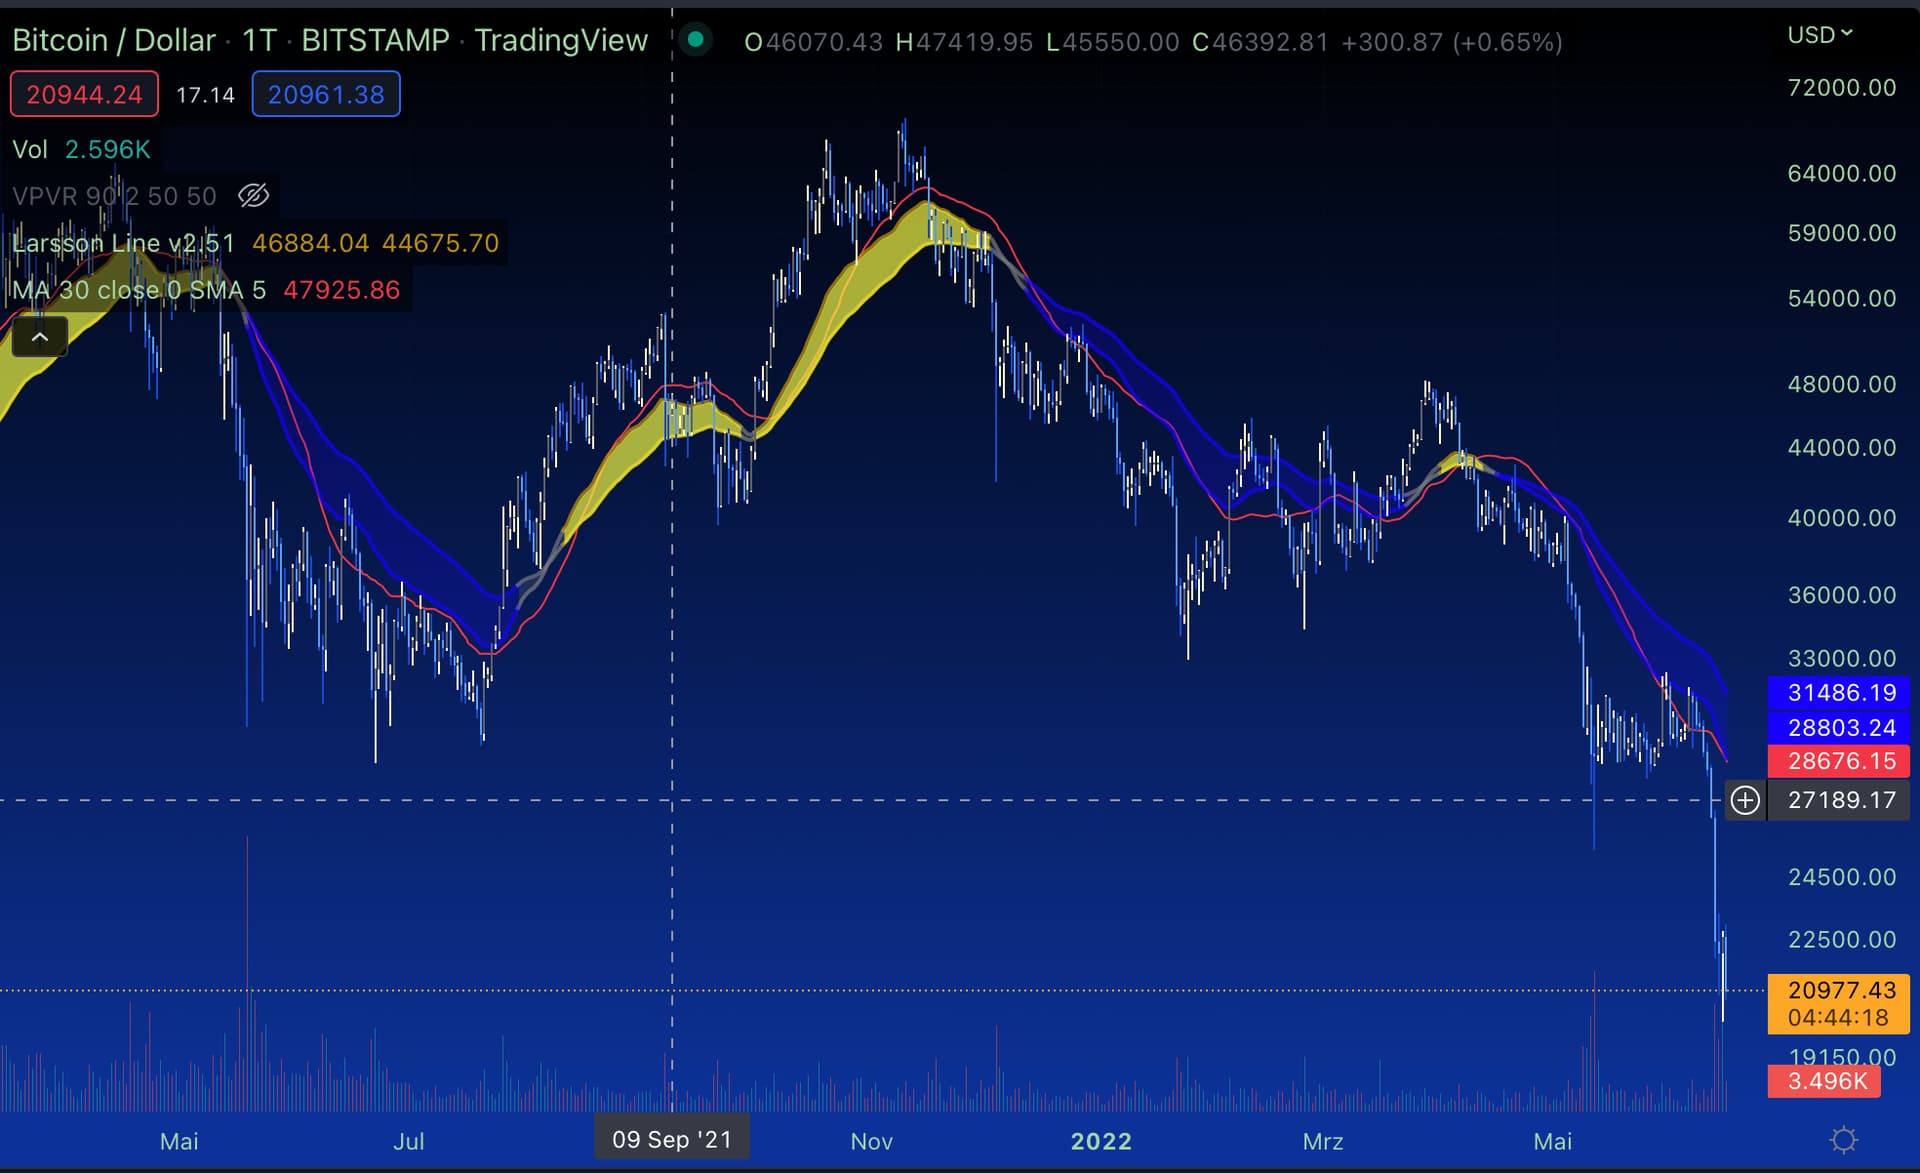
For me global stock markets turned bearish (yellow to blue) in January with no end in sight.
I sold 40% and will redeploy back into stocks when the trend turns back up again, probably still 6-12 months out considering the crazy drops and panic right now
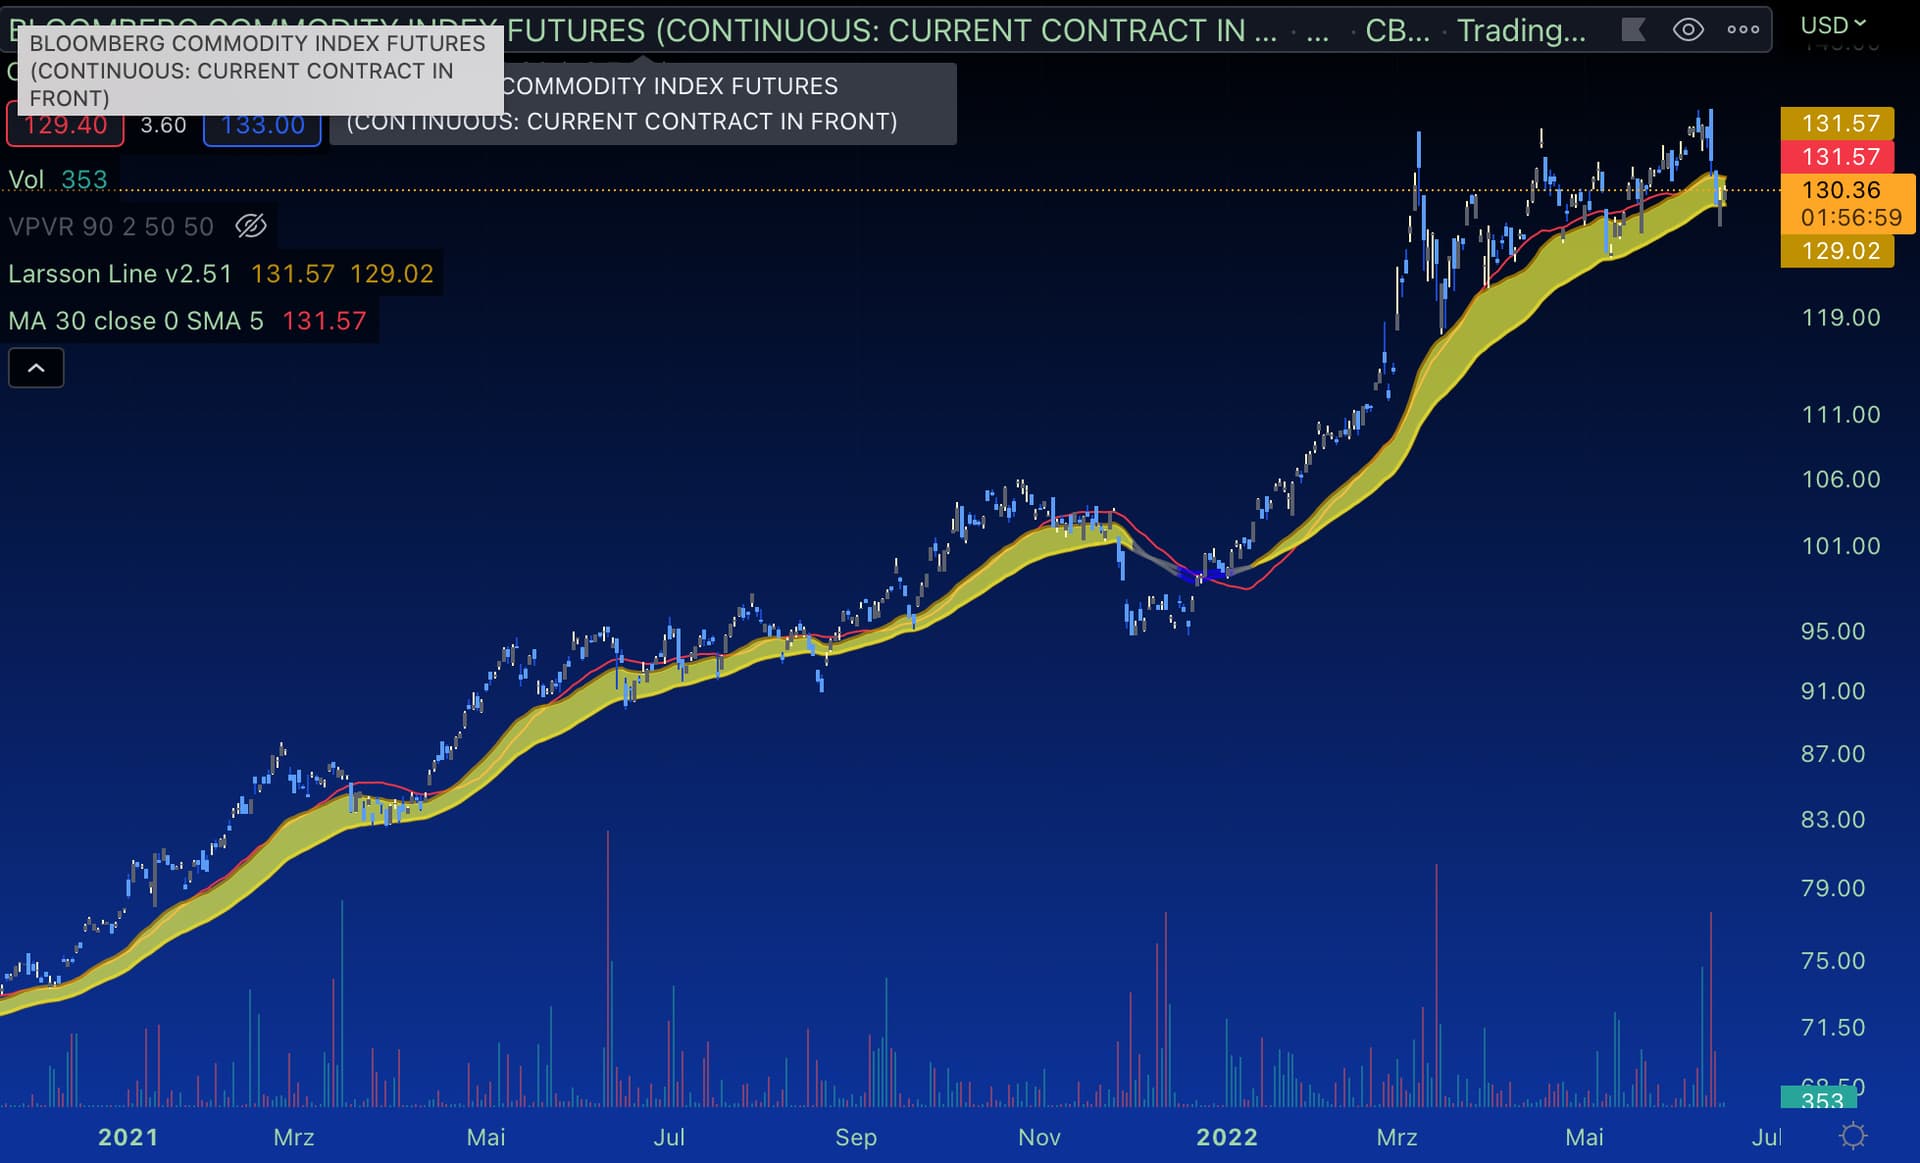
If you don’t believe that it’s possible to identify trends that outperform the markets, resp. don’t believe that there are methods to identify up- and down trends I guess DCAing blindly into the broad market and totally ignoring everything else is the best strategy. It surely has psychological advantages.
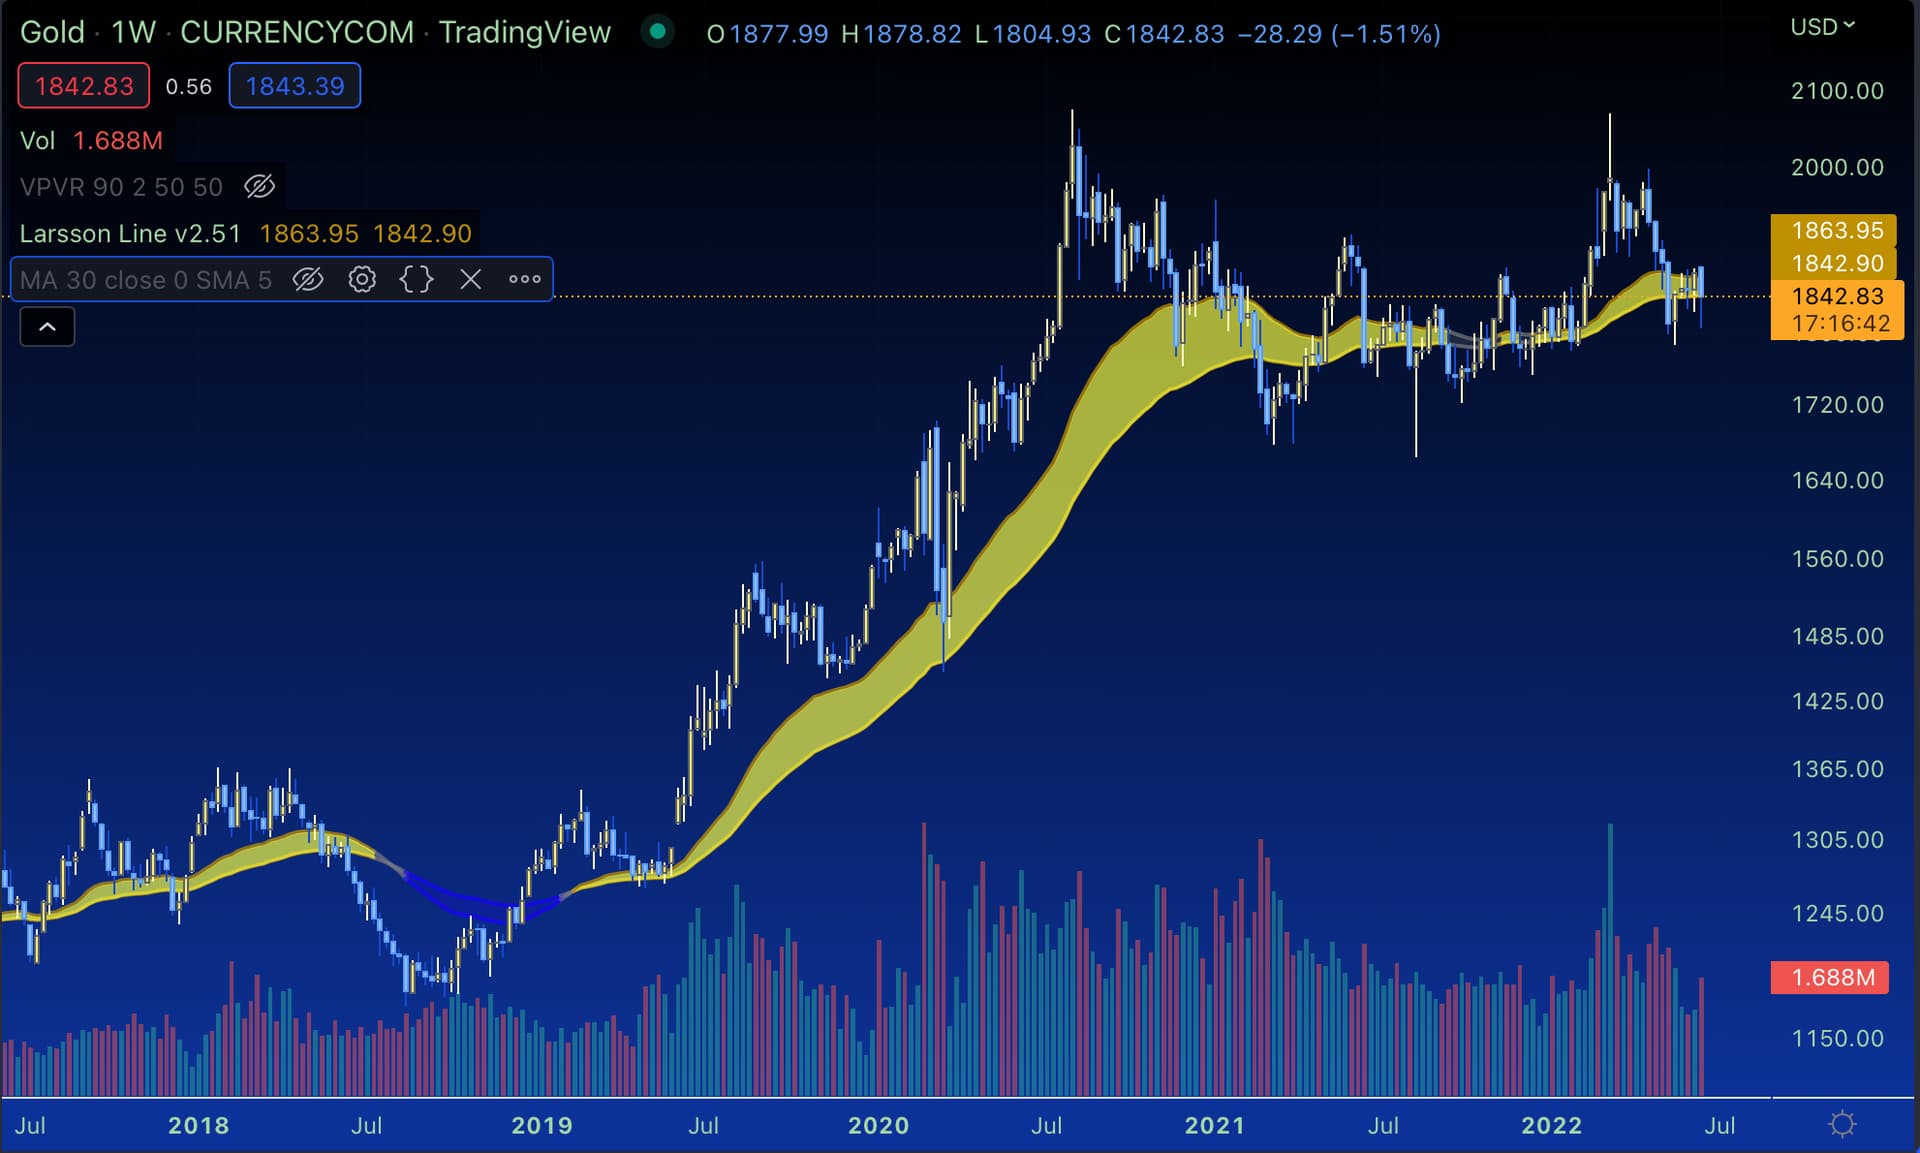
I observe the markets pretty close and leverage during uptrends and reduce my exposure during down trends. Therefore I never buy the dip or dca into a down trend but instead wait for a trend reversal. I’ll never get the bottom perfectly, just as I never sell the perfect top, always a bit later when the trend has confirmed. But not having to hodl all the way down safes me from the big losses and sleepless nights.
I am happy with my results over the last few years and am pretty confident I will be this year as well. Maybe we get a crazy V shaped recovery I’ll kick myself for not being in the market 100%. We shall see…
It’s not DCA. It’s lump-sum-is-statistically-superior-lowest-TER-is-the-only-thing-that-matters.
I didn’t say that and I don’t subscribe to that. You can make reasonable predictions.
Almost inevitably though you will be wrong some of the time. And off about the exact timing most of the time.
What I do believe though: we‘re currently seeing inflation rates and interest rate hikes not seen in a generation. The bottom will not be determined or determinable by connecting a couple of dots on a price chart.
A better approach may be looking at the news and asking yourself: Do I feel that this (downturn) is going to continue - that we’ll see even lower valuations in a month or two?
Mit dem Lesen und der Teilnahme an diesem Forum bestätigst du, dass du die Forum-Richtlinien gelesen hast und damit einverstanden bist sowie den Haftungsausschluss auf http://www.mustachianpost.com/de/ akzeptierst.