Thanks for sharing the Larsson indicator that has helped you outperform and congrats !
In theory if the indicator consistently outperforms the market it ought to be proprietary information. Since by letting others copy the opportunity to make outsize profits disappears over time
I agree with you the market is not always efficient and i was intrigued so researched a bit. It seems the indicator produces the same results as some Simple Moving Average strategies. Mr Larsson may be packaging these up and charging a fee
Even if correct that is not to say SMA strategies are without worth. They can be used to limit downside and if I recall correctly you retired so that would be important. The trade off might be capping returns by missing big “up” days in the market
Or perhaps the comments online are completely wrong and this is something new the market has not caught on to yet. Anyway, congrats again for the outperformance which is the main thing
You are absolutely correct. It’s the same idea as most SMA strategies and similar results can be achieved with them, it’s not about beating the market, but exposure to it. It’s neither black magic nor rocket science.
Most big “up” days are between big “down” days so I am not missing them.
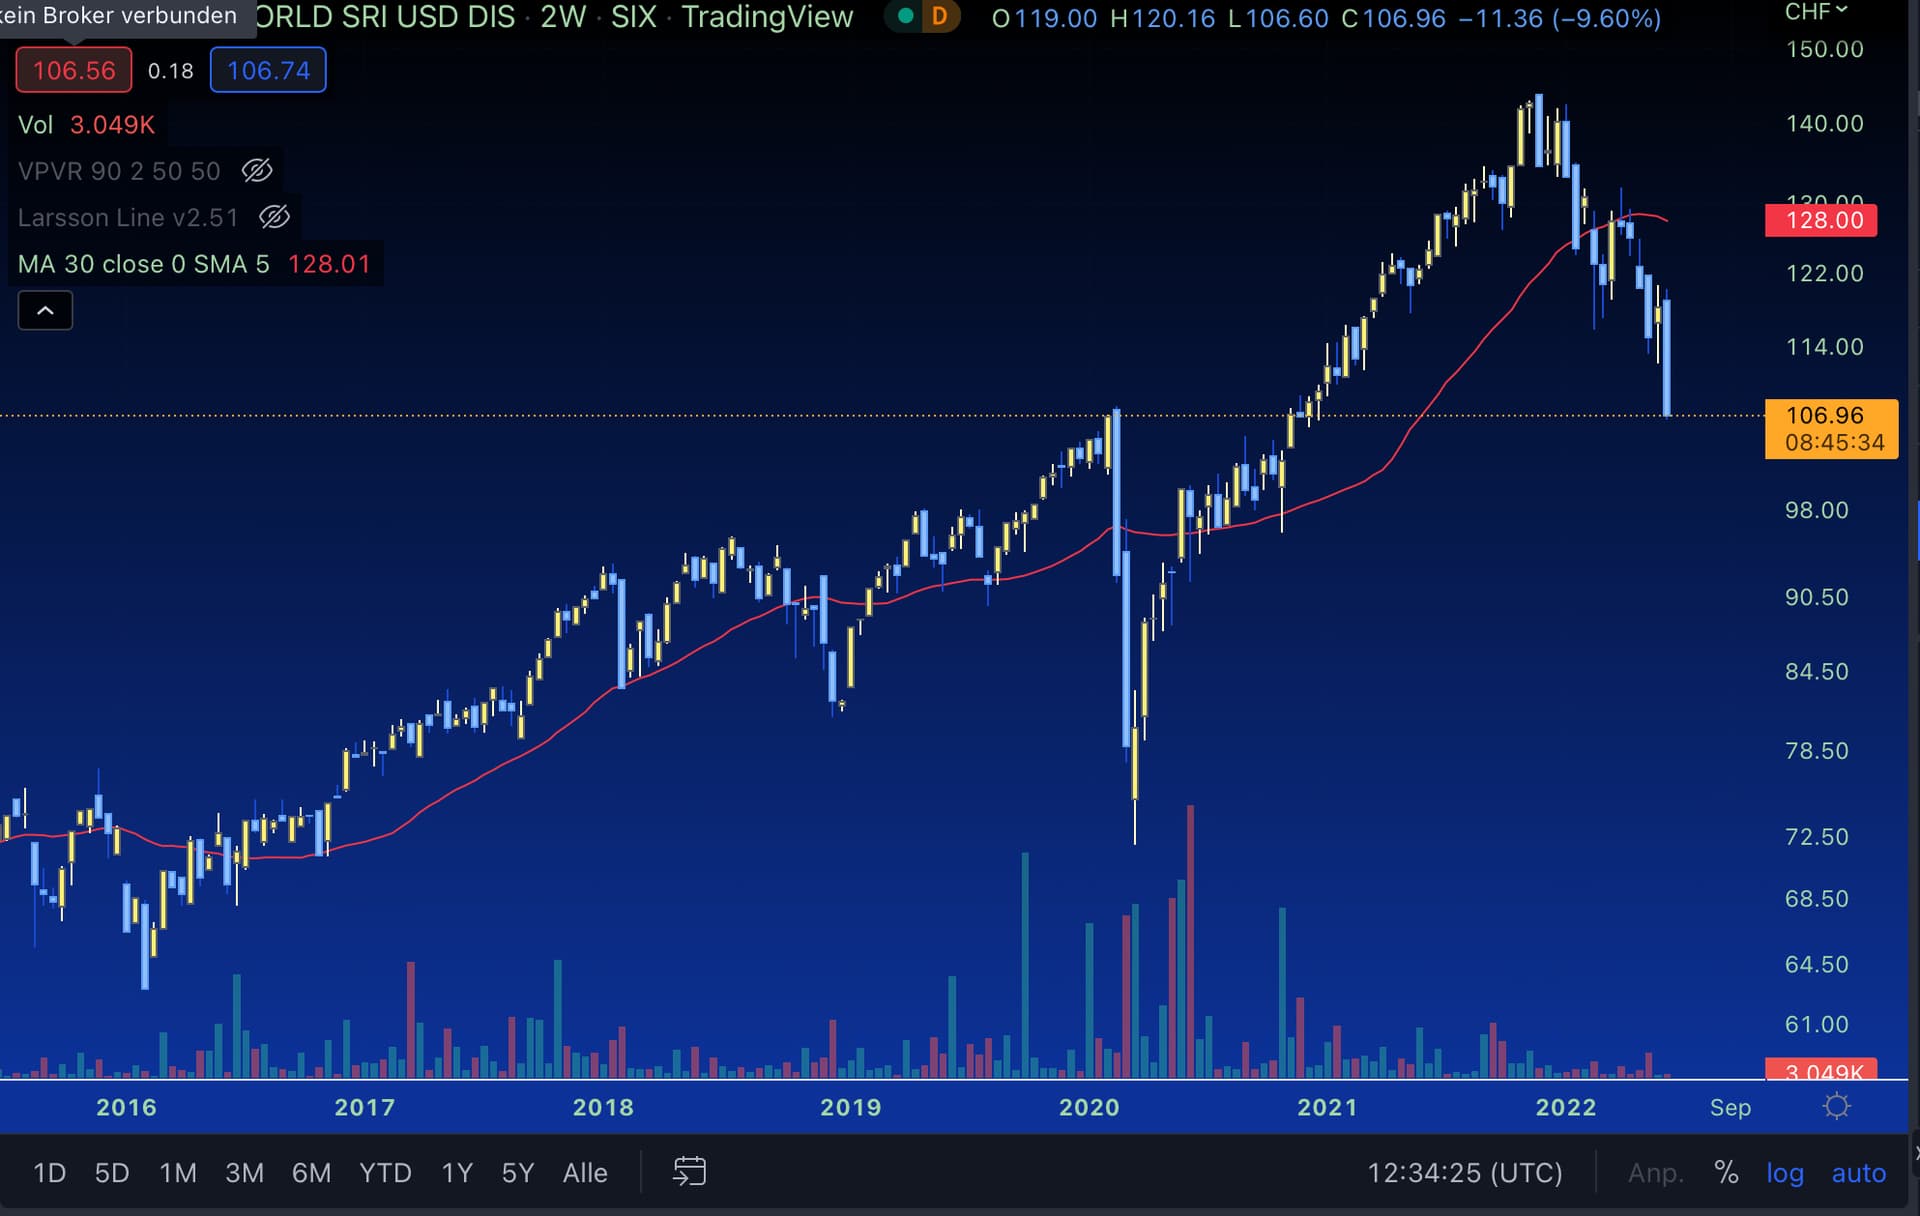
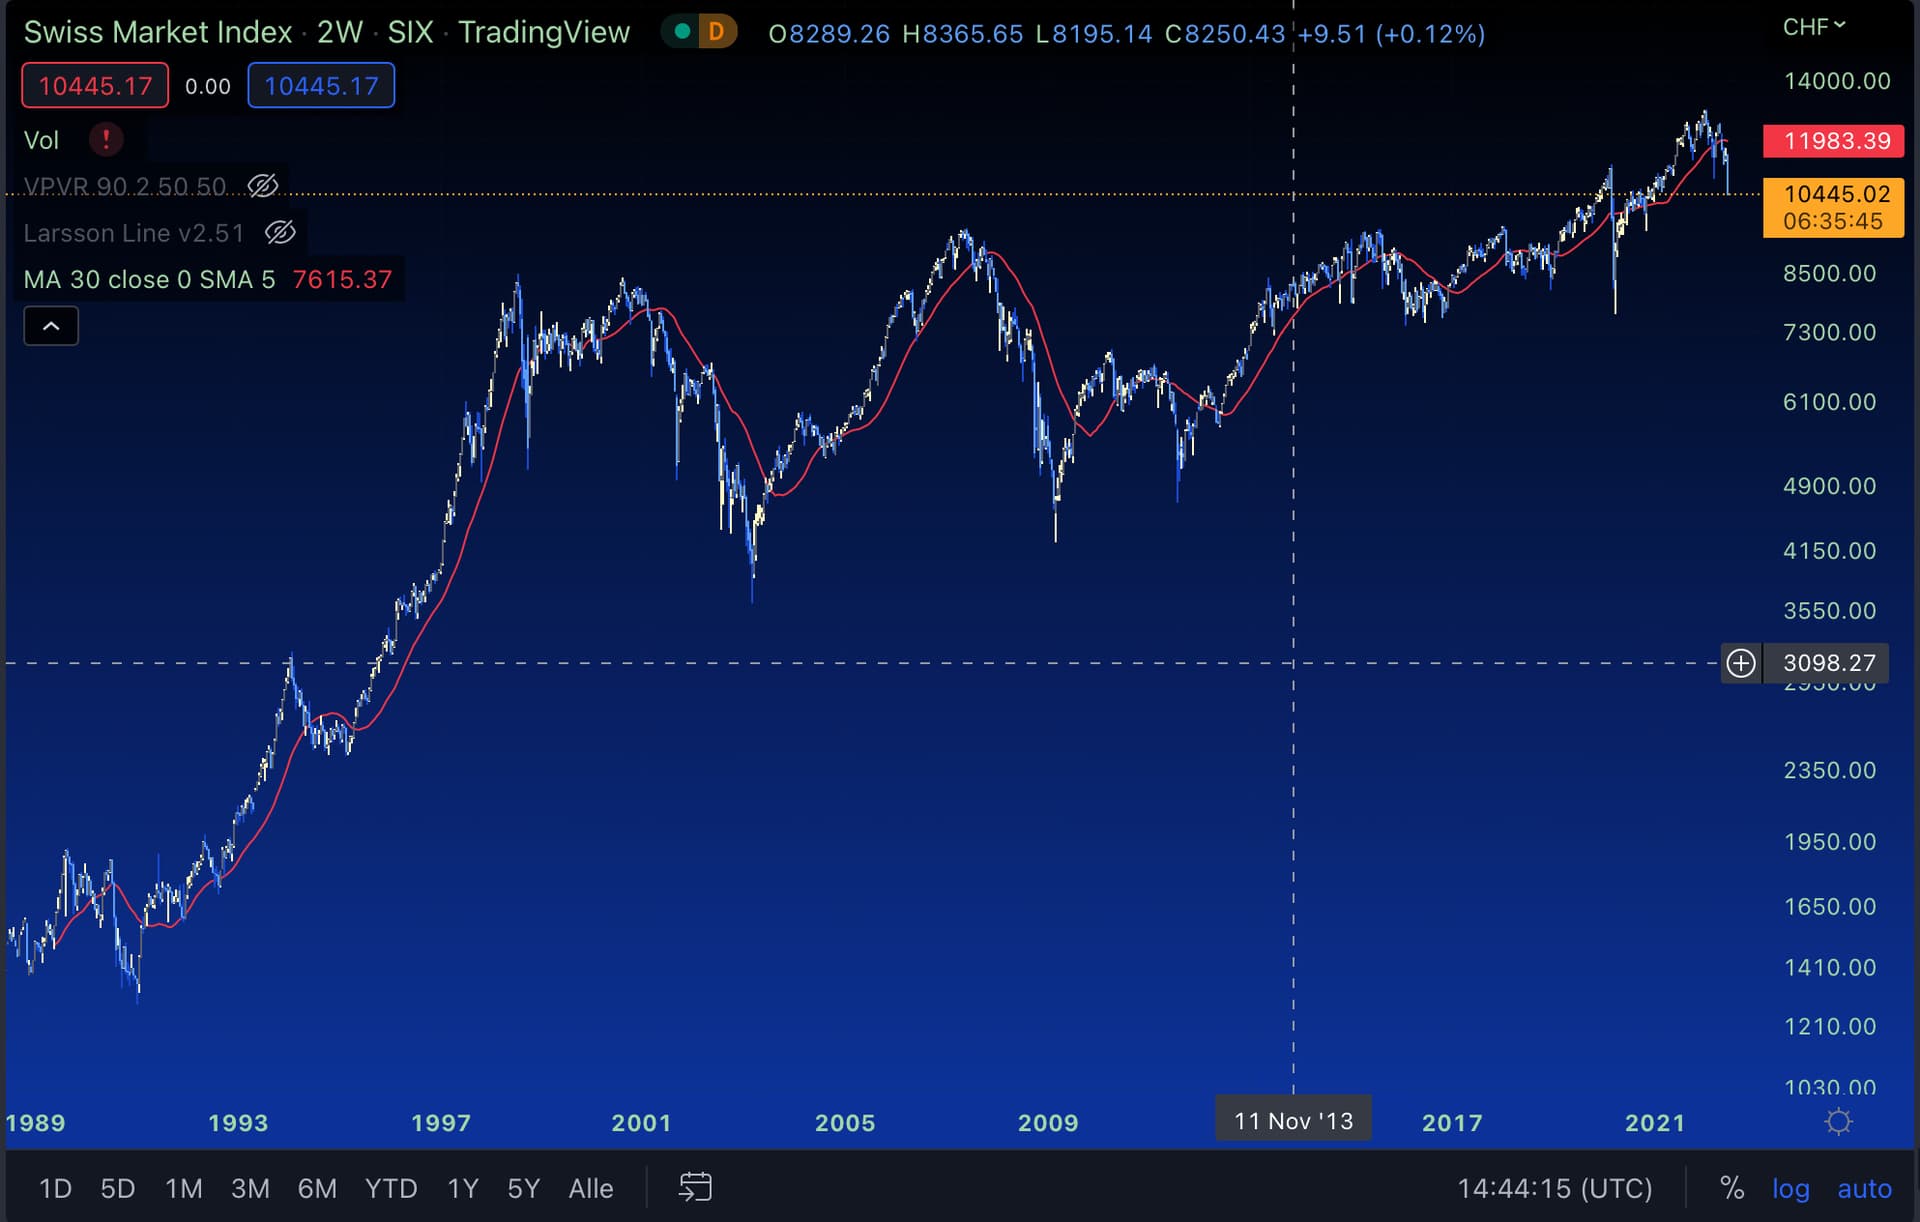
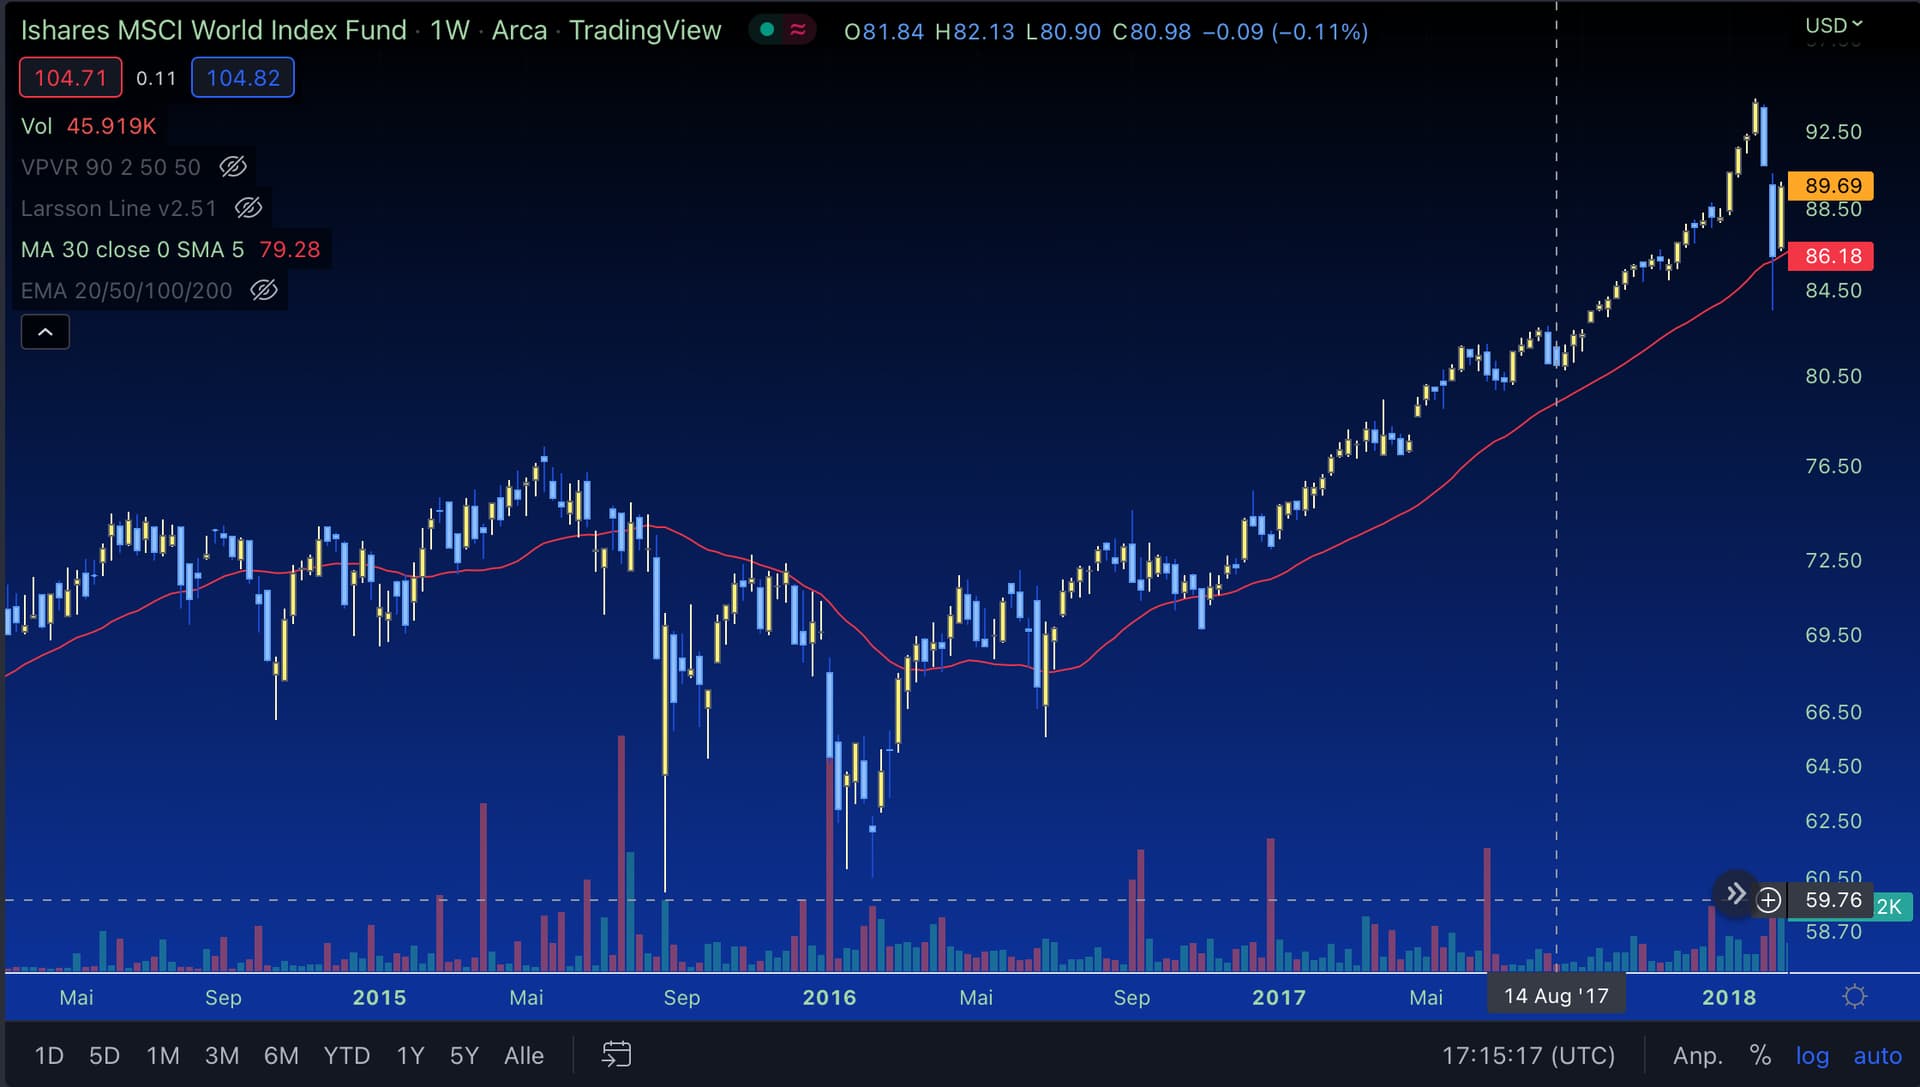
A 30 SMA on a bi-weekly stock chart will get you a similar exit point:
No, the bottom is not determined by some points in a graph. I expect more big drops, a long bottom and see no reason for a fast recovery. An indicator for reentry when the trend turns is all I need.
There is no crystal ball to tell the future, but there are pattern in the charts that can be used to make a high probability guess what’s happening in the markets mid term.
I’ll be wrong many times, but more often I’ll be right, so that’s fine.
You can try to predict as much as you want, and this is what this thread is about. But can you profit from your predictions and outperform the broad market? And do it for 10 years?
You know, I have spent quite a lot of time analysing US ETFs. There are lots of them that are claimed to be backed up by an experienced managerial team and a super clever strategy. I won’t go back to these data (okay, I will) and just tell you my impression. There are not many strategy ETF that were launched more than 3 years ago.
Yeah I noticed that.
When we’re outside in the park with my kids and it starts raining and I tell my daughters to go inside until it stops they get it immediately.
If I apply the same logic to the stock market and tell people here that I am seeking shelter during a crash I am clueless idiot because I have no idea how long it rains, and maybe it doesn’t rain and anyway we like getting wet
Well I guess the ETF industry did some great marketing…
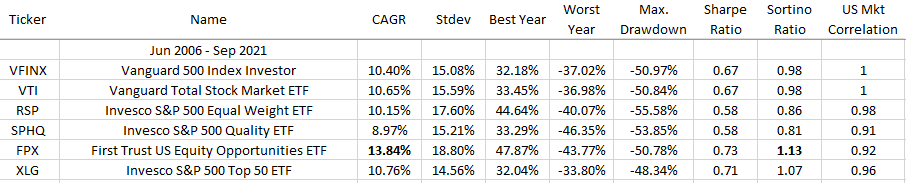
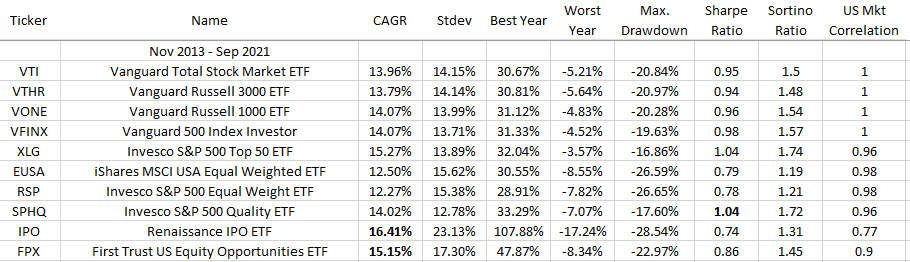
Basically IPO and momentum were outperforming the broad market. From the market cap weighted indices, Top 50 was the most performing. SPHQ quality was outperforming only on risk-adjusted basis.
So, show me how your strategy have outperformed the broad market.
OK I try to clarify.
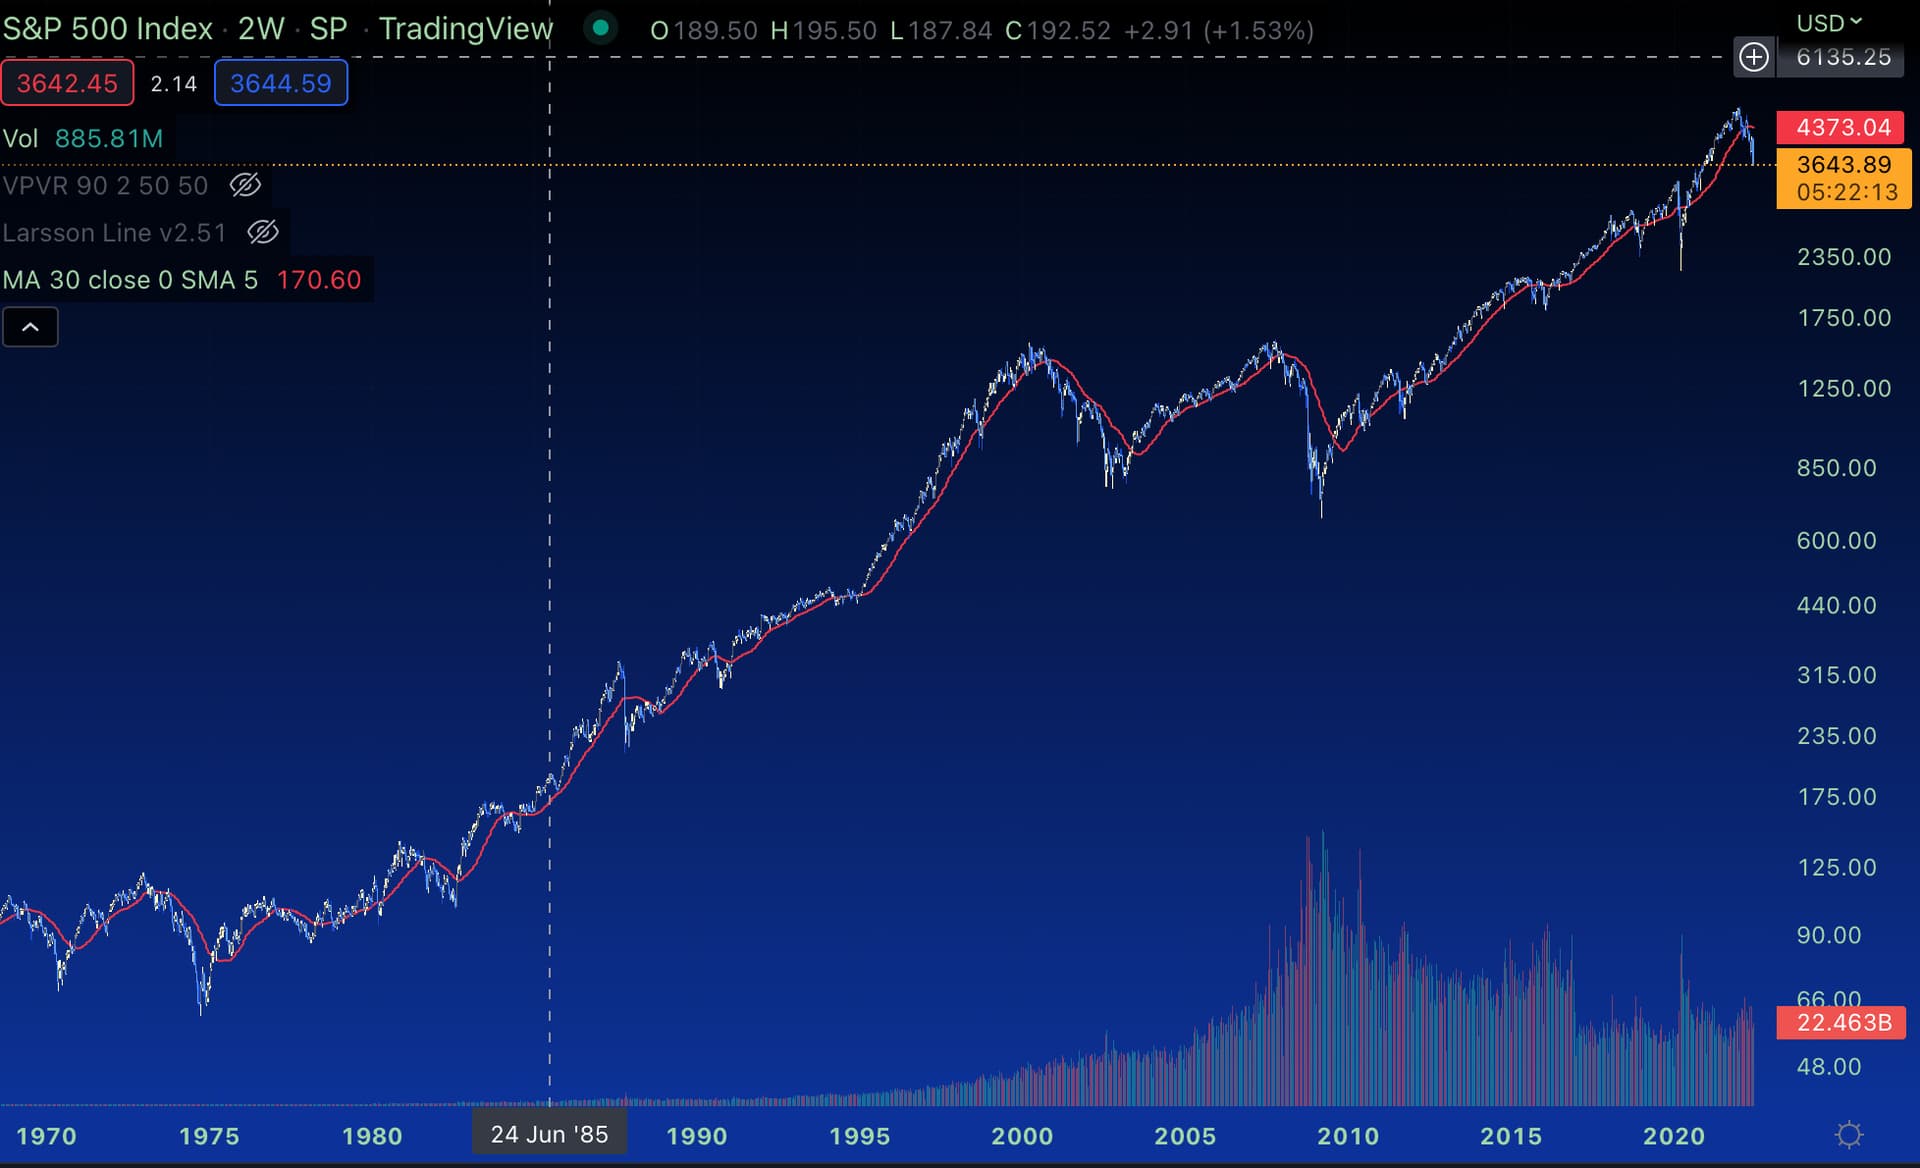
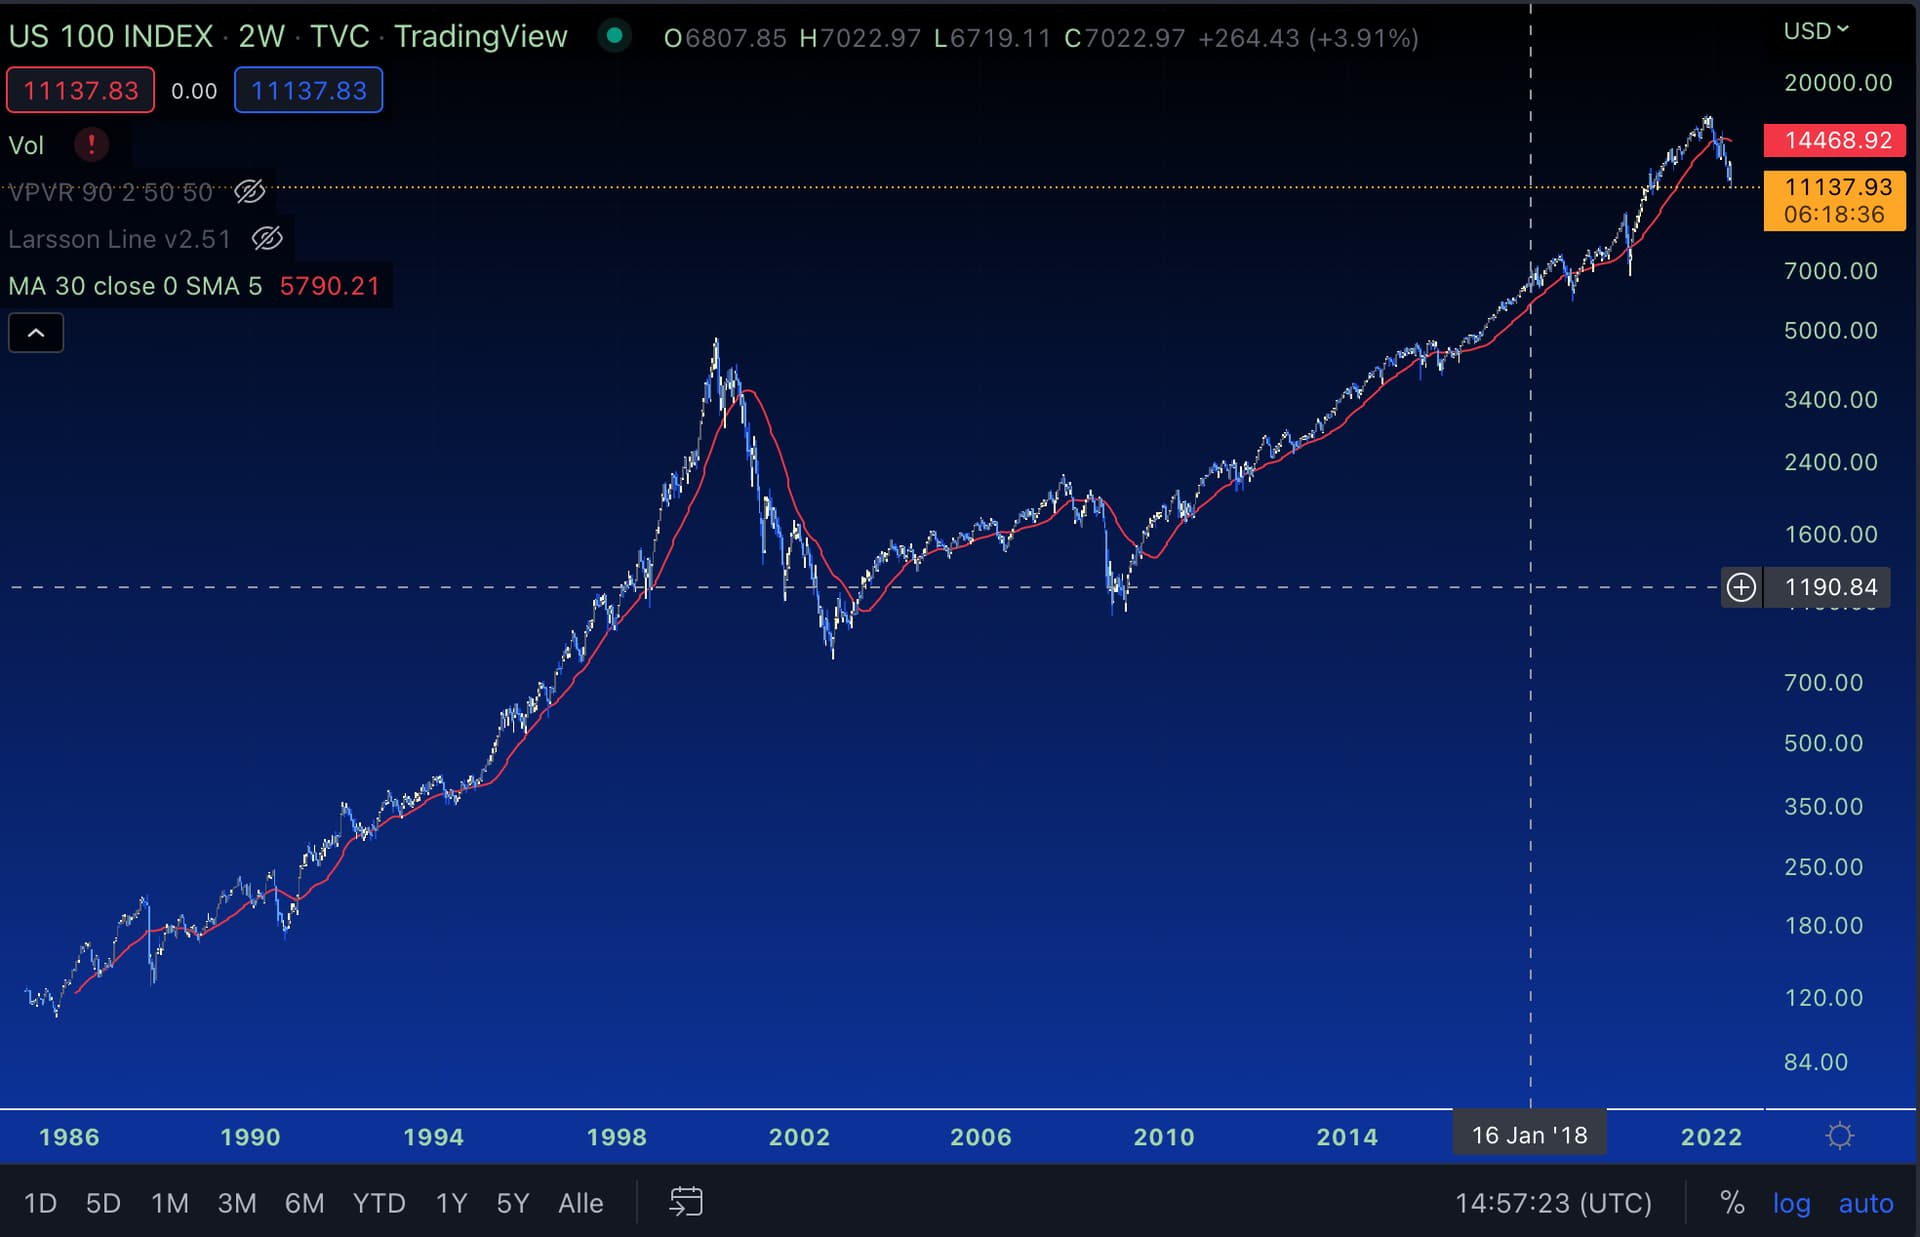
Imagine that you are only invested during the time the index is above the red line (30 SMA) and get out of the market when index is below the red line is below. You take 90% of the profits but avoid 70% of the losses
It sounds great in theory, like all these wonderful multi-factor, sector rotation, market state funds (I look at ETFs because it is easier to find information and we can actually buy them). But somehow they are not overperforming and closing after few years.
I did the calculations once with the EMA 200 line and I think it works at least with IB where trades are cheap. However, I think I would not be sufficient data driven to stick to this approach. Maybe I will learn it in the future. From the past we can see actually that you can get superior return with these strategies. The question is if you can get a significant better return including the false trigger points. Interesting topic indeed.
What I have never really understood is the average with these strategies. While I see that with the EMA 50 or EMA 30 you enter again lower than you exit what about the impact of missing the buy at the super low entry points assuming that the total amount of money (in my case 5000Chf each month) remains the same?
The online articles that I could find conclude that SMA investing has lower risk compared with buying and holding but no evidence of higher return
This makes some intuitive sense since if I look at the charts you posted there would have been several big “up” periods you missed and others where you would have been foreced to buy- selll -buy -sell etc regularly
You would miss out on dividends when out of the market too.
And if it was so easy someone would have figured it out by now and we would all be trying to do it…
@Wolverine has an entire thread on the topic, wonder what he thinks
For short periods moving averages, 2016 comes to mind. 2018 may also have some false positive situations. For longer ones (200D and the likes), you’d be looking in the range of 2010-2014 for those I have on the top of my mind.
Yeah you are right 2015-16 the msci world was hovering around the MA without clear direction…staying put would have been better, at least in saving fees
This is all back fitting. There is no guarantee that the chosen threshold would work again in the future. And then when things don’t seem to work, people get hitchy and deviate, and start using 25 instead of 30 eg trying to adjust etc .
So investing is in reality the mastering of discipline. It may be that a moving average strategy reduce volatility, but it requires discipline & an alert system that could be stressful.
Many, many strategies have worked great in back fitting from 2010 - there has been a big upwards trend with clear patterns.
If we enter a sigsaw, horizontal market that last 4+ years, a sma based system get crushed and keeping discipline impossible
Emphasis mine. That’s mostly true for every style of investing that doesn’t match your risk tolerance, and even those who do aren’t easy to follow through thick and thin. Buying and holding is no different: it is simple, not easy.
That being said, we all react differently, there are some who find discipline impossible, there are those who can’t even understand why emotions would have anything to do with investing at all since they have made equanimity their domain. That is why personal finance is personal and we should be wary before recommanding investing styles to complete strangers.
I see comments like these pop from time to time and I don’t understand them.
I’ve seen no Vanguard evangelism that I can tell. Sure, VT is considered the gold standard but that’s because it is a cheap, globally diversified ETF with good AUM.
If we’re getting into broadly diversified CHF hedged intermediate term bonds funds, I’ve been seen displaying Blackrock’s AGGS as taking the pot and I’ve yet to see someone argue that VAGX is better.
Regarding passively investing in cheap, broadly diversified ETFs, that’s the default because it’s the strategy that guarantees you get market returns. Deviating from that would require you to have a reason to (and there are good ones) but we don’t know who reads our messages and what their personal and financial situation is. Giving a hedge to the default means you need real determination and personal conviction in your investing style to go for it. Conviction is required to stick with any given strategy so I see it as a huge plus (take it as the “are you sure you want to delete this file?” window in old Windows OS, it doesn’t prevent you from deleting whatever you want but it tries to make you pause and ponder your decision).
That being said, I don’t see much of a backlash against other strategies than buy and hold.
@xorfish regularly touts factor investing and gets positive questions about it.
I’m openly market timing and have had no backlash to speak of about it. @Julianek gets a lot of praise for his very insightful value investing posts.
Even the GME thread got more interest than backlash.
Cryptos, TSLA and often leverage tend to drive more aggressive comments but that’s still a far shot from “everything but “VT and chill” gets shot down without any consideration”.
I think trading on moving averages changes the risk profile of your investments without guaranteeing better returns. It should give you some comfort during big downtrends but can also kill your investments when everybody else is flat or slightly up. You have to choose your kind of disheartening and stick with it.
I don’t like following a single moving average because they keep getting in and out during flat markets, generating fees, a lot of trading and probably underperformance.
Using more than one moving average usually comes with the problem that you loose access to your signals right after entering or exiting the markets, which can be stressful and disorienting. I’ve chosen to sacrifice some upside and take on more downside in order to always have a clear signal and limit the number of times I have to trade, though some times, like these ones, tend to bring a lot of mess with them anyway.
I find that it is highly dependent on market conditions. It will outperform in some situations and underperform in others. It’s easy to backtest and get the exact best indicators for past conditions but we don’t know what the future holds so, at any point in time, we’re still exposed to a risk of winning and a risk of loosing.
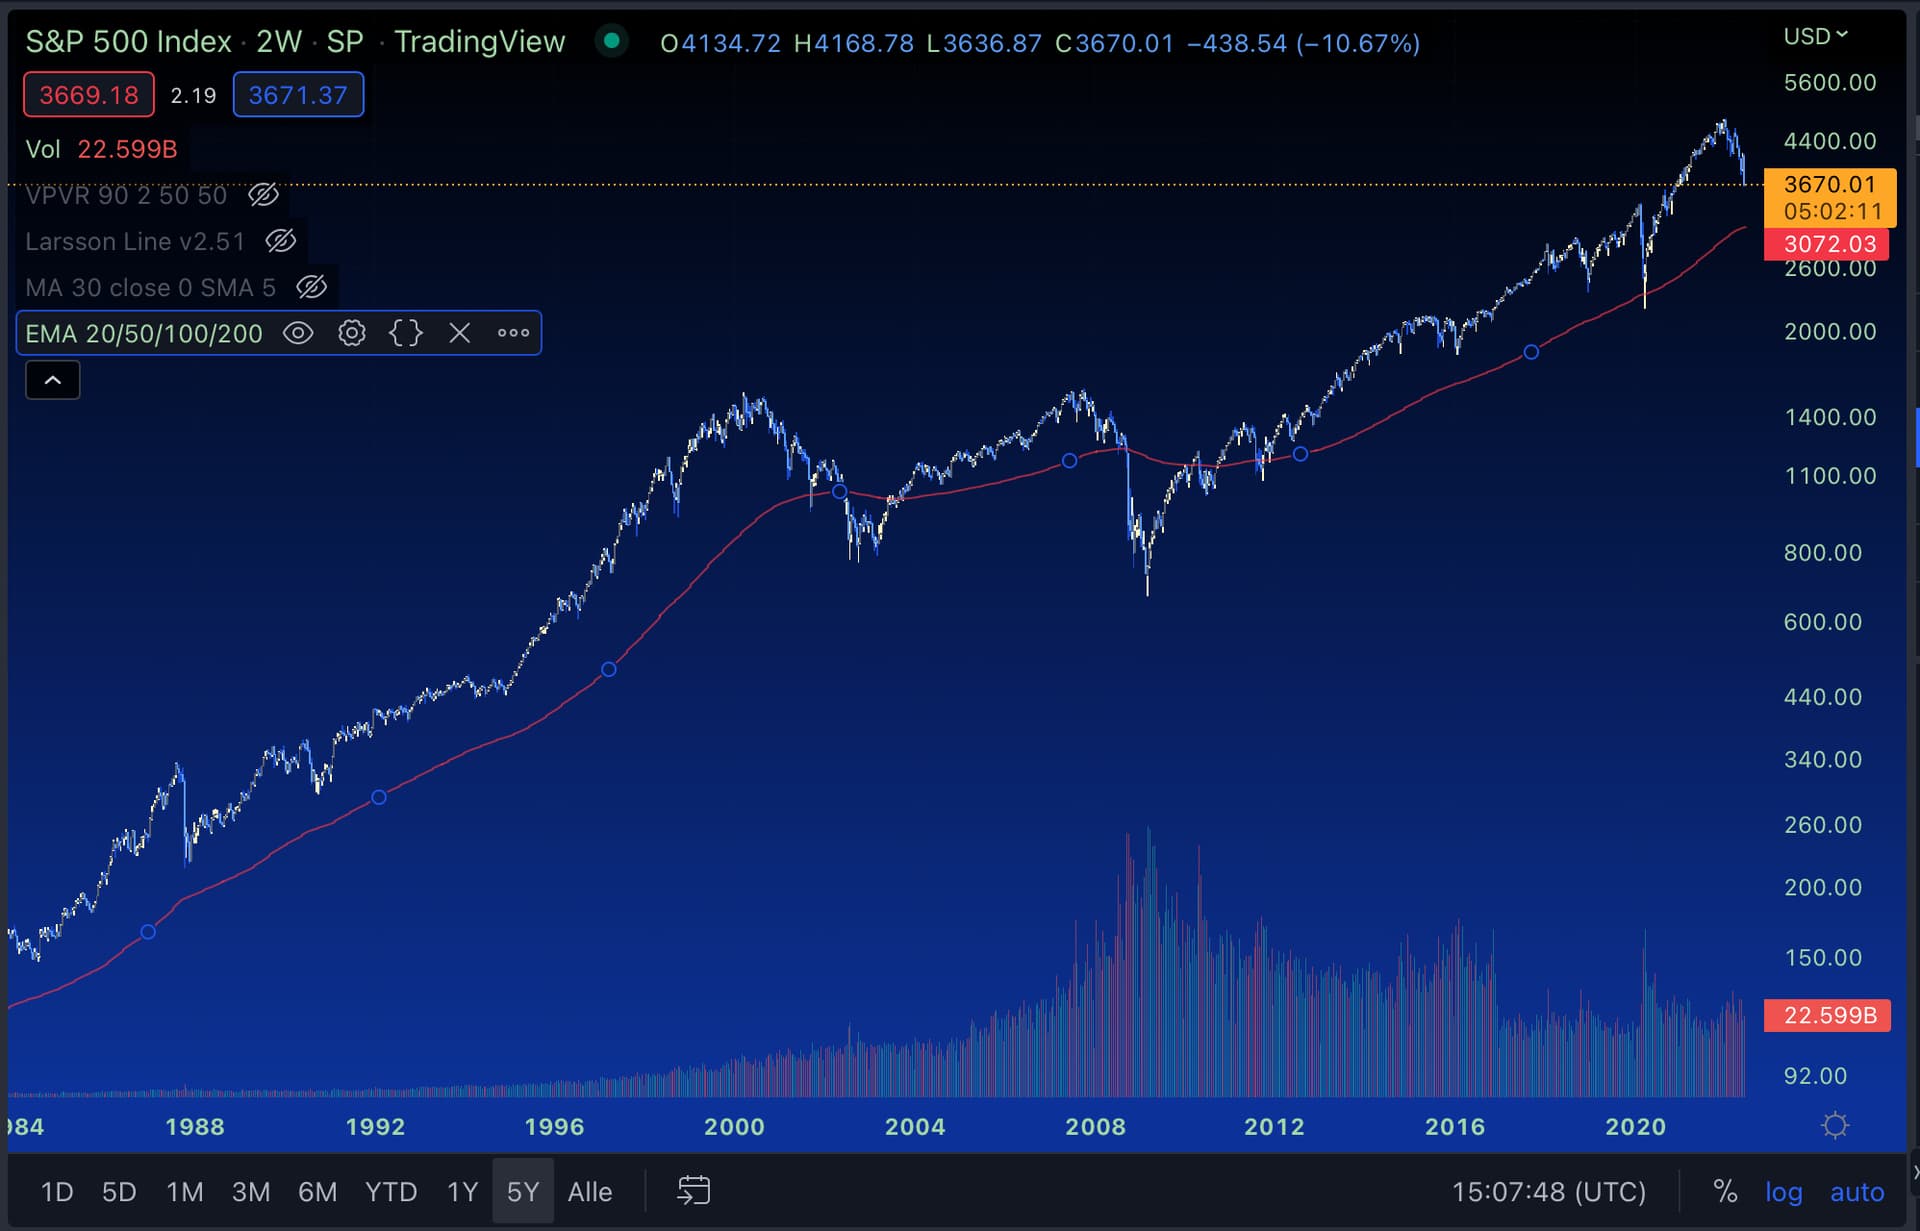
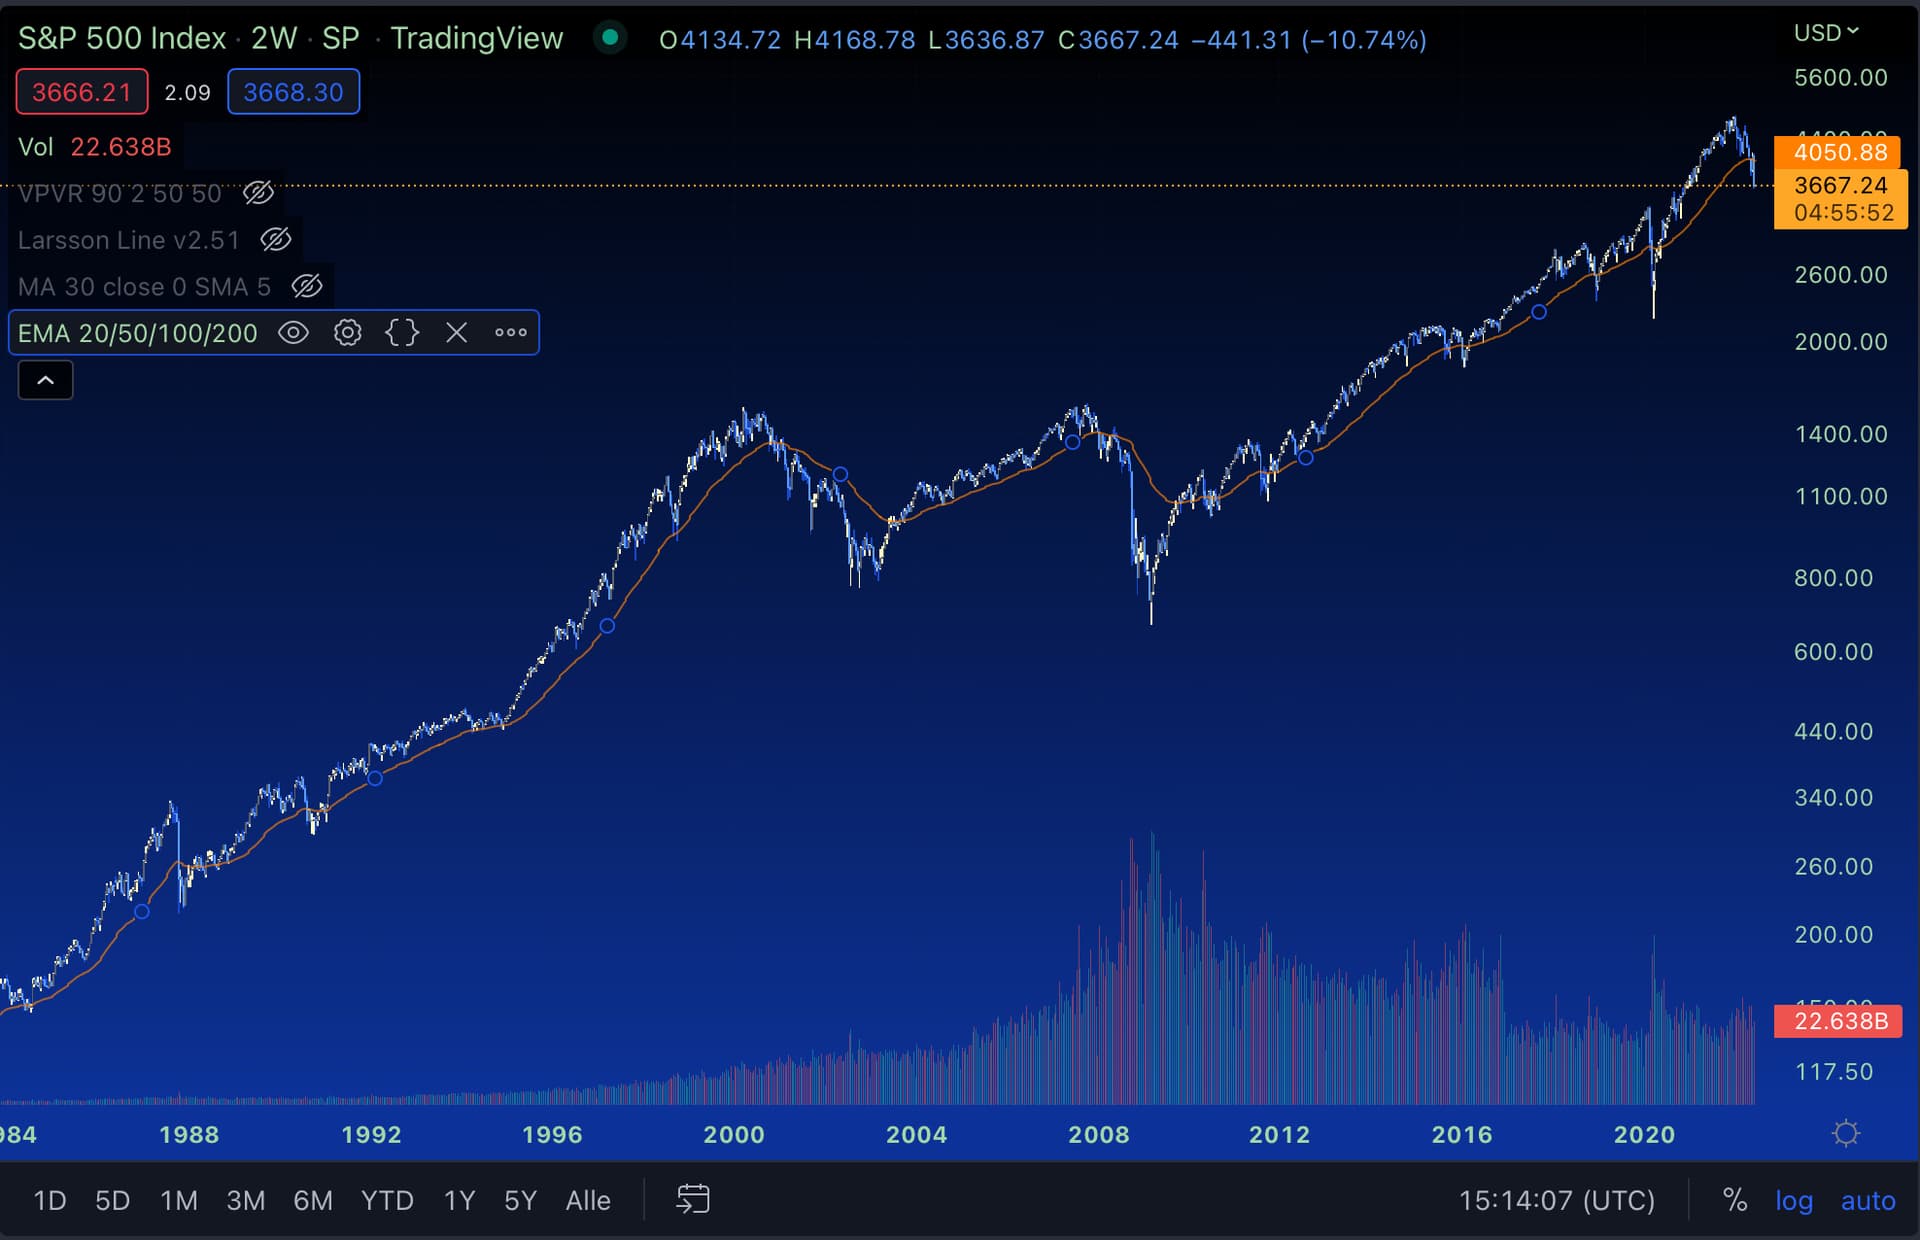
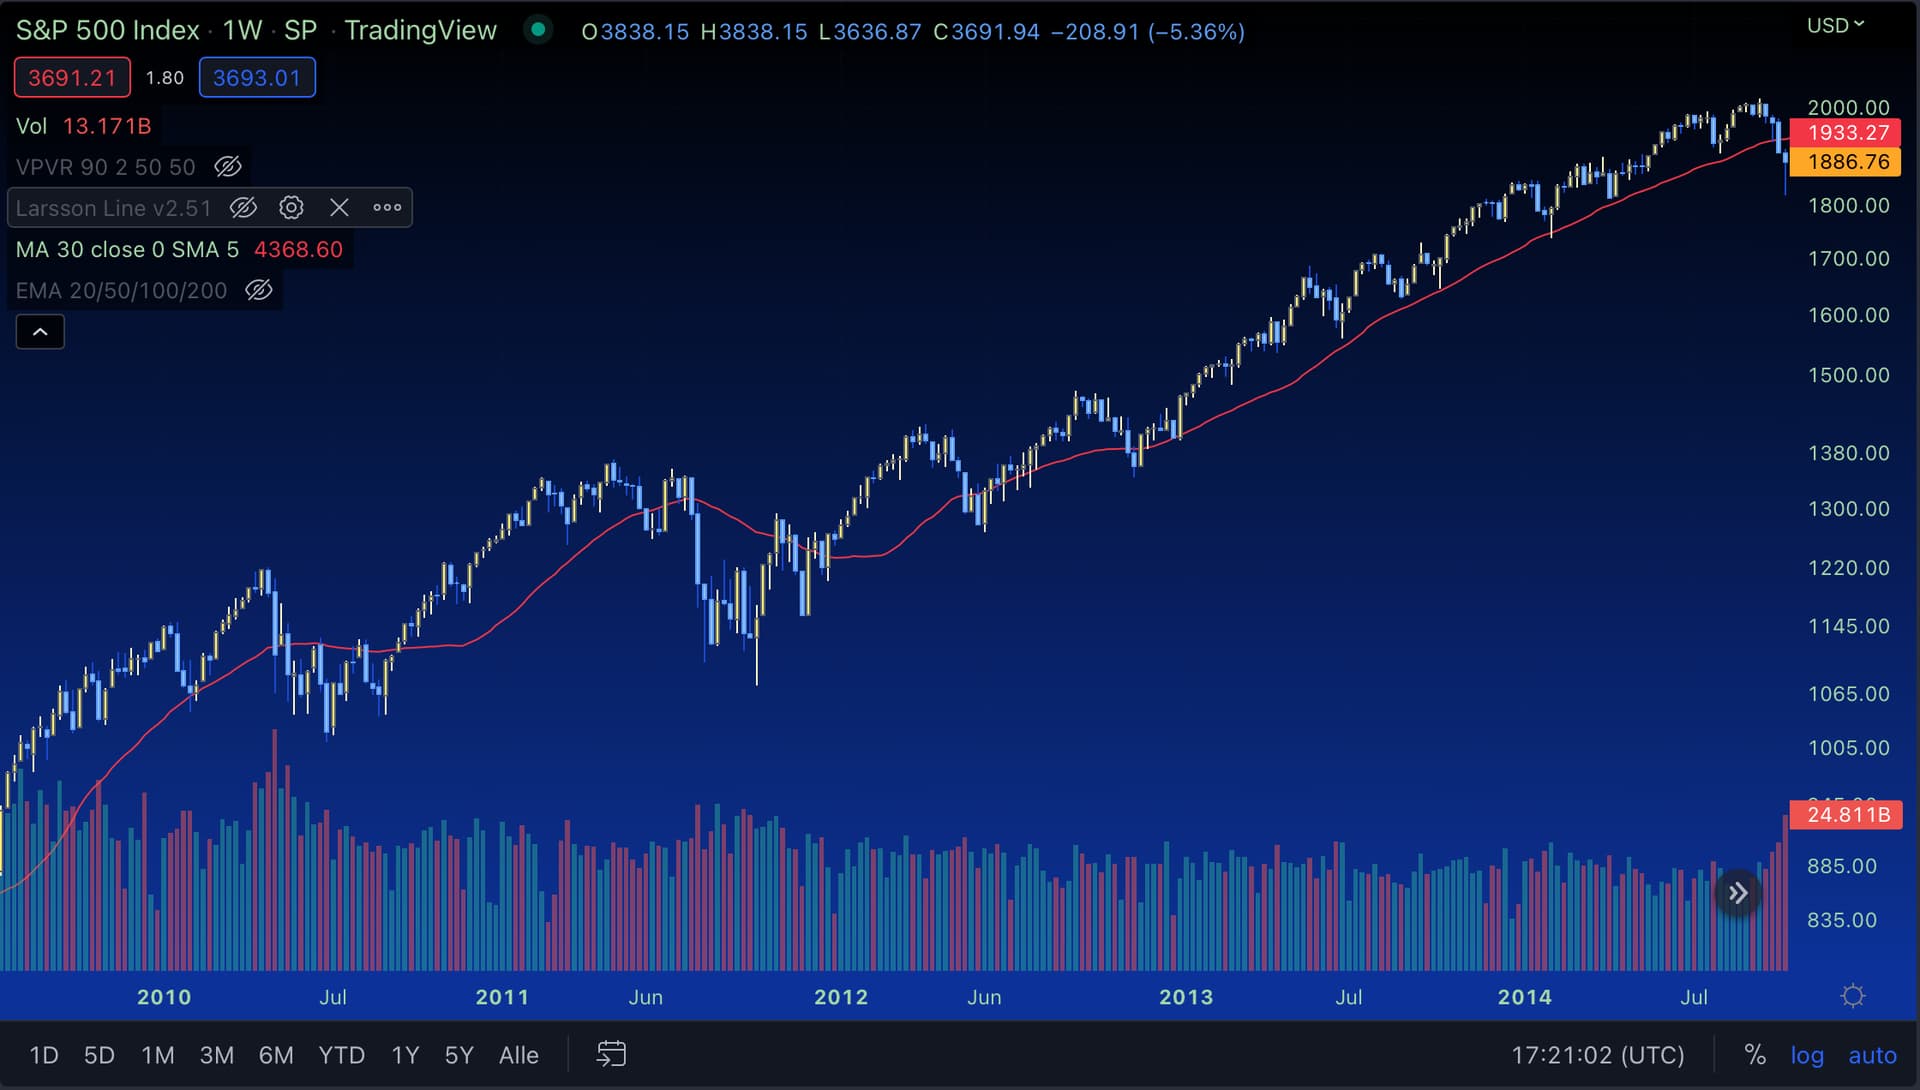
I’m sure you can come up with conditions where the strategy wins but the test with the 30 days SMA on the SPY since January 1994 I’ve mentioned above gives both worse risk adjusted returns (lower Sharpe and Sortino ratios vs Buy & Hold) and a lower CAGR. It does have a lower max drawdown so it may fit some investors if that’s what they’re after.
Other strategies will have other benefits and downsides. No matter from what angle I look at it, it always seems like a game of tradeoffs to me. There is no absolute best strategy, there are strategies with different properties that may fit you if they emphasise what is important to you while their downsides don’t matter much to you. Another investor might get turned off by the downsides and find a strategy that seems awful to you most suited for their own needs.
Mit dem Lesen und der Teilnahme an diesem Forum bestätigst du, dass du die Forum-Richtlinien gelesen hast und damit einverstanden bist sowie den Haftungsausschluss auf http://www.mustachianpost.com/de/ akzeptierst.