the returns are very much from individual stocks with VT kept at 20%. I tried options a handful of times over the past years and regularly had miserable outcomes, clearly telling me I should simply leave that to others. ![]()
1 Like
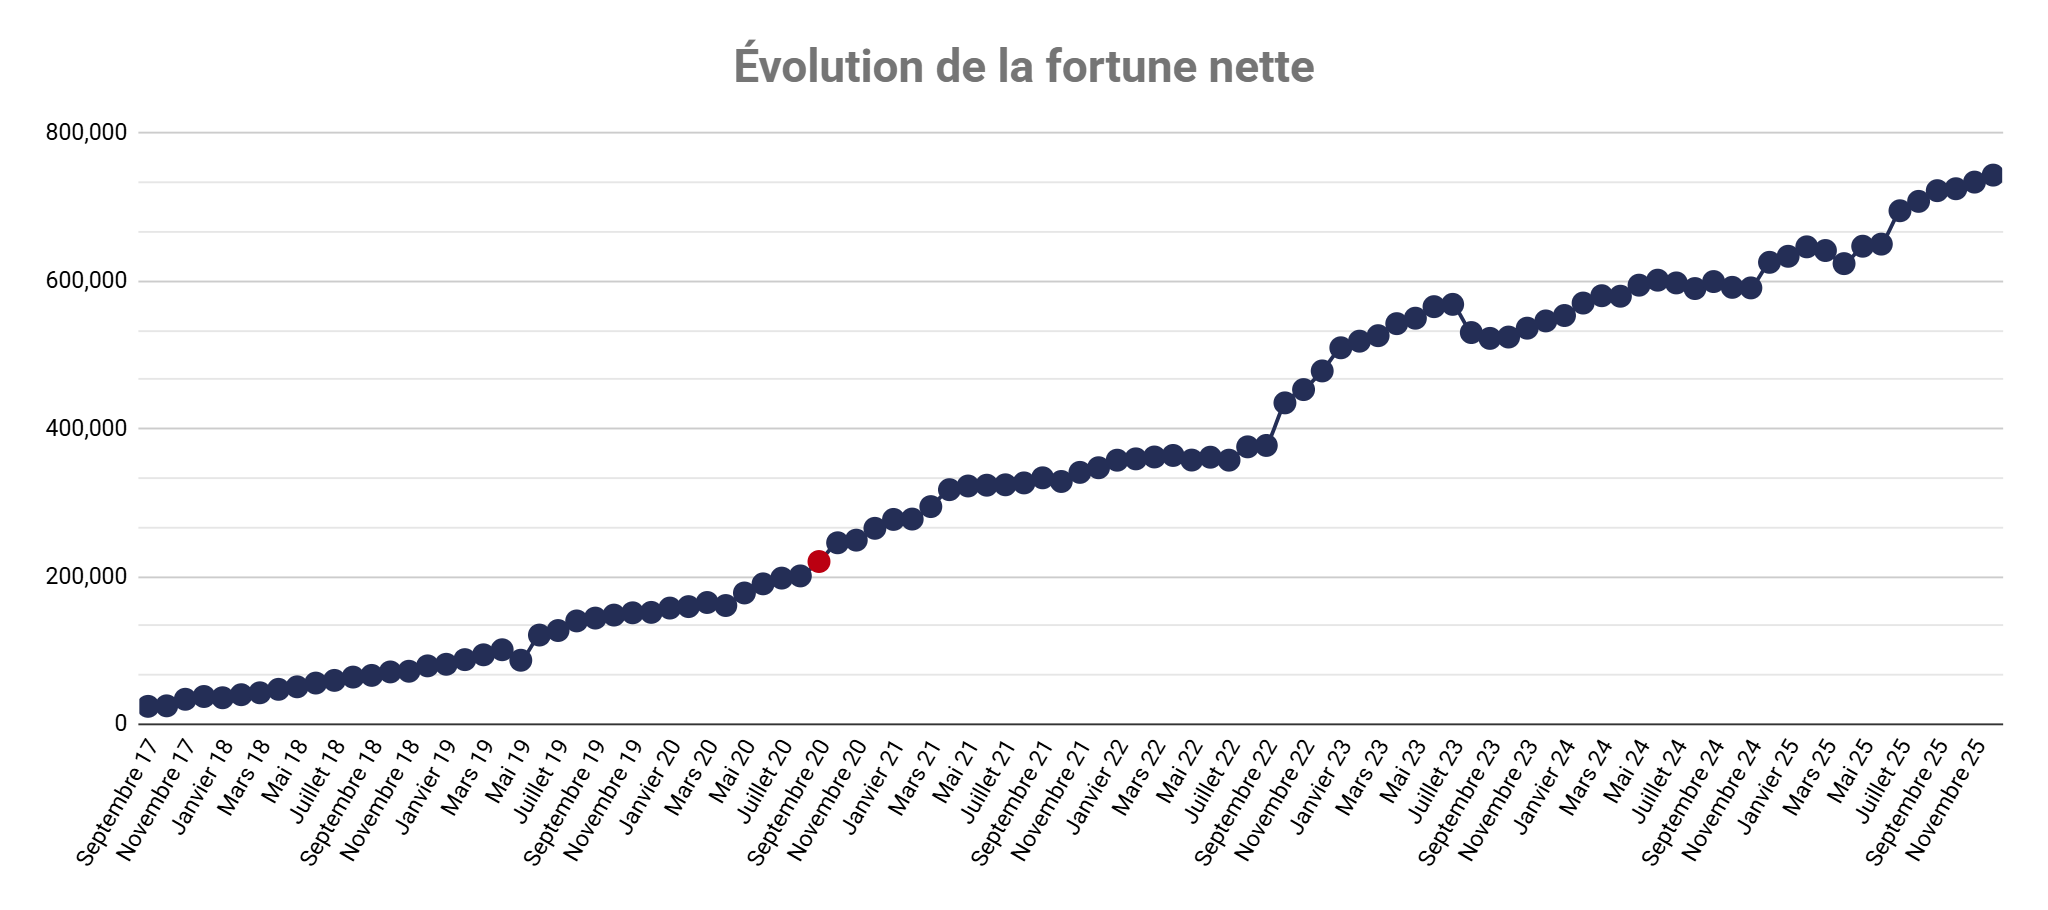
at one point in 2022 I had hit a low of around 92k and seriously contemplated what the hell I was doing. The raging return of the stock market in the following months (years actually) was a godsend.
You had an interesting experience in terms of relative return, let’s see how you’ll hold when the same happens with seven digit figures.
Hopefully the same ![]()
1 Like
oh, thanks… than that chart is complete rubbish?!
I have assets in USD, GBP and EUR denomination, and they should all be shown converted back to CHF, but apparently that’s not what’s happening. ![]()
in the performance chart of your own global portfolio is in your global currency, with everything converted to your base currency. This should be correct (never checked it in detail though but seems fine).
Only the displayable benchmarks stay in their own currency and are therefore unusable if your base currency is not the same.
2 Likes
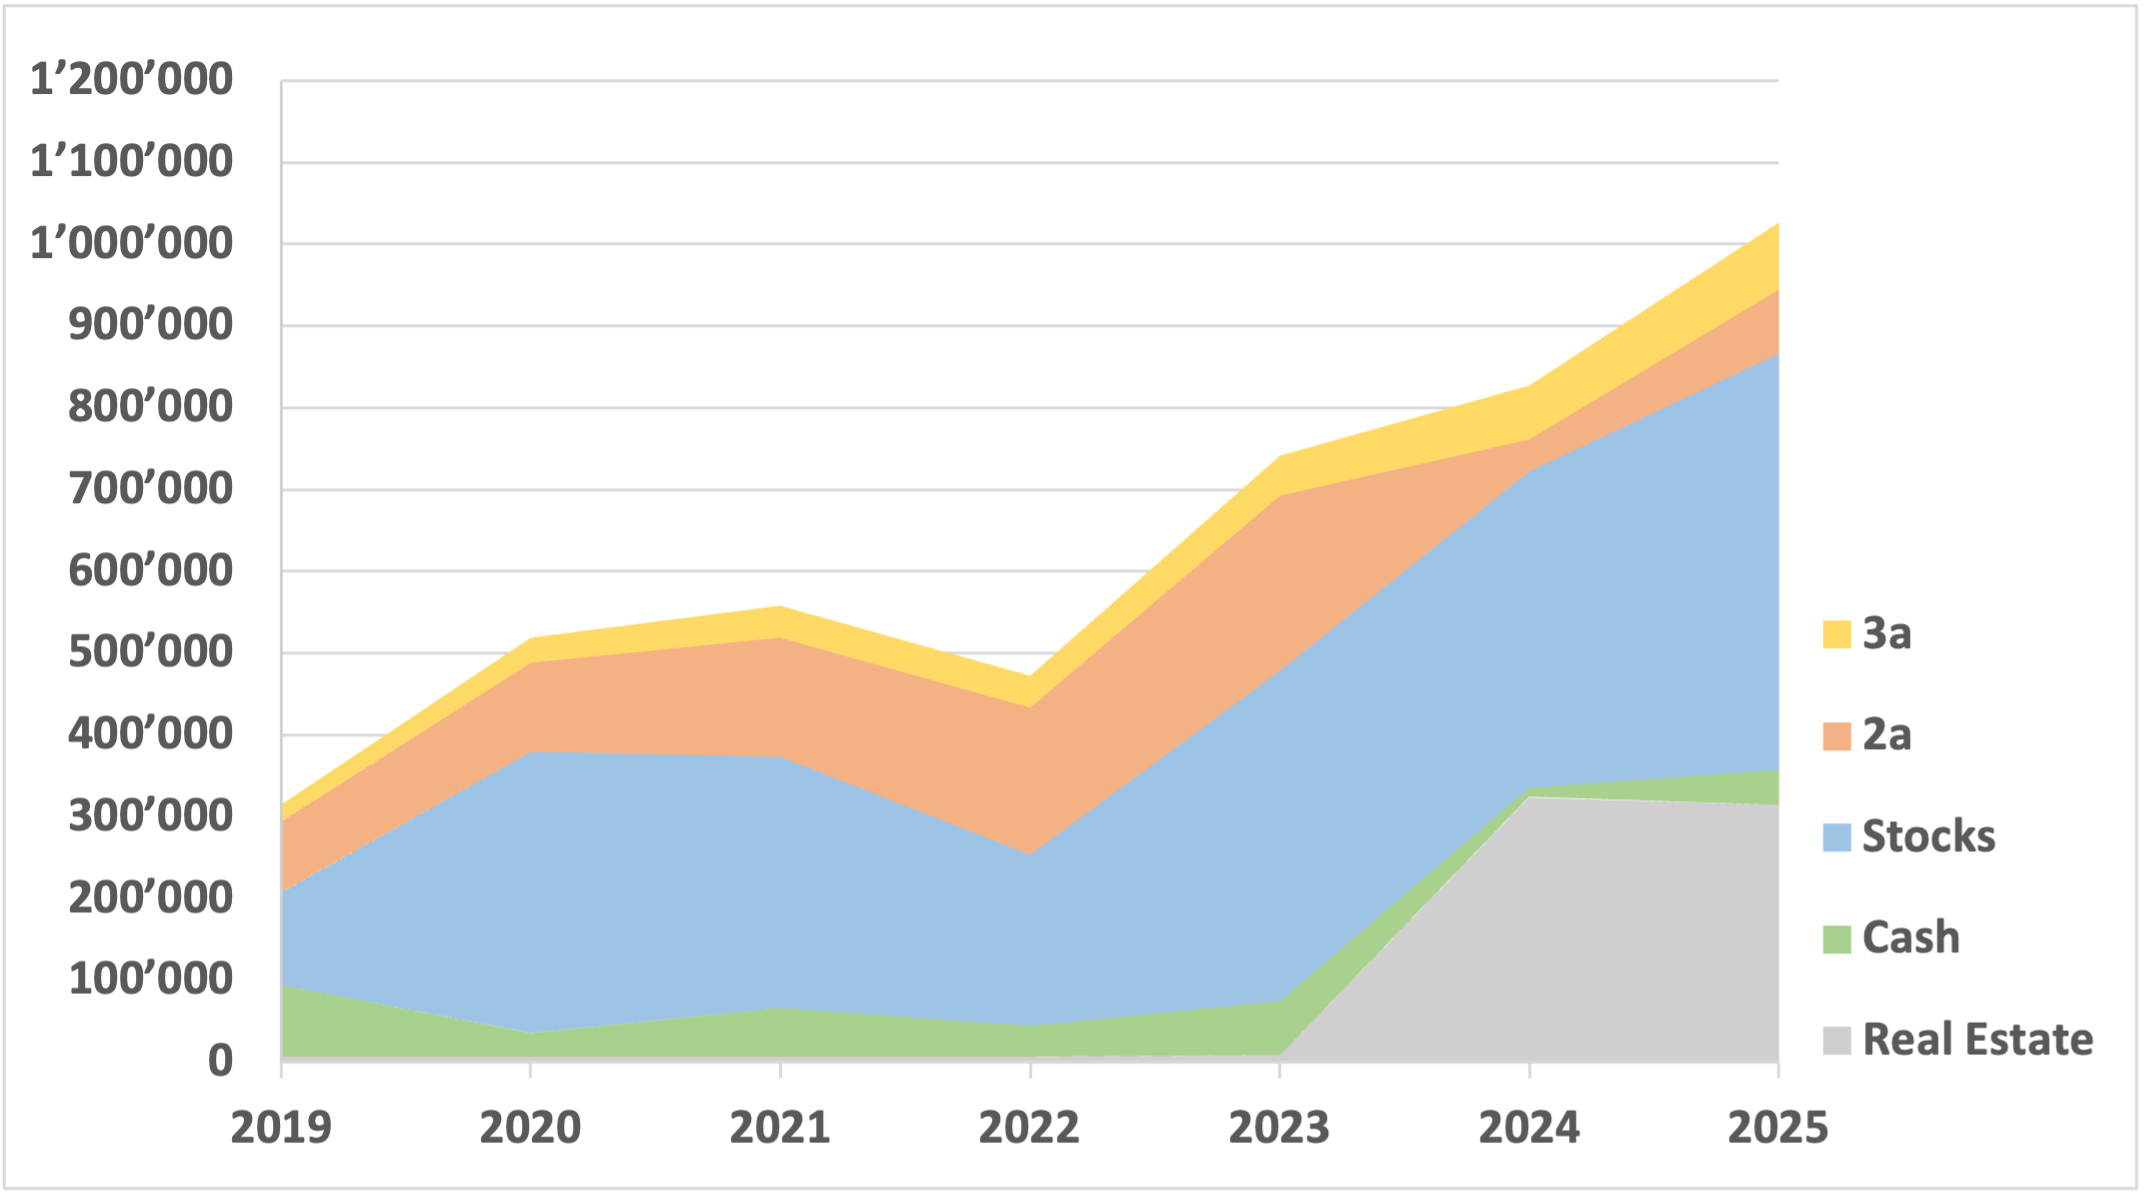
2025 has been a good year with CHF +117k accumulated (33 y/o - 2 adults, 2 children)
Nothing special happened this year with regard to my financial situation except that I now have access to a 1e plan, which will allow efficient buy-backs in the future.
Strategy is to max out the buy backs in the next 3 years (2026-2028). This will result in almost no contribution to my brokerage account, which is a bit unusual for me ![]() It doesn’t feel good but when I do the math, this is a more efficient way to allocate my wealth for the future.
It doesn’t feel good but when I do the math, this is a more efficient way to allocate my wealth for the future.
14 Likes
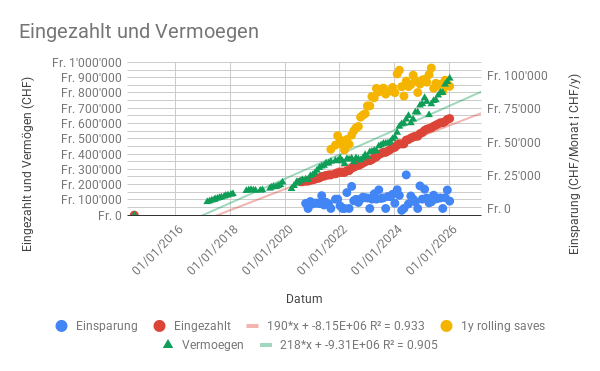
I am too late for this party. I thought I am the only odd man out who makes such graph and I love to see these ![]()
I am tracking it from 2017, but the y-axis is in INR. I will switch to CHF or USD and post it here in the next days
5 Likes
I’m very impressed by this, congratulations on your achievement! Still it leaves me puzzled a bit what job pays you 1 Million per year? Are you C-Level or a great sales person in Consulting? OK if you don’t wanna share but I’m really impressed. Wish you continued success on your FIRE journey!
Here’s my progression for 2025:
Happy new year and a successful 2026 everybody!
3 Likes
I guess software engineering in one of the big US tech company. Eg look at NVDA, if you joined in 2022/2023 your stock based compensation went 10x (and the stock can easily be half to a lot more of your comp).
On top of that the market for software engineer working on AI models is still very hot, and you’ve seen in the press the reports on how much meta/msft/etc are willing to pay (I guess the numbers in the press are the more extreme cases, but this means usually still a very good comp for those in the field)
(Zürich has a presence of most of the big AI labs)
1 Like
Very nice
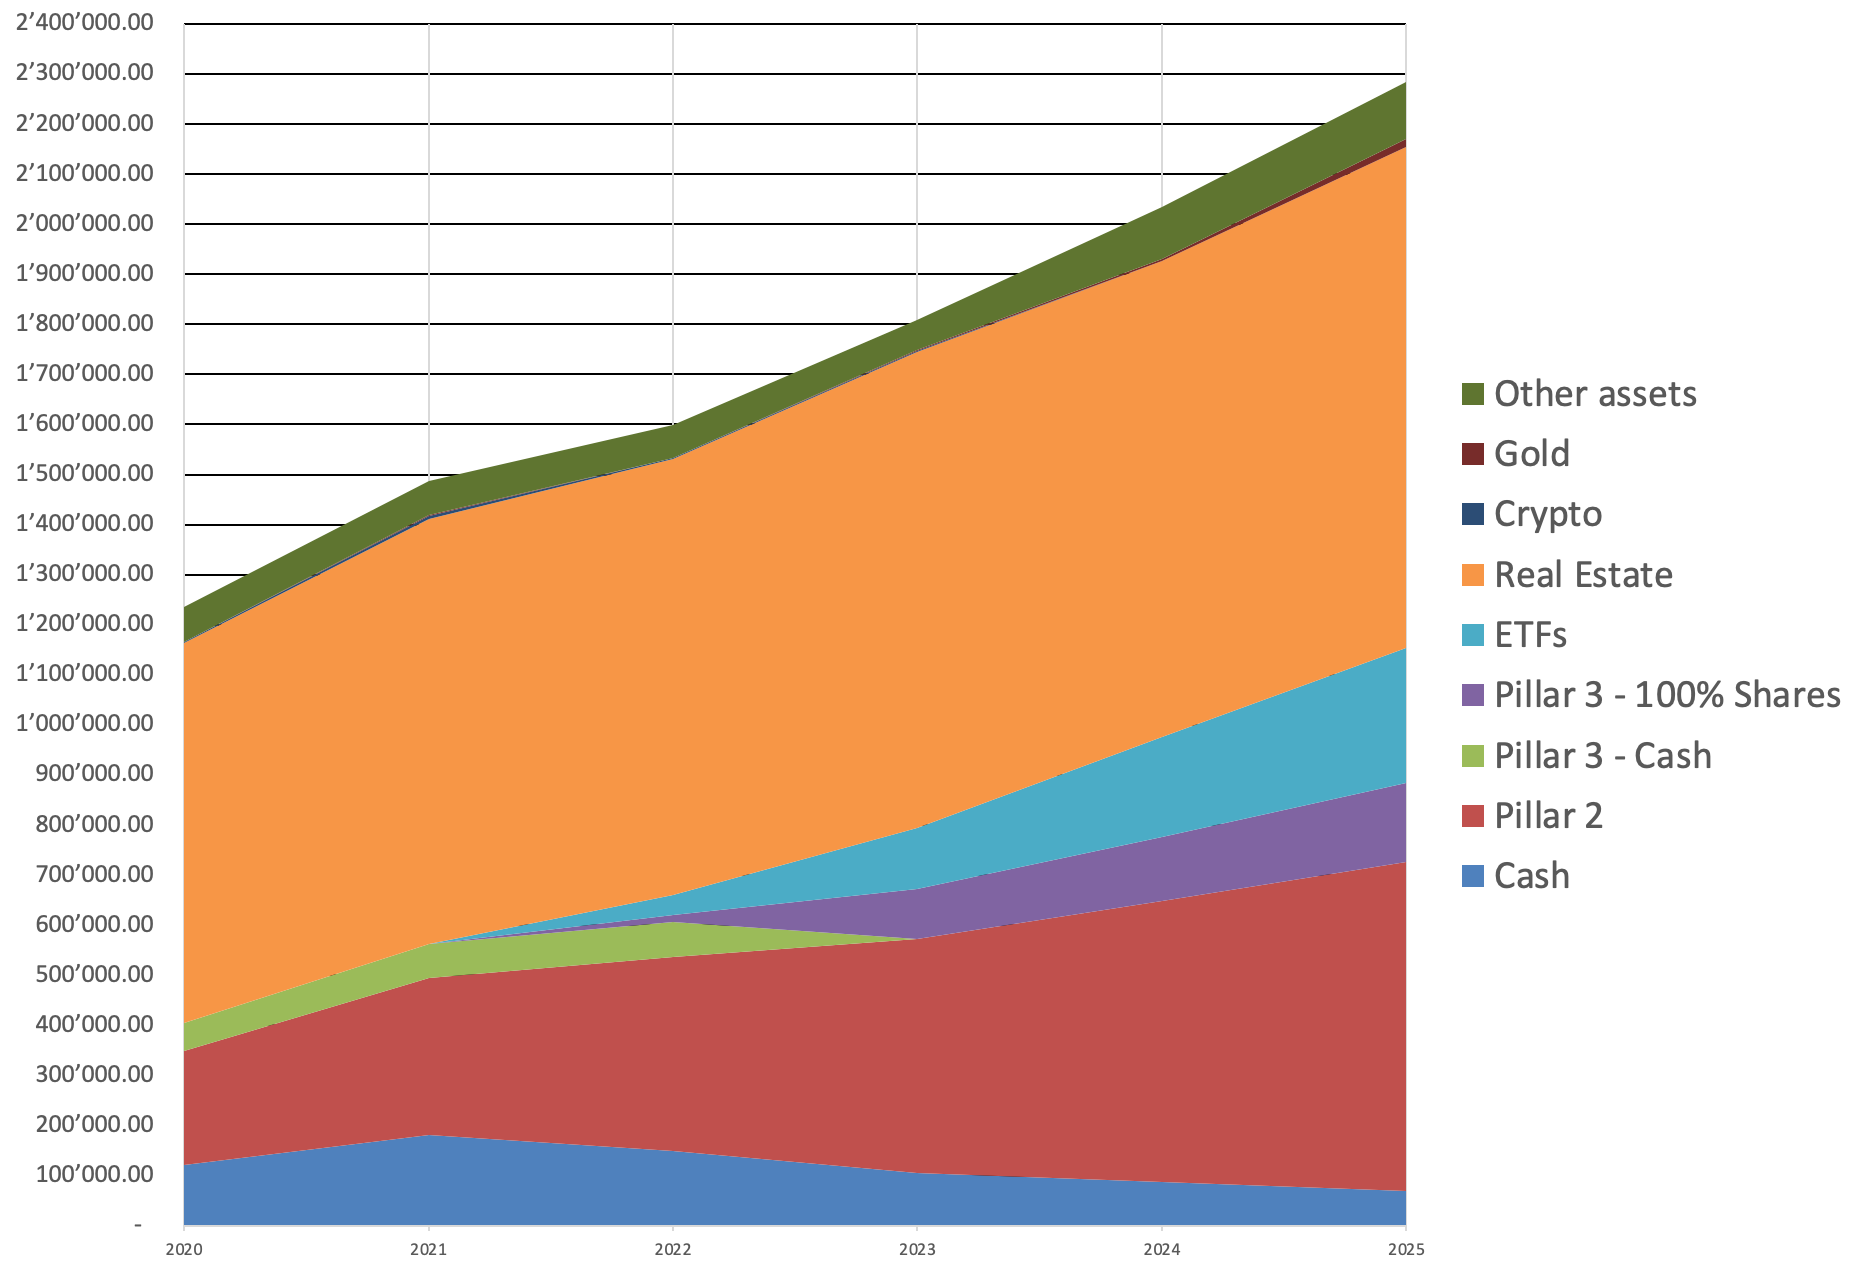
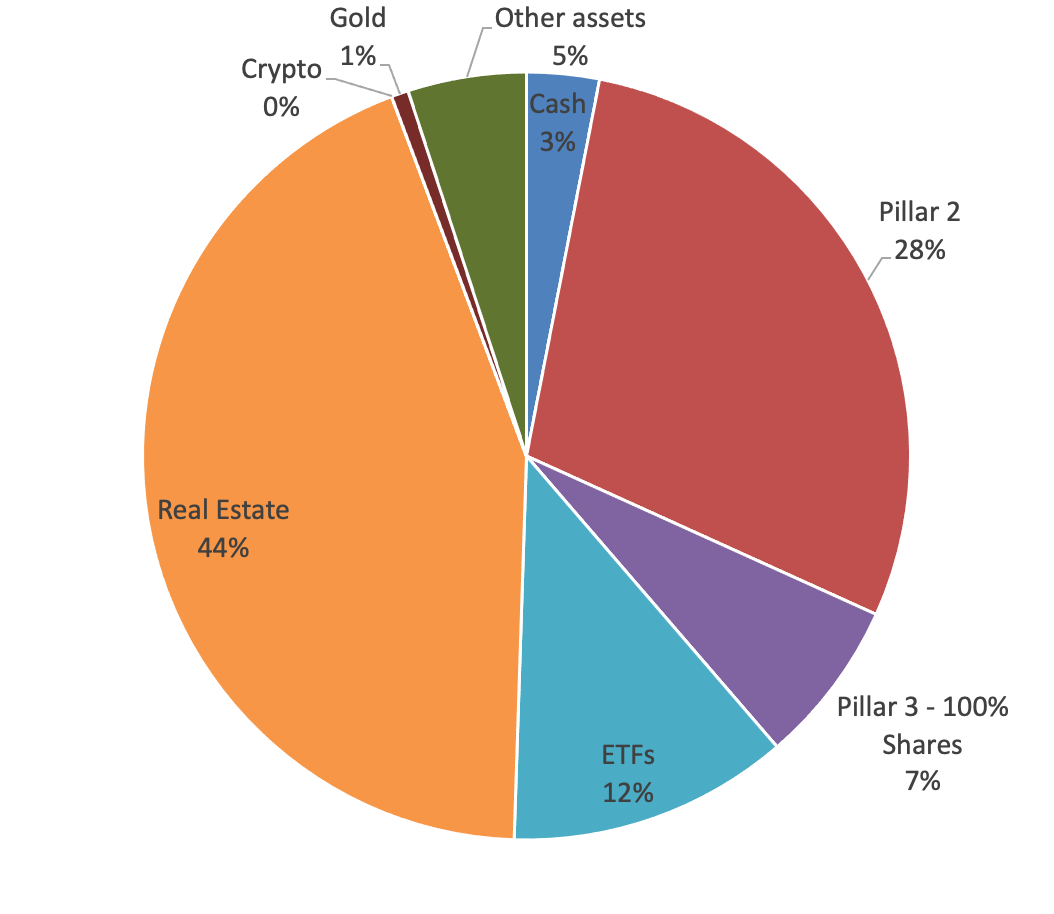
One thing for you to consider with the chart - can you make the Real Estate position sit at the bottom?
Given its share it’s tough to see if it rose much. Would be easier if it was at the very base
Saving rate went a bit down because my wife had to lift the foot on her job.
Should pass the 1 MCHF this year, a pre-Fire is expected with a half year sabbatical in 2027.
As usual in my case, 2nd pillar as well as a small company is not included here.
4 Likes
Very inspiring for me, because your graph resembles mine. You just started 3 years earlier and are thus 3 years ahead ![]()
2 Likes
You’ve done a x8 in 3 years?
I think independent line charts are best for this (as opposed to stacked).
You can do percentage gains from start to compare all on the same axis; and/or absolute values.
1 Like
Nope - ML engineer for large US tech. I joined at the right time, a lot of luck involved, from choosing the right field for my PhD, to joining the right company, to transferring to Zurich.
1 Like
2025 has been with approximately 24% growth in Net Worth quite good to me. After two times in 2024 (and gambling away a high portion) I became Millionaire for the third and hopefully the last time. The wealth of my wife is not included here, so our household numbers look even better.
2026 will be extremely interesting for me since I will change my job and work for a Startup. A lot of uncertainty but also a lot of potential, lets see what this year will bring.
Still 1828 days to go until FIRE: My Journey to FIRE in 2222 Days
8 Likes
what is your poison?![]()
Basically huge gains and loss by beeing over leveraged. Specifically lost majority with shorting some stocks.
That does sound very sweet, when you put it like that, hehe. But 2017 to 2025 has a CAGR of 43% which points at roughly 2x every second year.
Almost 2 years since my last NW update, here is the current status:
Equity (including Pillar 3) above 1M. Crossed it a few months ago.
Pillar 2 (including vested benefits) around 300K
5 Likes