Net Nets : a Value strategy

Hello Everybody!

Because some of you were quite curious about my investing strategy and asked me for more details, I decided to create a new topic on that subject. I know that it is not a very mustachian-low-fees-etf-investing spirit, but I hope you will find it as interesting as I do.

In the literature this strategy has several names : the most usual are “Net Nets”, or also “Net Current Asset Value”, and it has been created and popularized by Benjamin Graham, the finance professor of Warren Buffet at Columbia university.

The Net Net strategy is a “Value” Strategy, which means that we always try to find out a conservative valuation of a company, and to buy it at a great discount. Hence the famous saying “I try to buy a dollar for 50 cents…”

Disclaimer : In this topic, we will talk about financial reports and documents. Although I will try to explain the main steps, if you are not at ease with these reports I strongly advise to subscribe to this free lesson on Coursera :


It should lay the basics and it will be very useful in your investing journey.

So, as I said, we will try to find a VERY conservative estimation of a valuation of a company. But in order to be more understandable, let us look at an example. Let’s go on Yahoo Finance, and look up the information about the Emerson Radio Corporation (Symbol : MSN).
http://finance.yahoo.com/quote/MSN/financials?p=MSN


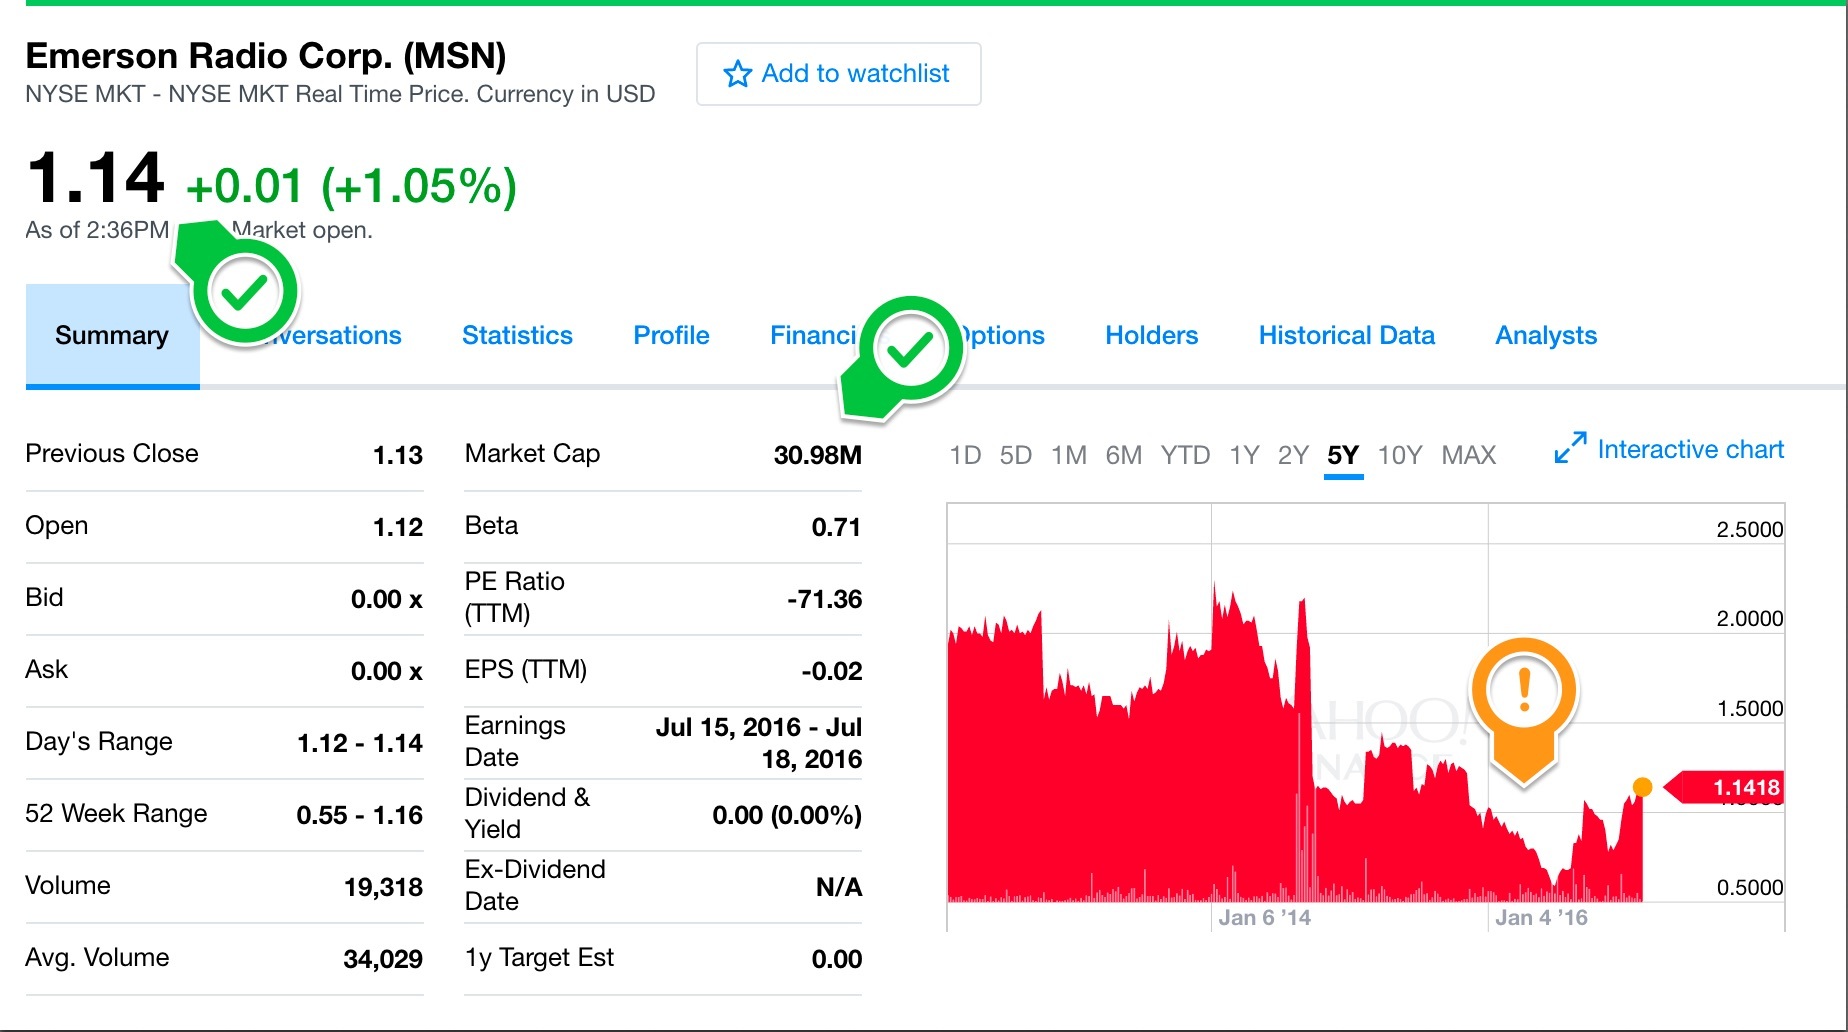
What can we see? The stock price evolution has not been very great in the last years, to say the least. The stock is currently quoting at 1,14 USD, and has a market capitalization of 30,98 million USD. So this gives us an approximate number of shares of (30.98/1,14) = 27,17 millions of shares. (Note : In reality it is more close to 27,13 millions).


This leads us to the first important notion : What is a share? For a value investor, a share is really a portion of the whole company, so if you own a share of MSN, you will be the owner of 1/27M of its assets, 1/27M of its debt and so on.
So we should really try to find out what are worth these assets and debts!

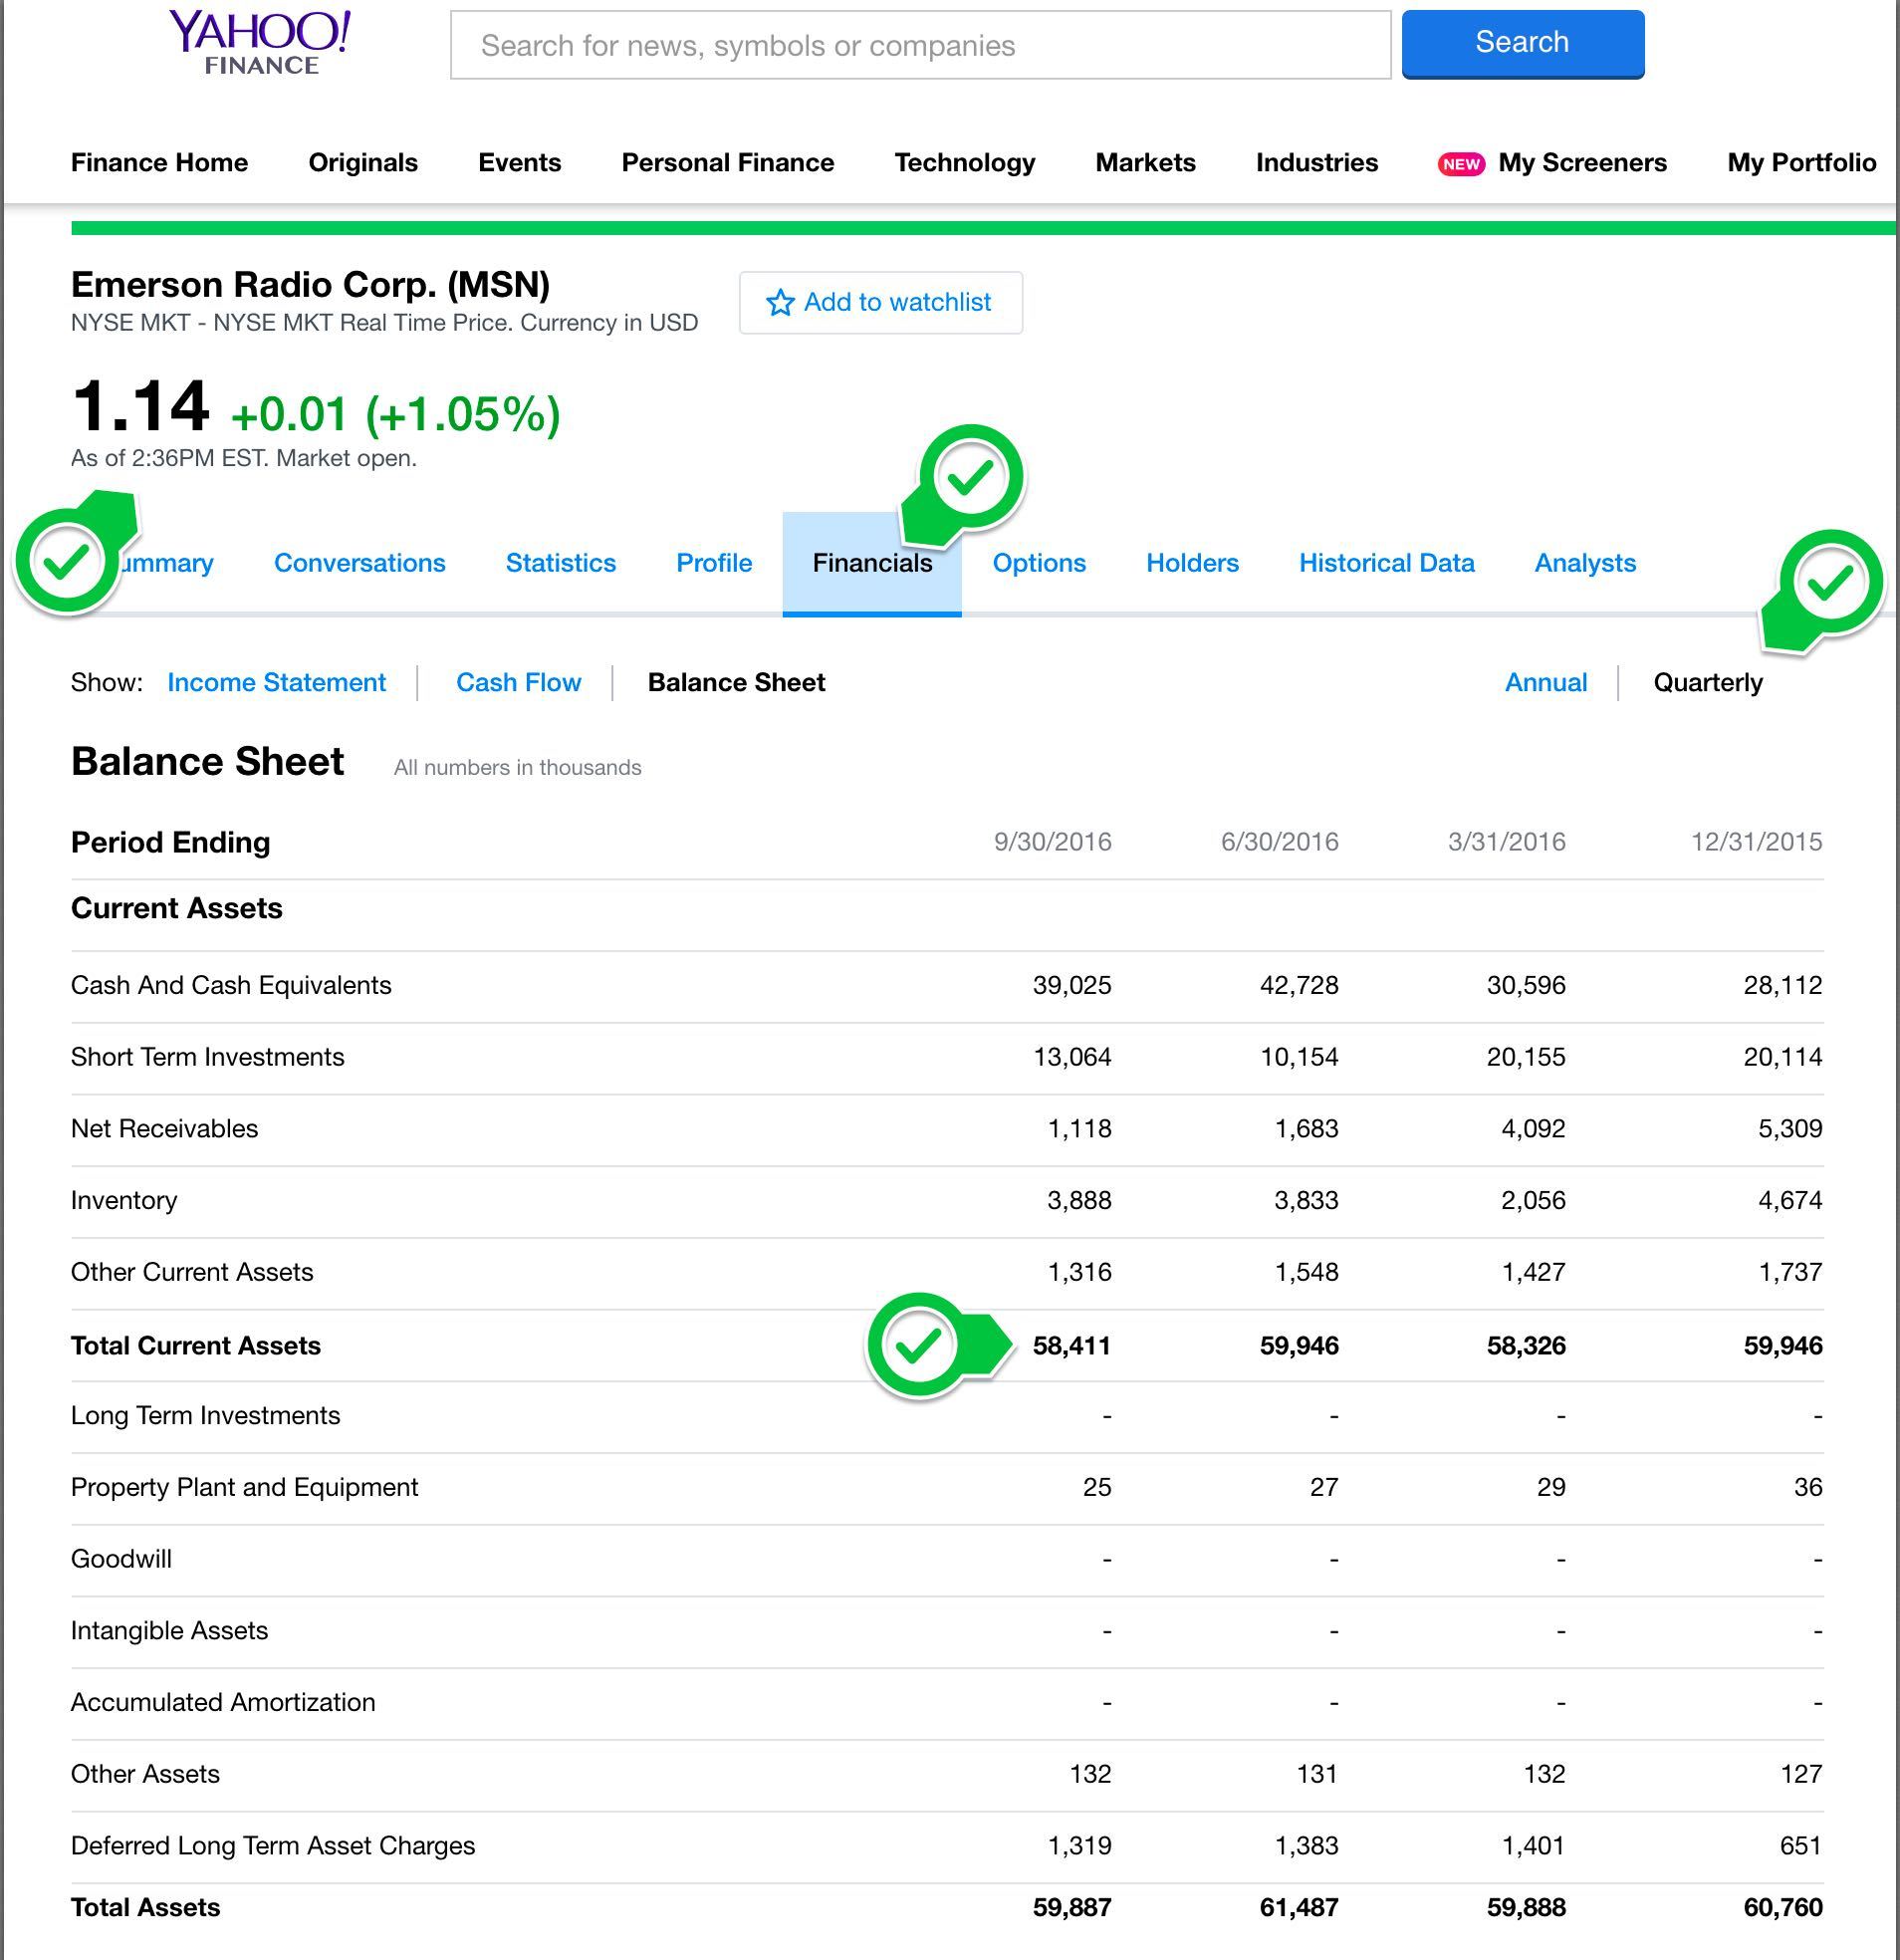
If you click on the “Financials” tab, then on “Balance Sheet”, and select the quarterly data (more up to date), you should see the following :


So at this point we should explain the most useful words :

  1. Current assets are assets that can be exchanged easily for cash within 1 year. That would include :
    -Cash(of course)
    -Clients debt (often called “Receivable”)
    -Short Term investments
    -Inventory

  2. Long term assets are those you would not expect to exchange easily for cash within one year, for instance :
    -Real estate and factories
    -Machinery
    -Patents

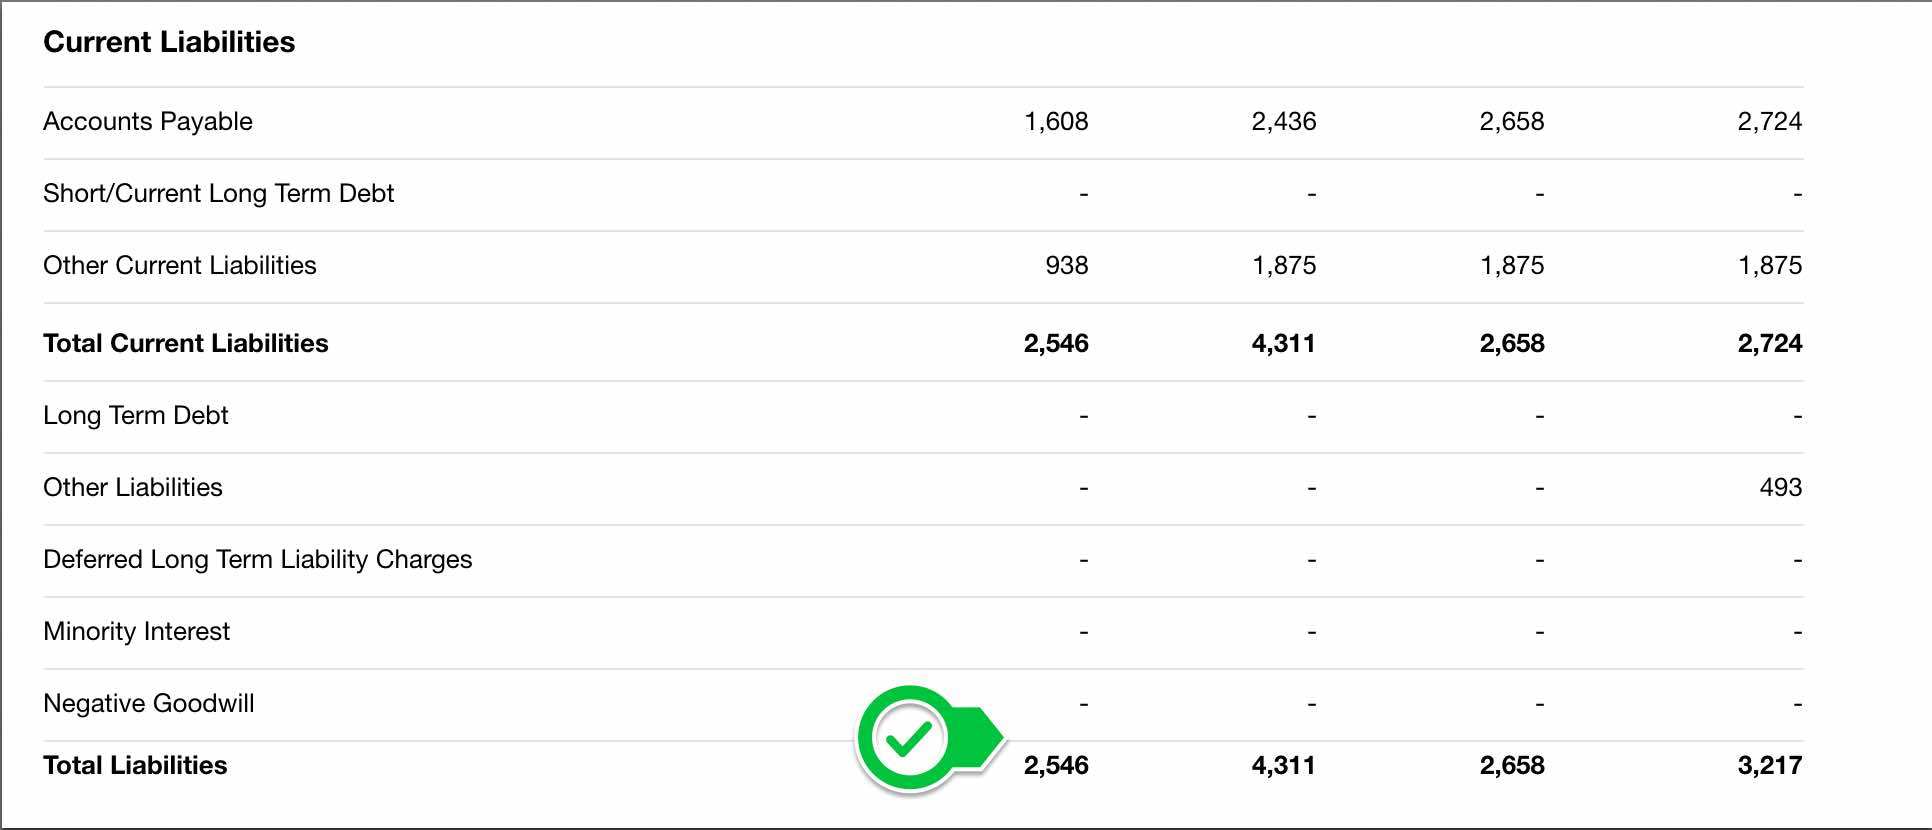
  3. Current Liabilities are liabilities that the company will have to pay within one year, for instance :
    -Short term debt
    -Employees wages
    -Provisions for taxes

  4. Long term Liabilities are liabilities that the company will have to pay on the long term :
    -Mostly long term debt

Now that the most important concepts are explained, let us go back to our strategy. What would be a very conservative estimation of MSN? Well, Benjamin Graham proposed the Net Net valuation, which is the following :

Imagine that the company goes bankrupt now. It ceases all activities. It pays the entirety of its debts. Its real estate and factories, and all of its long term assets are in such a bad condition that nobody wants to buy it.


Pretty pessimist, isn’t it?

So what would be the valuation of MSN in that case? As we said, the long term assets are worth 0, which gives us only the current assets, worth 58,411 millions USD. But we also have to pay the entirety of the debts of the company (total liabilities), so we should also subtract 2,546 millions USD. Which gives us a pretty pessimist value of 55,865 millions USD. This is what we call the “Net Net” value of the company, or the net current asset value (for “current asset value net of all debts”).


Now, remember that we have 27,13 millions shares on the market.
So in the case exposed above, the valuation of a share would be 55,865/27,17 = 2,06 USD per share.


But, wait! Haven’t we said that today the price of one share is 1,14 USD? That means that even if the very very bad situation described above was real, the shares of MSN are selling at near 50% of their value. That’s a huge discount!


It means that if the market realizes that it does not value MSN shares correctly, the stock will go up significantly! For the story, I bought this stock when it was selling at 0,67 USD.
But why is it currently so low? Well to be honest, this company is far to be a great company. In the near past it had repetitive losses, and investors got very pessimistic about it. So pessimistic that they sold in excess their shares, putting the valuation of the stock way below where it should be.


Now the next question is : how do I know it will recover, and when?
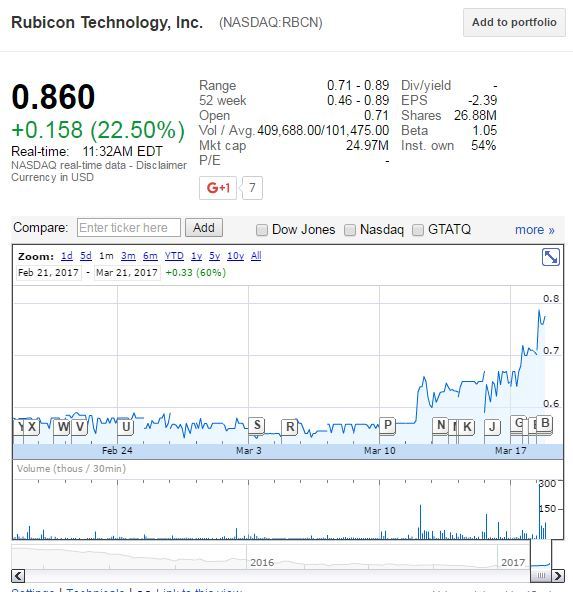
Well I don’t. I just have the intuition that if I bought 1 dollar worth asset for 50 cents, something good might happen. But i never know when. In my past experience, the recovery can happen quite quickly or very slowly. That’s why when I invest in such a stock, i have a 5 years horizon, and i diversify my portfolio. I try to have at least 15-20 Net Net stocks, and from time to time, one of them wakes up with a nice 50-100% while the others stay quiet. For instance, I bought GRVY at 4,32 USD in July 2016 and sold when it skyrocketed to 15 USD in November, but i also bought RBCN and so far the stock did not do anything, except going a little bit lower… That is why it is important to diversify among at least 15-20 stocks.

Historically, this strategy has been quite prolific. In his book Deep Value , Tobias Carlisle says that it returned 28% annually since the times of Benjamin Graham. This is surely very (too much) optimistic and I could not verify it, but so far I stand at +23% for 2016.
Another belgian value investing club, Les Daubasses, are using a similar strategy and claim average annual returns of 33% annually (with excellent years as well as years of underperformance).


So what is exactly the critera for buying a Net Net stock?
The most used one is :
Buy if stock price < 67% * (Current Assets - Total Liabilities).
If you want to be even more conservative, a criteria I like, especially when I don’t know many about the company(ex : Japanese market), is :
Buy if stock price < 67% * (Cash +0.9*Receivables +0.5 * Inventory - Total Liabilities). It assumes that the company won’t be able to sell half of its inventory and will not recover all the money its client are owing to the company.


Is this criteria Sufficient?
No! Even if you find companies meeting these criterias, there are companies i filter out directly :
-Companies from continental China : unfortunately, many investors suffered great losses with them because they use to cheat with their reports in the past. Note I said “continental” China, so i keep companies from Taiwan, Hong Kong and Macau.
-Companies that don’t sell anything so far : this is usually the case of a lot of bio-pharma companies. If they don’t sell anything, you can imagine the rate at which they will burn their current assets!
-Companies who had issues recently with integrity of their financial reporting. If a company announces that it will reexamine its results for past years, avoid it like the plague. You need trust in the reports for this strategy.


Last question : it seems to be a very manual process. What if you don’t want to lose a lot of time while looking through all these reports?

Well, at least for the US markets i have good news : if you know a little bit how to code a simple program, there are existing tools that should make your task easier :
-First, you can find the list of all the stocks listed on the US markets (NYSE, NASDAQ, AMEX)in excel sheets here :
http://www.nasdaq.com/screening/company-list.aspx
-Then, Yahoo Finance has an API which will give you, for each stock, at least its price, market cap and number of shares. Here is how you could use it :
http://www.jarloo.com/yahoo_finance/
-Finally, and this is the most beautiful, the SEC (Security Exchange Commission, the police of US markets), also has an API where you can query all the financial reports in a XML or JSON format. This is very powerful! Here is the documentation :
http://developer.edgar-online.com/docs

So with these three resources, you should be able to develop a tool that scans every stock and apply the net net criteria to know if you should buy it, automatically and in less than five minutes.

For other markets, it is unfortunately not as easy. The best I can advice is to look for a stock screener that will preselect stocks with a criteria close enough to our strategy, which will allow us to refine manually the results afterwards. Personally I like this one, which has a one month free trial period and has already the net net criteria :

https://www.screener.co/

Well, that is all for today, I hope you enjoyed this post!

And of course, obvious legal disclaimer : What i exposed is just my strategy and I am not advising you to do the same. I explain what I do and why I do it, and not why you should do it. I shall not be responsible nor liable for any money you would lose after reading this post.

12 Likes

Interesting strategy, especially from a tax perspective. I’ve been wanting to read Graham’s intelligent investor for some time now. I guess I’ll start this week end :slight_smile:
Thanks for the detailed post!

Thank you for sharing! Personally I knew this strategy, it comes across if you read Graham/Buffett.
you claim a 23% in 2016: is this in unrealized capital gain of all your positions? Or is it cash in cash out? It is net of transaction fee + eventual taxes from dividends, if you received any? Did you use the XIRR excel function? Just curios :smiley: I find that calculating the real return is not so easy.

What are your thought on automation? as more and more people have programming skill and maybe financial interest, the number of opportunity even in small cap should go down quite substantially, as the small cap market becomes more efficient.

Thank you for sharing this.

If this strategy is successful, then why aren’t all the professional investors using it and thus rendering it ineffective ?

@Dago : If you look at the examples i gave (MSN, RBCN), you will realize that most net net stocks are (very) small caps : less than 100 millions USD, most of them less than 50 millions. Now imagine that you are an institutional investor or a professional asset manager with more than 100 millions USD to invest. These stocks are not worth investing in because :
-If you invest let’s say 5% of your portfolio in it (so at least 5 millions), the price move caused by your buying will be so big that you are very likely to actually buy close to the net asset value.
-If you invest much less, then this line in your portfolio is so small that it won’t contribute significantly to your performance.

Furthermore, net net stocks share usually one feature : they look temporarily ugly. Often they have been losing money for a long time. So if a professional investor choose to invest in them, he will have to be accountable for it. Don’t forget that he is usually a simple employee of the investing firm. So the incentives are not in his favor :
-If he win unconventionally, he is a genius
-If he wins/fails conventionally, he is like everyone else
-If he fails unconventionally, he is fired
Even if this second reason is less significant than the first one, it does not help either.

@Grog :
The figures are taken from the report of my brokerage account. As I closed some of my positions during 2016, it is a mix of realized and unrealized. As far as I understand, for the unrealized part it takes into account the fees, stamp tax and fx spread I would have to pay now if I chose to liquidate now my portfolio. But you are right that calculating a portfolio performance is not easy. My past job was to develop position keeping softwares for the financial industry, so here is how I would do it if I had to do it manually :
1-Find out all the dates when something happened in you portfolio (you bought a stock, sold a stock, deposited cash, cashed out, received a dividend, and so on). For instance, you bought apple on Jan 10th, sold MSFT on Feb 13th, deposited cash on March 1st, and received a dividend on May 5th.
2- Slice the year in intervals according to these dates. So here you would have [Jan 1 -Jan 10], [Jan 10 -Feb 13], [Feb 13 - March 1], [March 1 - May 5], …
3- Simulate what would have happened if for each period you would have bought your portfolio on the start of period, and sold it at the end of the period. Here the trick is that the trades that really happened are done with actual fees, while the “simulated” ones are without fees. This should give you the performance for each period. So for instance, Jan 1-10 : 2%, Jan 10-Feb13 : -3%, Feb13-March1 : 4%, March1-May5 : 6%, … until December 31.
4-Multiply the returns for each period : (1+0.02)(1-0.03)(1+0.04)(1.06)
5-This should give you the total performance for the year.

Regarding automation, I cannot conclude yet. I started automating my research last summer. It is clear that since then there are less Net Net opportunities now than one year ago. However, I would attribute that more to increased overall market valuation than to investors with increased analytics power. I would need to see what happen on a complete cycle to be able to conclude.

1 Like

Hi Julianek
tks for your insights. I would suggest using a XIRR functions and simply considering your stocks broker as a black box where money goes in and money comes out. Look at this guide:
http://www.financialwisdomforum.org/gummy-stuff/xirr.htm

In this way, as he put it:
“What I mean is you should ignore any activity that takes place inside your portfolio.
But activity which involves money in to or out of your portfolio must be incorporated into the XIRR calculation.”

Thank you for sharing this with us Julianek!

May I ask if you know valuable blogs or books on the topic that you would recommend? I didn’t know about this strategy and it seems quite interesting, I need to investigate further this topic.

Thank you in advance!

StudyingInProgress

@Grog : thanks for the link! That should largely facilitate my calculations for the future! I will try to use XIRR now.

@StudyingInProgress : I first met the concept of Net Nets with the belgian blog (french speaking) Les Daubasses. I then tried to implement the automation. (disclaimer : I have nothing to do with the daubasses’ website. I know that part of their content is subscription-only, but i am linking to their site because I think that their free content is really worth it).
From then I read Benjamin Graham’s Intelligent Investor and Security Analysis. Surprisingly, although these two books are respectively more than 500 and 800 pages, he talks perhaps in 15 pages grand total about the Net Nets in the books.

I don’t know much about the english speaking Net Net web sphere. I know that oldschoolvalue.com talks about them but i never sticked with the editorial style. I know also that there are some dedicated Net net stock screeners, but they don’t filter the data. So it is a good starting point but you still have some work to do : as I said in my first post, you should then filter out companies from continental China (a big proportion of the results), companies having too few sales (usually a lot of bio-pharma companies) and so on…

1 Like

Since last month, Rubicon Technology (RBCN), one of my two examples, is up 60%. Finally the market is recognizing its value :slight_smile:

MSN, my other example, is now quoting at 1.40 USD for a 22% increase since my article…

2 Likes

nice!
so net-net defines when you buy some company. which algorythmn tells you to sell?

I have seen several approaches :
-Some investors sell when the net current asset value has been reached
-Others (and I tend to agree with this one) prefer to sell when the stock reach its tangible net asset value (that would be net current asset value, plus other tangible assets, such as real estate, machineries, factories… (so don’t take goodwill, patents and so on into account)

Usually, i have also seen quite often a time limit rule, saying that if the stock does not reach the target value within 2 or 3 years, then one should sell because afterwards the opportunity cost becomes too high (I would say it depends obviously of the upside potential of the stock : if company A has a 75% discount on NCAV and company B has a 25% discount on NCAV, then obviously company A has a at least a 300% upside potential while company B only 33%. Over 3 years, that makes an average annual return of 58% for company A and 9% for company B. If this potential is not met after 3 years, the example show that we can still wait for company A to reach the potential (that will make an annual return of less than 58% but that is still very high) whereas we should sell company B, because waiting longer reduces a lot the annual return and the opportunity cost becomes too high.

The last case would also be to sell if the balance sheet of the company deteriorate too much, and you no longer have a margin of safety big enough.

1 Like

by chance i ran across this list of recent stock-price losers. maybe some net-net candidates here?


:smiley:

Interesting exercice!
I looked up the financial reports of the Top20 of the list, but so far I did not find a Net Net. I will keep you updated for the reminding stocks of the list :slight_smile:

does NCAV<0 mean, that in case of the company closes, you’d have to pay the remaining debts?^^

The Net Current Asset Value is defined as : Total Current Assets - Total Liabilities.
Long term assets (factory, machinery, goodwill…) are not taken into account.
So a negative NCAV just means that the company has much more debt than cash, inventory and account receivables.

In any case, the basis accounting equation is :
Total Assets = Total Liabilities + Equity. The worst case for a shareholder is that his stock is worth 0. It is not possible to have to pay the debt :slight_smile:

1 Like

A new Net Net example unraveled :blush:

I bought Infosonics Corp (ticker : IFON) when it was trading at 42 cents per share, i.e 35% under its Net Current Asset Value.

Today the stock finally woke up, and I could sell it at 0.75 cents per share , for a nice gain of 78% in two months…

1 Like

Wooo wooo woo!!
Congrats on that move!! 78% in 2 months!!
What was the catalyst that made the stock move in that way?

Any other Net NEts on your portfolio waiting to explode?

The catalyst might be this announcement :

https://www.streetinsider.com/Corporate+News/InfoSonics+(IFON)+to+Acquire+Cooltech/13130627.html

Sometimes just a little bit of coverage makes analysts realize the stock is underpriced. But at a 10 millions market capitalization, I don’t expect analysts to cover this kind of stock anyway :smiley:

Regarding my other net net stocks, I have already talked about them in the mustachian portfolio thread, but it can be a good opportunity to make a 1 year assessment (as an exercice, I ll let you calculate the Net current asset value of these stocks) :

-Rubicon Technology (RBCN): bought in july 2016 at 6.7USD, reinforced at 5.2 USD (for an average entry price of 5.8 USD) : currently quoting at 8.12 USD : +39%
-Emerson Radio (MSN) : bought in july 2016 at 0.655 USD, currently at 1.28 USD : +95%
-Gigamedia Ltd (GIGM) : bought last year as well at 2.5 USD, currently at 3.03 USD : +21%
-Richardson Electronics (RELL) : bought in July 2016 at 5.25 USD, quoting now at 5.94 USD : +13%
-Velcan SA (ALVEL): bought at 10.64 EUR, now at 11.28 EUR : +6%
-Gravity Corps (GRVY) : bought in august 2016 at 4,32 USD, sold in November 2016 at 11,6 USD : +160%
-Zwalen und Mayr SA (ZWM) : bought three months ago at 178 CHF, now quoting at 230 CHF : +29%
-Sear Hometown and Outlet Stores (SHOS) : bought at 2.50 USD, currently at 2.25 USD : -10%
-Sanshin Electronics (TYO:8150) : bought in September 2016 at 906 JPY, currently at 1428 JPY : +57 %
-Nippon Antenna (TYO:6930) bought in September 2016 at 537 JPY, now at 576 JPY : +7%
-Nichiwa Sangyo (TYO:2055) : bought in September 2016 at 196 JPY, now at 241 JPY : +22%
(Note that in the meantime the Japanese Yen went down -10% against the Swiss Franc).
-Asia Pacific Wire and Cable (APWC) : bought in 2015 at 1.75 USD, now at 3 USD : +71%
-Deswell Industries (DSWL) : bought in 2015 at 1.8 USD, now at 2.8 USD : +44%

I consider that everything I haven’t sold yet has still some room for upside potential.

So all in all, in the last two years, Net Nets have provided me very satisfactory results :slight_smile:

But I’d like to see their performance over a longer timespan, so I can draw a conclusion. I don’t forget that we are in a bull market…

@Julianek, Seems like went down again, you did well by selling it! :smile:
I red about this strategy and yous post on this. I really liked it, but seems quite time consuming and I haven’t allocaed time for this.

We should have a thread to discusse and share some ideas on this. What do you think?

Yep, it seems like there has been a big correction today. To be honest my target selling price was 0.63 USD, so when I saw yesterday that it has gone way past this limit I sold immediately.

Regarding the subject, we have already this thread to talk about Net Nets and value investing. Feel free to share your ideas as well. they’ll be more than welcome!

And finally, as you can see most of the stocks i have bought are US (although I know there are a lot as well in Japan), and, once I automated my program to screen through USD stocks for net nets, it takes me only 20 minutes a week to run the program and see if something has changed since last week. So all in all, it is not that time consuming :smiley: