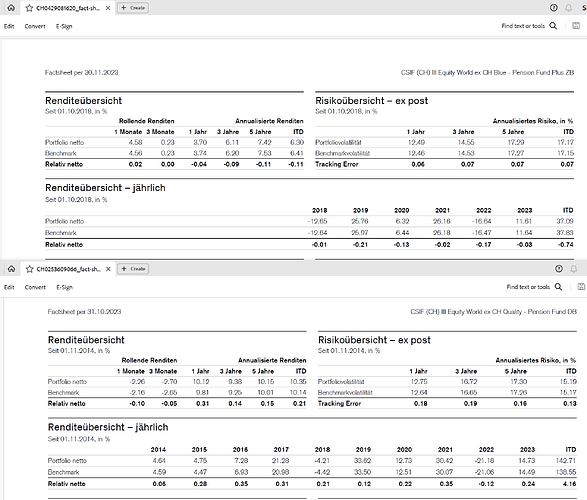
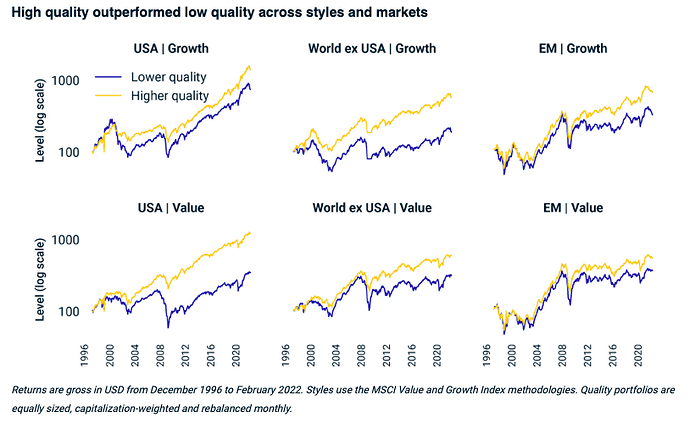
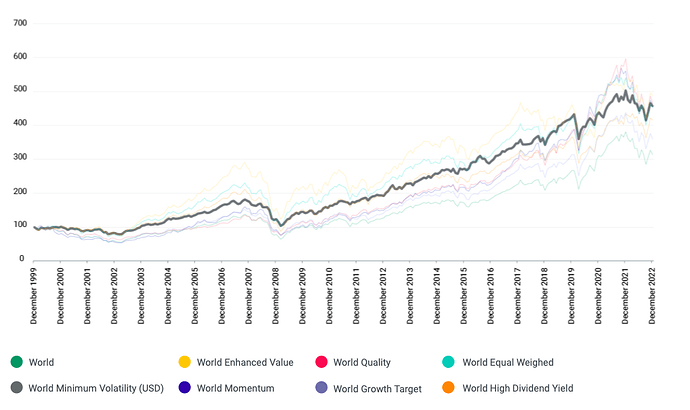
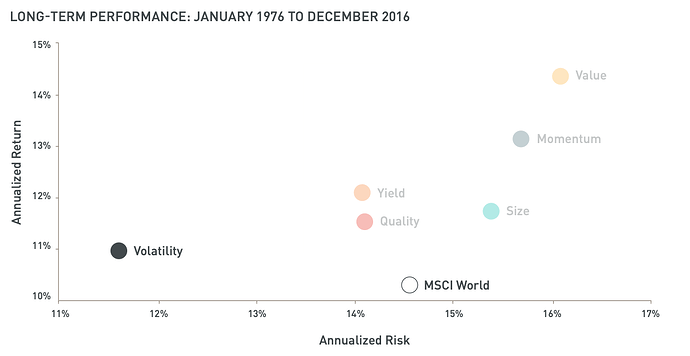
Thanks @Julianek for originally starting this discussion - an excellent insight into the world of the quality factor and its premium over the market. Like a few in here I’m effectively all-in on CSIF World Quality ex CH. (95%, plus 4% Switzerland Total and 1% obligatory cash holding).
In an attempt to add constructively to this discussion; I’ve also been wondering recently whether it’s possible to provide even better risk-adjusted returns than (A) the market and (B) single-factor portfolios over the long term with what Finpension 3a offers fund-wise.
Note: as far as I’m aware, Finpension does not offer multi-factor ETFs that blend selection (e.g. an ETF that will list companies that are only value and quality, or only value and small, etc).
Everything I postulate below is from a 3a pension strategy perspective and therefore revolves around a long-term approach (contributing for the next 25-30 years). Needless to say, previous performance does not predict future performance.
For simplicity, holding ‘the market’ (which itself is considered a ‘factor’, but let’s pretend it isn’t) is standard all-cap global equity at market cap weighting exposure. Adding factors instead of/on top of the market is essentially a bet that x factor will outperform the market.
If we take the common ‘factors’:
- The Market (outperforms treasury bills)
- Size (suggests small caps outperform large caps)
- Value (suggests undervalued stocks outperform overvalued / low price to book versus high price to book ratio)
- Profitability (suggests stocks with high operating profitability perform better versus low profitability) (an aspect of Quality)
- Investment (suggests stocks with high total asset growth have below average returns) (another aspect of Quality)
These first 5 form the Fama French 5 factor model, then another common 2 are:
- Momentum
- Low-Volatility
In his paper (https://www.pwlcapital.com/wp-content/uploads/2020/12/Five-Factor-Investing-with-ETFs.pdf) Ben Felix makes the points that:
- There is a trade off between simplicity (e.g. holding a global all-cap index fund that only offers market risk) and optimisation (the inclusion of additional factors via increased risk but with excess returns)
- Not all risks perform the same way over time
- Diversifying factors may be more beneficial than diversifying geographically
- The 5 factor model has been shown to cover around 95% of differences in returns between diversified portfolios
- Factors should not be considered in isolation (a portfolio that focuses on profitability without controlling for relative price is likely to result in a portfolio of growth stocks, whilst a portfolio that focuses on price without controlling for profitability is likely to result in a portfolio of stocks with weak profitability
- His paper also demonstrates:
US-only five factor returns annualised between 1963 and 2018:
Market (beats treasury bills) 5.09% pa
Small (beats large cap) 2.35% pa
High (beats low value) 3.48%
Robust (beats weak profitability) 2.84% pa
Conservative (beats aggressive investment) 3.19% pa
Global 5 factor returns annualised between 1990 and 2018:
(MKT) Market (beats treasury bills) 2.31% pa
(SmB) Small (beats large cap) 1.02% pa
(HmL) High (beats low value) 4.29%
(RmW) Robust (beats weak profitability) 4.06% pa
(CmA) Conservative (beats aggressive investment) 2.03% pa
BF also points out that the factor premiums come and go over time, but over enough time they have tended to be positive.
US only, factor excess return 10 year rolling (& 20 year rolling):
MKT: 80% of the time (100% of the time)
SmB: 73% of the time (82% of the time)
HmL: 89% of the time (100% of the time)
RmW: 86% of the time (100% of the time)
ex-US market, factor excess return 10 year rolling:
MKT: 89% of the time
SmB: 77% of the time
HmL: 80% of the time
RmW: 100% of the time
- When one risk factor is negative, at least one other will be positive.
- One argument against holding the risk factors in your portfolio is that they might take a long time to pay off and value stocks are testament to that, they have underperformed growth stocks for just over 10 years.
- The market has also underperformed for 10 year periods in the past, at which point the size and value premiums were generally positive AND the market has been less reliable at delivering premiums than these 2 factors
Summary from BF:
- HmL (value) has been positive as often or more often than the Market return
- RmW (profitability) has been positive as often or more often than the Market return
- SmL (small caps) has been less reliable in north America (than the north American total market) but as reliable in developed and emerging (as their respective total markets). Note: growth stocks within small cap ETFs drag down performance, so unless a small cap value ETF is offered, expect poor risk adjusted returns - you may as well opt for the market.
Back on track… how does this apply to constructing a Finpension 3a account. The Finpension 3a account limits us to funds capturing:
-
The Market: CSIF & Swisscanto offer World Index ex CH, and separately CH
-
Value: CSIF World Value Weighted (ex CH)
-
Quality: CSIF World Quality (ex CH)
-
Small Cap: CSIF & Swisscanto offer World ex CH, and separately CH
-
Finpension does also offer a CSIF Minimum Volatility index - more on this shortly.
In light of BF’s paper, do we want to bother capturing Small Cap? Finpension does not offer a value-focused small cap fund, and knowing that any beta is eliminated by the existent of blend or growth companies within the small cap index, I personally won’t.
Now the matter of Value and Quality. Do we split investments across them, if so; equally or tilted? Do we opt for one over the other?
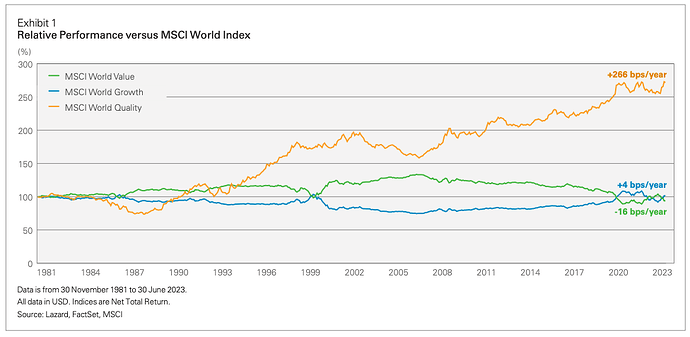
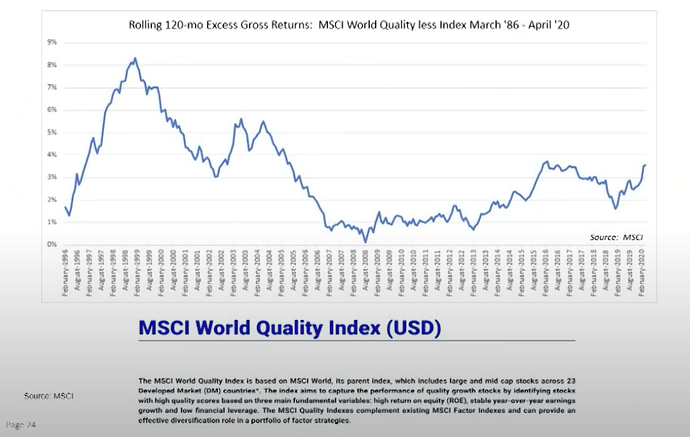
Lazard Wealth Management produced a document covering the power of Quality (https://www.lazardassetmanagement.com/docs/product/-s204-/115457/InternationalQualityGrowth-ThePowerOf.pdf). It demonstrates that the MSCI Quality Index has outperformed the MSCI Value Index and MSCI Growth Index against ‘The Market’ World Index between 1981 and 2023 enormously:
Quality: +266 bps (+26.6% per annum) versus the Market
Growth: +4 bps (+0.4% per annum) versus the Market
Value: -16 bps (-1.6% per annum) versus the Market
Notably Quality does underperform the Market, Value and Growth in most of the 1980s and from 2000-2008, the Quality premium is not found.
Virtus Investment Partners demonstrate this too (https://www.virtus.com/assets/files/6bt/quality_counts_investing_in_quality_over_the_long_term_4684.pdf), “a quality-focused portfolio tends to perform well over time—but not all the time”.
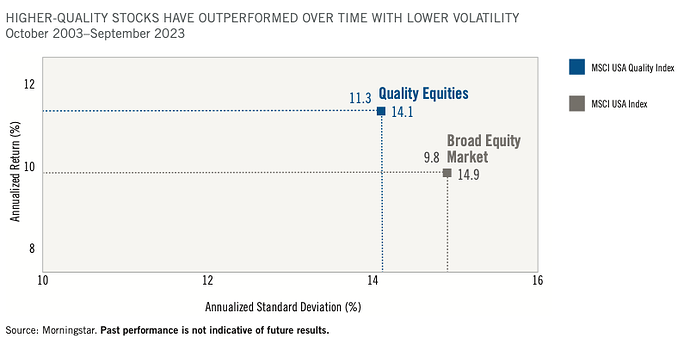
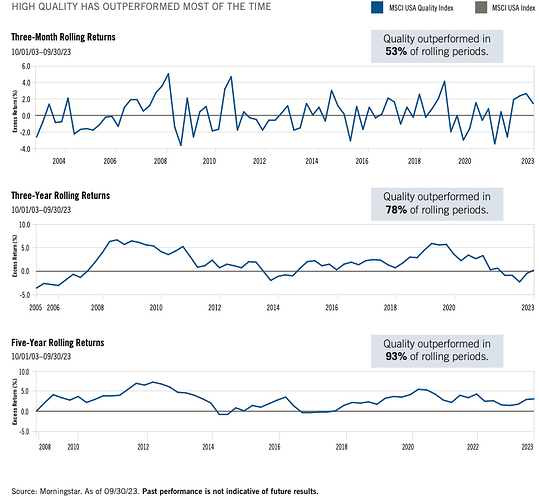
But the longer you stick with Quality, the more likely you will outperform the Market:
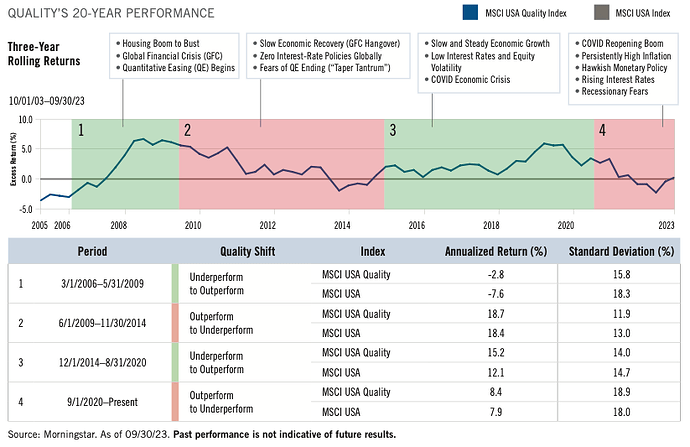
Notice below, that over this 20 year period, the (US) Quality Index had shallower drawdowns than the (US) Market in more than two thirds of the calendar years, and higher returns in the bull. It also outperformed in 3 out 4 periods. Overall, a smoother ride over longer periods, which bodes well for compounding.
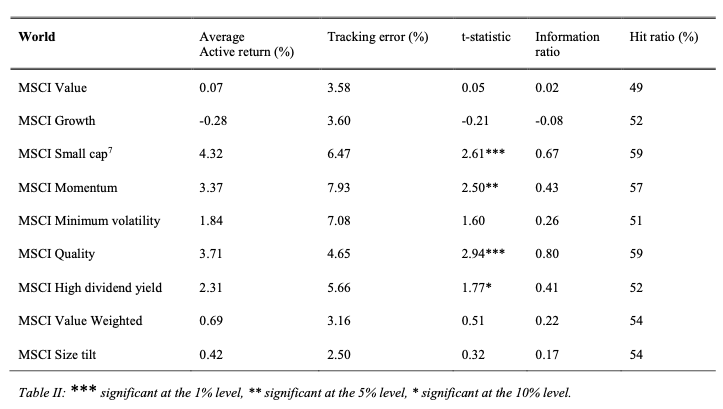
According to Deprez (2016), across a different 22 year timeframe (1994 - 2016) - note: small Cap data was only 2001-2016
(Weiterleitungshinweis):
- The MSCI Small Cap, MSCI Momentum and MSCI Quality show the biggest outperformance versus the Market (+4.32pa, +3.37pa, +3.71pa respectively)
- Quality Index realised consistent returns
- Growth Index showed a negative return (-0.28%) versus the Market
- Value-Weighted Index showed a statistically insignificant +0.69% return versus the Market
- Value Index showed a statistically insignificant +0.07% return versus the Market
- Minimum Volatility Index yielded +1.84% pa versus the Market
- Small Cap Index smaller sample years make it incomparable to the other factors
…not that I would include small cap without a value specific tilt anyway.
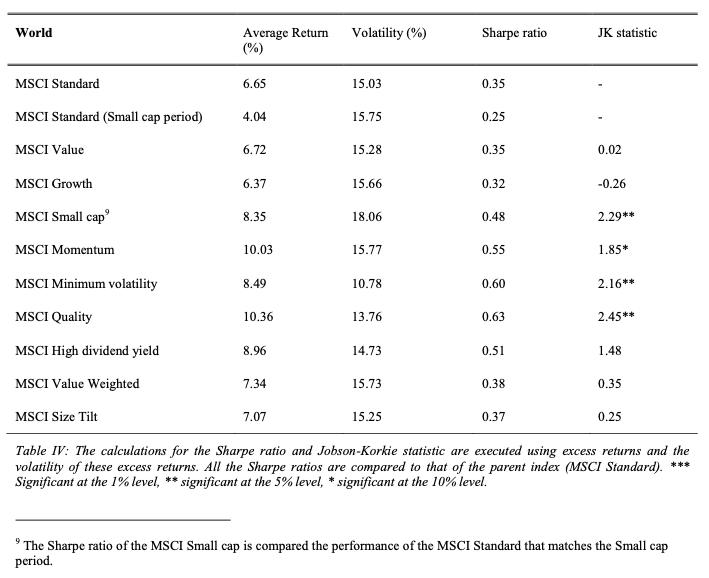
And for absolute performance over this period:
INDEX: AVG RETURN: VOLATILTY
- MSCI World: 6.65%: 16.03%
- MSCI Quality: 10.36%: 13.76%
- MSCI Value-Weighted: 7.34%: 15.73%
- MSCI Minimum Volatility: 8.49%: 10.78%
“MSCI Quality shows the biggest alpha”
I only referred to the Index’s available via Finpension because the rest are currently inaccessible and therefore can’t form a potentially split 3a portfolio.
The above paper also concludes that strategies combining two factors could provide “better diversified portfolios”.
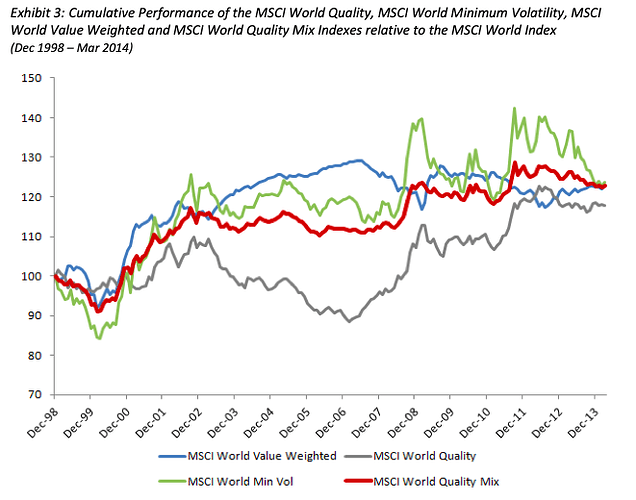
MSCI have combined Quality, Value-Weighted and Low Volatility Indexes into an equally weighted “MSCI World Quality Mix” Index (33/33/33) (https://www.msci.com/documents/10199/2ff8f4b8-d320-45c5-aef7-659657b56d2a). Here is the fact sheet: https://www.msci.com/documents/10199/8e394834-878d-4db5-ab1a-16eb40295b19
This is not available via Finpension but could it be constructed using a split? More importantly, would we want to?
It finds that the correlation between each of the 3 individual factor indexes is low (based on data from 1988-2014, 26 years).
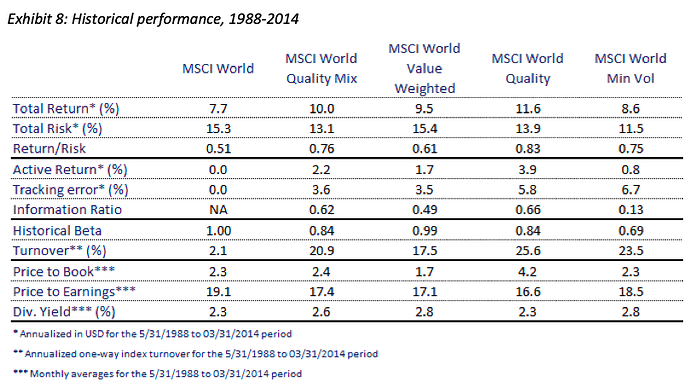
MSCI World Quality Mix provided higher active returns in periods of uncertainty and soft economic growth, performed ‘well’ in up markets (capturing >85% of market gains), but lagged in pronounced rallies.
Once again, between 1988-2014 MSCI World Quality Index produced the highest annualised returns (albeit with middle of the pack risk level):
But also note that in this 26 year period, the MSCI World Quality Mix does produce a higher Return/Risk ratio at 0.76 compared to 0.83 of the MSCI World Quality Index. Once again, MSCI World Quality gives the best returns for the risk taken - better again in these years than: the Market, Quality Mix, Value-Weighted and Minimum Volatility.
They conclude that “performance of an individual factor index can be cyclical: any factor can underperform for long periods. Therefore, a higher level of diversification may potentially be achieved in a multi-factor index by combining two or more of the factor indexes”. This we have heard before.
MSCI have produced data over a longer, 36 year period (1978-2014) “Multi Factor Indexes Made Simple” (https://www.msci.com/documents/10199/82035963-0458-4619-b3c6-9fca601e2869). I’d argue they don’t make it simple, as you’ll see below. But it does give good data for the single-factor indexes we can use (and maybe combine) via Finpension.
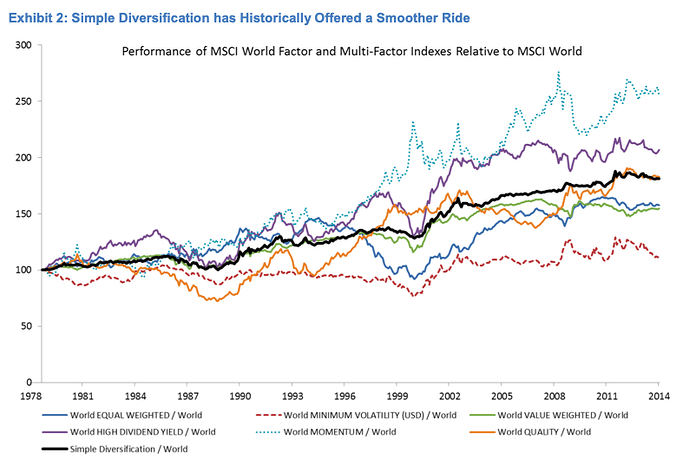
From the outset the show that “simple diversification” offers the smoothest ride over time. Their definition of this is an equally weighted combination of six factor indexes (equal weighted, value weighted, quality, momentum, min.vol and high dividend yield). Finpension doesn’t let us replicate this, so this is just for comparison against the Quality Index which we can use.
Notice that performances are all compared to MSCI World Index. Again showing the larger underperformance of MSCI Quality in the 1980’s, early 1990’s and mid 2000’s. However, it oscillates above/below but generally tracks the MSCI Simple Diversification strategy well. Also notice how Quality World (orange) and Value Weighted World (green) are completely inversely correlated.
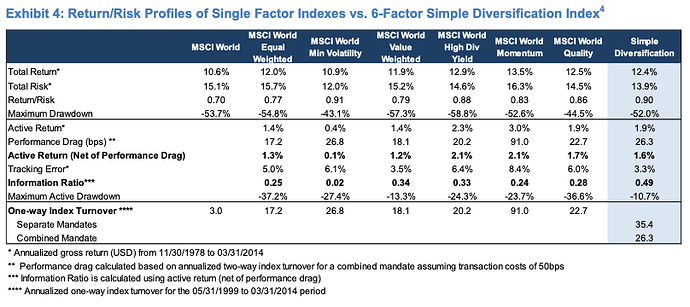
This is reflected below:
INDEX: TOTAL RETURN: RETURN/RISK
MSCI World: 10.6%: 0.70
MSCI Min. Volatility: 10.9%: 0.91
MSCI Value Weighted: 11.9%: 0.79
MSCI Simple Diversification: 12.4%: 0.90
MSCI Quality: 12.5%: 0.86
- MSCI Quality returns the most (only just beating Simple Diversification by 0.01%)
- MSCI Simple Diversification better risk adjusted returns than MSCI Quality (also, only just) by 0.04
- As it should MSCI Min.Vol. best risk adjusted returns due to low volatility, but only just performs better than the MSCI World Index
- All factors individually have better total returns and risk adjusted returns than the MSCI World Index
Cyclically speaking, the MSCI Quality Index is largely uncorrelated to both the MSCI Value-Weighted Index and MSCI Min.Vol Index (0.15 and 0.18 respectively).
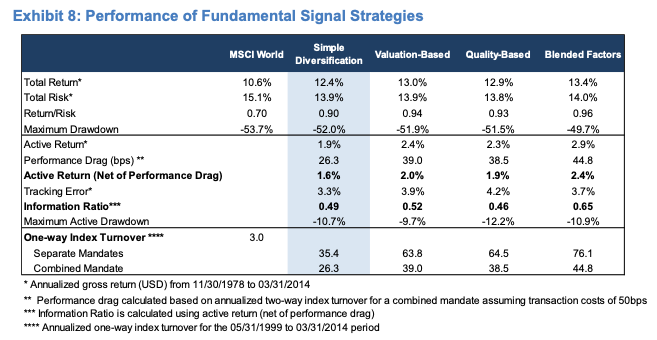
The paper suggests that “using valuation or a measure of quality to weight each factor index is a rational and sensible approach, we also recognize that each factor premium may be better captured by a different fundamental signal”.
It proposes 3 approaches.
- Valuation-based approach:
- Belief: Factor indexes might be overcrowded/expensive.
- Approach: Overweight cheap factor index & underweight expensive ones
- Quality-based approach:
- Belief: Factor indexes with high ROE will outperform lower ones
- Approach: Overweight high ROE indexes / underweight low ROE ones
- Blended-factor approach:
- Belief: Factor indexes perform well when each of their underlying signals are strong
- Approach: Weight each factor based on strength of underlying signal
→ I appreciate that as someone who wants to be able to set their Finpension funds (whether its 1 or 2 factor indexes and/or the Market), I am taking a slightly ‘active’ approach, but the 3 approaches suggested require far too much ongoing analysis of underlying signals and rebalancing for my preference. And likely so for the general ETF investor. Page 17 of the previous link gives more information on these approaches for anyone who is ambitious enough.
If you can be bothered (and not f*** it up - congrats if so), you will achieve returns (in excess of the MSCI Quality Index) of:
0.5% per annum for the valuation-based approach
0.4% per annum for the quality-based approach
0.9% per annum for the blended-factors approach
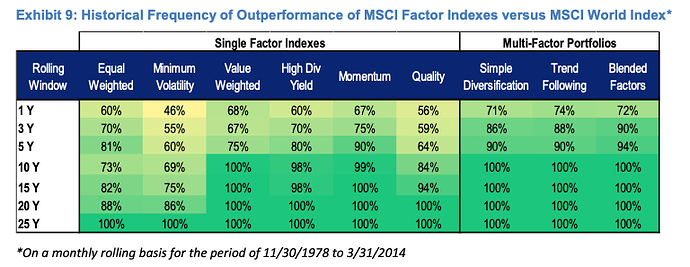
But this MSCI document does reinforce our findings from earlier, and supports them over a longer 36 year time from (1978-2014):
-
The longer you stick with a single-factor OR multi-factor approach, the more likely you will outperform the MSCI World Index (the Market)
-
Combining single-factor indexes into a multi-factor approach, you will increase the frequency of outperforming the Market
-
For an investor with a horizon over 10+ years (…and has the skills, time to reweighs and intelligence…), the probability of outperforming the Market is the same for any multi-factor approach (Simple Diversification, Trend Following i.e. factors with strong past performance will deliver strong future performance so combine factors but weight in order of past performance, and Blended Factors).
Reminder: Finpension users cannot recreate the Simple Diversification strategy because not all 6 types of required factors are available as funds.
Interestingly, the above table shows that in any rolling period, all single-factors (apart from Min.Vol.) will outperform the Market more often than not after just 1 year.
Of the single-factor indexes available on Finpension:
Value-Weighted will:
outperform the Market more frequently from year 1 than Quality or Min.Vol;
outperform the Market 68% of the time after year 1;
outperform the Market 67% of the time from year 3;
outperform the Market 75% of the time from year 5;
outperform the Market 100% of the time after 10 years
Quality will:
outperform the Market just over half the time after 1 year;
outperform the Market 59% of the time after 3 years;
outperform the Market 67% of the time after 5 years;
outperform the Market 84% of the time after 10 years;
outperform the Market 94% of the time after 15 years;
outperform the Market 100% of the time after you hold it for 20 years or more;
Minimum Volatility will:
outperform the Market less than half the time after 1 year;
outperform the Market 55% of the time after 3 years;
outperform the Market 60% of the time after 5 years;
outperform the Market 69% of the time after 10 years;
outperform the Market 75% of the time after 15 years;
outperform the Market 86% of the time after 20 years;
outperform the Market 100% of the time but only after you hold it for 25+ years
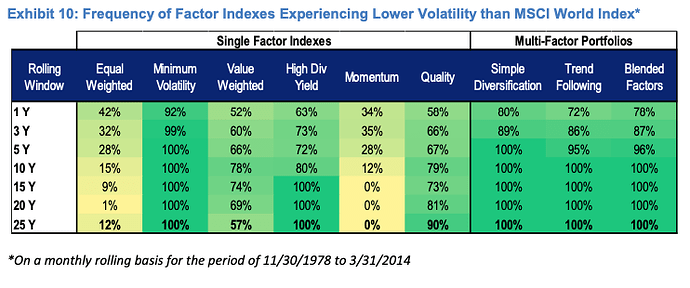
The document also demonstrates volatility for each of the single factor indexes and the multi-factor portfolios:
Based on this information, as a long-horizon investor, with the ability to choose from the Market, Quality, Value-Weighted and Min.Vol - I question whether I would want to include Min.Vol in my portfolio at all.
Yes it provides low correlation to both the Value-Weighted and Quality Indexes (so a diversification benefit from a returns in cycle perspective). Yes it dampens volatility in portfolios very quickly. But we are factor investors because we want statistically significant returns over the Market. A return of +0.3% per annum over the Market (1978-2014) is not statistically significant, especially when the TER of the CSIF Min.Vol. fund is 0.09%.
At this stage we - or I - have removed the size factor and the volatility factor from desirable options (the penultimate chart will throw a curveball for Minimum Volatility…). Leaving us - temporarily - with; the Market, Quality and Value(-Weighted). Tell me if I’m wrong (seriously - this is a massive thought-exercise I need to write down to make sense of).
As we consider if and/or how we use both Quality and Value approaches, Schroders have an excellent overview of Quality (https://mybrand.schroders.com/m/a902880d3740f0e9/original/Why-Quality-stocks-offer-higher-return.pdf) - I highly recommend reading this.
It states that “Quality companies generate market like performance when Value stocks are leading, but outperform three-quarters of the time when Growth stocks lead” and that “Quality performs well during more volatile market environments, particularly when compared to Value based approaches.” “Quality also provides lower beta and volatility than the Market” (data 2000-2014).
So if Quality performs like the Market when Value is leading and has lower beta and volatility; do we need to invest (a bit) in the Market? Maybe. This section is ‘only’ based on 14 years of data and nothing guarantees future returns.
It also suggests “the end result [of investing in Quality] is an attractive strategy in its own right but one that also provides significant strategic diversification from Value based approaches thereby providing the building blocks to outperform across a wide array of market environments”. Diversification from Value is key. It doesn’t answer our question, but alludes to the idea that utilising both factors (separately) could be beneficial. It goes on to say…
“The complementary role of Value and Quality does not appear to be spurious [i.e. yes, they likely do complement each other, for the less literate]. We observe that higher quality companies have very different characteristics to Value stocks which are often less profitable, more cyclical and exhibit weaker balance sheets. Philosophically, it is also possible to argue that high quality companies are complementary to Value in the sense investors fail to incorporate the persistence of the positive attributes of quality companies into the future, particularly their profitability, whereas the opposite is often true for stocks with weaker fundamentals (which creates the value opportunity). The complementary nature of Value and Quality enables investors to construct a more balanced equity portfolio which is more likely to perform across a broad range of market environments.”
Asness et al. (2015, pg. 40), also found that:
“Clearly, value does not work best alone. Far from it. Combining it with other economically intuitive and empirically strong factors, such as profitability and momentum, builds the best portfolio.’’
Novy-Marx (2013) found that gross profitability is predominantly a growth strategy which is uncorrelated with value, therefore providing an excellent hedge against value. It’s important to note that the 2014 research by Novy-Marx which combined Value and Profitability (Quality) wasn’t a 50/50 allocation split across one Value-Weighted index and one Quality index. It was the backtesting of profitable value stocks.
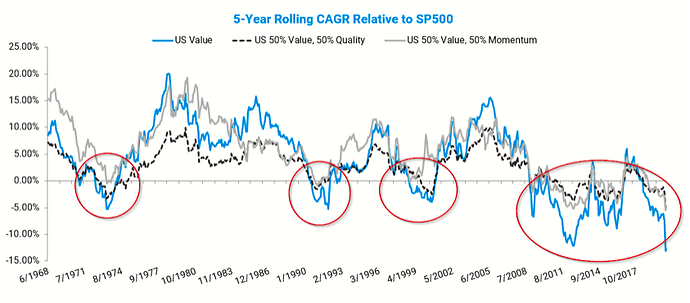
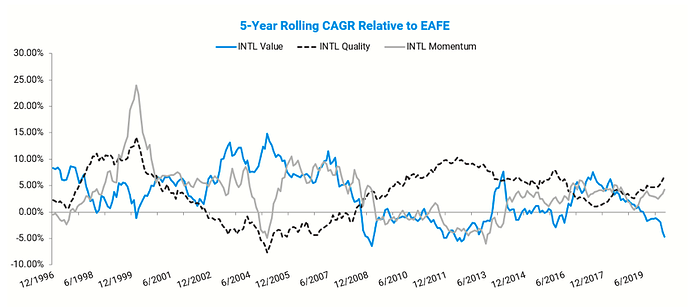
AlphaArchitect has looked at the concept of a 50/50 US Value and Quality split (https://alphaarchitect.com/2020/06/diversifying-your-value-portfolio-quality-works-but-have-you-heard-of-momentum/). FWIW, we cannot use a Momentum Index in Finpension, so no further discussion on that. This graph isn’t completely representative because ‘the Market’ we refer to isn’t just SP500 stocks AND our indexes are World, not just US. Interestingly, in the US, this graph shows a gradual decline in CAGR for Value, 50/50 Value & Quality and 50/50 Value & Momentum relative to the SP500 - which calls into question efficacy of the factor premia. But we know that Value has underperformed massively the past decade, whilst growth (particularly FAANG) have flown.
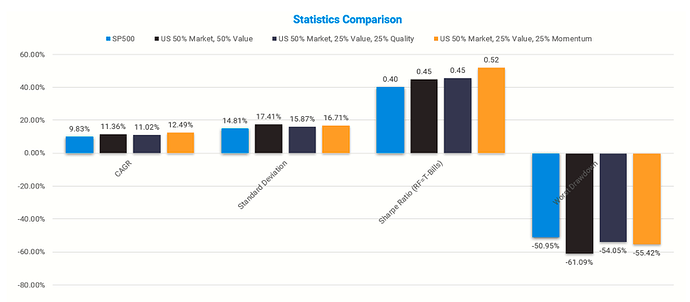
It also demonstrates how split portfolios of these funds would have performed over the period:
Data again isn’t completely representative (fund wise) of what we have available at Finpension, but it’s food for thought.
The international (ex-US) Quality returns are interesting. But note that currently in comparison the CSIF World Quality is 77% US.
On the topic of SP500, S&P Global (https://www.spglobal.com/spdji/en/documents/research/research-the-merits-and-methods-of-multi-factor-investing.pdf) produced this document. It echos previous wider World Index findings regarding the low annualised volatility and high annualised total returns of the Quality factor (within the SP500).
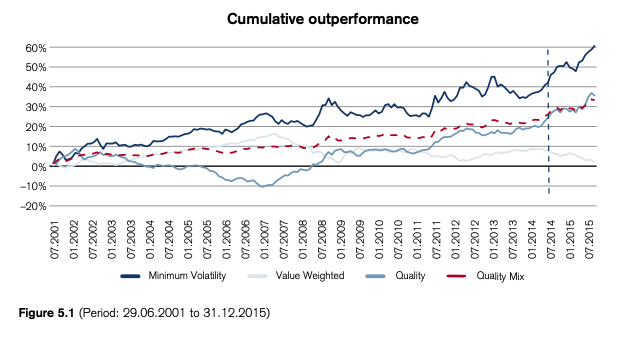
Credit Suisse have also released 14 year data on their Min. Vol, Quality and Value-Weighted index funds, as well as a Quality Mix index fund - which isn’t on Finpension but can be recreated - as an equal split of the 3 aforementioned funds:
At this point, information I’m posting is beginning to seem contradictory - given that the CS chart (albeit a smaller 14 year snapshot versus 36 years earlier from MSCI) shows a strong outperformance from Min.Vol., steady performance decline from Value-Weighted and Quality performing well outside of the mid 2000’s underperformance. The Quality Mix approach however, shows great outperformance. Similar to Quality but with far less overall volatility.
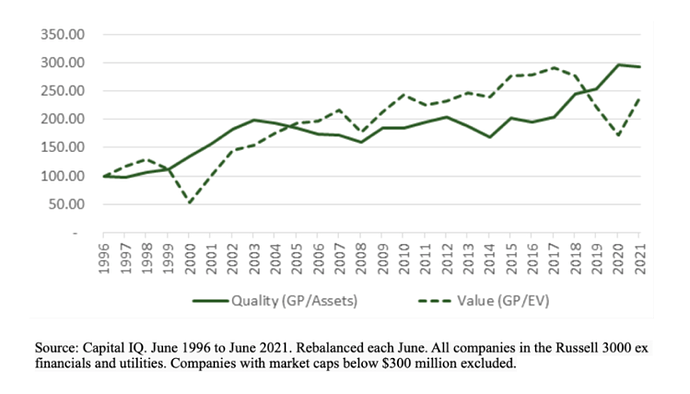
One final chart from Larry Swedroe/Robin Powell (https://www.evidenceinvestor.com/quality-the-flip-side-of-value/) via Obenshain (with data from 1996-2021) shows that Value and Quality pair well in terms of inverse correlation for market performance:
Swedroe/Powell concludes that “the evidence suggests that quality is an important characteristic for investors to consider, as well as cheapness (value). Thus, investors should consider including exposure to both in their portfolio design.”
I do not think it is wise to settle for just a 2 factor portfolio of Min.Vol and Value-weighted. Yes they are inversely(ish) correlated. But combined outperformance vs MSCI World Index since 2002 is lacklustre. Refer to chart at bottom right of this document: https://www.msci.com/documents/10199/cbdd6492-831c-479f-ba15-e9981a1c7644
Based off everything I have presented, as a Finpension 3a investor:
- which combination of factor funds would you opt for?
- would you retain exposure to the Market?
- finally; at which weightings if you decide to split?
Although I may have posed more questions than I answered, I hope this helps guide people in their choices - and also helps me. Looking forward to further discussion.
PS. Here are the fact sheets for:
MSCI World Quality
https://www.msci.com/documents/10199/344aa133-d8fa-4a15-b091-20a8fd024b65
MSCI World Value Weighted
https://www.msci.com/documents/10199/9133ebac-9308-4bb7-aeec-60c1dcd2c98a
MSCI Minimum Volatility
https://www.msci.com/documents/10199/4d26c754-8cb9-4fa8-84e6-a51930901367
MSCI Quality Mix
https://www.msci.com/documents/10199/8e394834-878d-4db5-ab1a-16eb40295b19
