[COFFEE] History and histories: historical data, charts, long-term trends in investment

But do they, really?

Maybe in absolute nominals the rest of the world (ROW) has benefitted significantly,* but in relative terms compared to the US, I cannot help myself but wonder …

Anyhow, I have no numbers (or charts) to back this, just my gut feeling.


* Well, there’s also somewhat capitalized countries in Europe that are probably seeing declines …

I think this paper might shed some light…
It shares Free float vs. Total market cap by regions. Specially look at Emerging markets

The Concept of Free-Float Market Capitalization

Free float vs. Total market cap

3 Likes

Stock market is only half the story. Compare Switzerland to its neighbors.

Take Germany, for example. Tiny stock market, given it’s still (?) the 4th largest economy, maybe 10x the population, 5-8x the GDP (nominal / real) of Switzerland. Historically financed more by credit, less by equity, and lots of SMEs and large family businesses. Similar to CH, actually, if you’d the exclude the large numbers of multinationals.

Globally, all developed countries will lose weight, simply because of population growth and economic development in the rest of the world. Take China, maybe India next?

It did read several articles on the out-sized US stock market, but can’t quite get the details together, anymore. It was a mix of the capital driven economy and culture, huge, unified home-market, the role of the dollar, and partly as a result more recently, the rise of tech companies.

1 Like

Ok, thanks @Abs_max, @Dr.PI, @Patirou and @Brndete – I feel a little less puzzled now. :slight_smile:

Still a little puzzled, though … small font size puzzled only, though :wink:

For global equity market cap, sifma does a good job:

1 Like

Whoa, nice data!

But also from that report: “The U.S. capital markets are the largest in the world and continue to be among the deepest, most liquid, and most efficient.”

Why is it that other markets don’t cannot just adopt (at least a tiny portion of) this, given their increasing size and power? Just political? Fragmentation?

My naivity?

(ok ok, I know it’s the latter, I thought I’d still ask the question :smiley: )

3 Likes

“The US is now trading at a record P/E premium to MSCI World ex US of almost 60% and represents 73.65% of MSCI World market cap, also a record high” --SocGen

(source)

4 Likes

Japan is calling from the 80s.

2 Likes

I looked once some time ago and IIRC Japan’s P/E in the late 80s was in the high 60s.

Edit, sources confirming memory:

In 1989, the P/E Ratio was around 70, having risen from around 20 in 1981.”.

Also:

There’s a long way to go before the S&P500 stops making us money :stuck_out_tongue:

4 Likes

I would say S&P 500 needs to be divided into S&P 7 and S&P 493. I am sure the chart would look somewhat different.

My main concern is that portfolio of a normal person is becoming very dependent on Mag7. If I am not wrong it’s almost 18-20% of VT.

I am not sure if Mag7 will continue to grow at the rate they have been growing for last 5 years. Law of large numbers will pose a challenge for them.

Ben felix posted a nice video about returns of top industries in following decades.

2 Likes

The good news is that the mag 7 will at the latest max out at 100% of (VT|S&P500).
Eventually … :wink:

People have done that, the S&P493 has done about 4-5% growth, from memory :wink:

If we want to move away from broad index investing one can do all sorts of things. The ill-defined Quality factor makes sense to me following Julianek’s post here so I have it in my 3A and some on the liquid account.

Re Ben Felix’s videos, I like them learnt a ton from them, real high-quality stuff. My one slight issue is not even a valid criticism: he is too focused on the data and leaving aside emotion. He’s a portfolio manager so he needs to remain strict on the data and scientific in his method not to be accused of being a low-quality content creator - there’s a ton of them already! I understand all this and hence can’t slight his videos, I just find them a bit dry and no longer applicable to me in terms of not making big mistakes. I’d love some opinion, some character from what’s clearly a very charismatic person. Maybe in the rational reminder podcasts there is that. I watched the vid, it could be summarized as “Don’t chase past performance because super fast, super high growth can be followed by low future returns”, it’s no longer addressed to me though.

Personally I think Ben Felix is just trying to address the urge people have to follow the trends by providing data to back his arguments. Buying high and selling low is very common thing. I just found the info interesting

However I also think that broad based index investing was created to achieve multiple objectives and one of them was to be diversified. With very high concentrations , aren’t market weighted funds moving away from that objective?

Yeah but you don’t see him pushing his own firm’s 5-6 fund portfolio. He spends a lot of time on what not to do, which after a few years has gotten a bit boring for me given doing nothing is most of what I do in terms of investing. Guess one should become a client to hear what he does recommend to do.

We need to pick a poison: either be passive and let the market decide or be active and make choices deviating from global market cap weight.

He himself has responded to a comment in a video “so going 100% VT is good?” with “it’s a good start”. I’d argue it can be a middle and ending too :wink:

We are off topic though and /Southern US drawl on…folks ‘round ‘ere don’t look too kindly on that sorta thang.

Yeah … off topic for another topic one day :wink:

From today’s Bloomberg MarketDaily newsletter:


What a quarter-century of stock returns shows

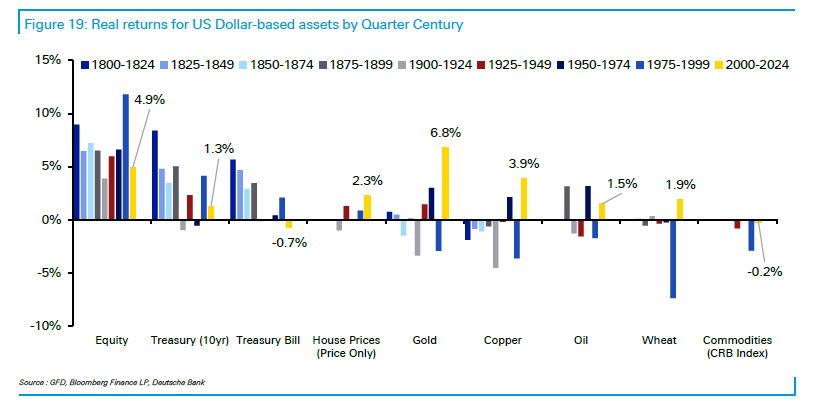
It’s hard to think of a better time for stock investing. The S&P 500 has smashed record after record, AI euphoria is everywhere and even veteran strategist Ed Yardeni — a big bull on Wall Street — worries he’s not optimistic enough. And yet for all the exuberance, US equities are actually on track for their second-worst performance over the past 25 years when adjusting returns for inflation. That’s according to Deutsche Bank’s famous study on market gains over the nine quarter centuries since 1800.

In fact, the nearly 5% yearly advance is so modest, it puts the asset class on track to underperform gold for the first time ever over this quarter-century timeframe, while precious metal, copper and wheat are among the top performers.

It’s quite the claim — one that will resonate with anyone who’s seen their purchasing power eroded by inflation. While the rally in US stocks has been far stronger than developed peers, it’s not “spectacular” in absolute terms or even relative to government bonds, writes Jim Reid, Deutsche Bank’s global head of macro and thematic research. US equities, since the 1800s, have seen a real annualized total return of 6.9% — far outpacing 10-year Treasuries.

All this may be hard to believe given the stunning developments the world has witnessed in the past 25 years from Apple’s invention of the iPhone to voice assistants including Amazon’s Alexa. Moreover, it was only in this century that three of the so-called Magnificent Seven stocks — Alphabet, Tesla and Meta Platforms — debuted in the US.

A big part of why returns have been paltry is the starting point, says Deutsche Bank. This period began after all at the peak of the dot-com bubble, which saw the highest P/E ratio in the S&P 500’s history. Case in point: Just a little adjustment to account for five extra years (i.e. from 1995) and the returns would be the third best in the sample.

And what about the next 25? The bank thinks stocks will once again reliably beat government bonds, especially given ballooning deficits.

“We’re unlikely to leave the current policy era behind where the authorities have a bias to reflate when the inevitable crises associated with a levered low-growth system come along,” the strategists wrote. “It’s easy to imagine periodic bursts of inflation.” —Isabelle Lee - Bloomberg


3 Likes

3 posts were merged into an existing topic: Chronicles of fat years [2024-2027 Edition]

https://elements.visualcapitalist.com/visualizing-the-gold-to-silver-ratio-since-1869/

The gold-to-silver ratio shows how many ounces of silver equal one ounce of gold. It is the oldest continuously tracked exchange rate, dating back to 3200 BCE

The earliest recorded instance of the gold-to-silver ratio dates back to 3200 BCE, when Menes, the first king of Ancient Egypt, set a ratio of 2.5:1. Since then, the ratio has generally seen gold’s value rise as empires and governments became more familiar with the scarcity and difficulty of production for both metals.

3 Likes

Not quite that long term, but perhaps still interesting:

Looks like the Dollar ain’t gonna go away …

1 Like