Where are other currencies?
Like RMB etc.
Most likely this is driven by lack of Russia gas purchases . I think in past it was sold in Euros
Where are other currencies?
Like RMB etc.
Most likely this is driven by lack of Russia gas purchases . I think in past it was sold in Euros
Remnibi is on the chart, and it’s also been rising since around the time of the outbreak of the Ukraine invasion … ![]() … but it’s still a tiny fraction.
… but it’s still a tiny fraction.
Ahh. Sorry I didn’t look down
I am sure Ukraine war increased USD payments as lot of LNG imports are now coming from US
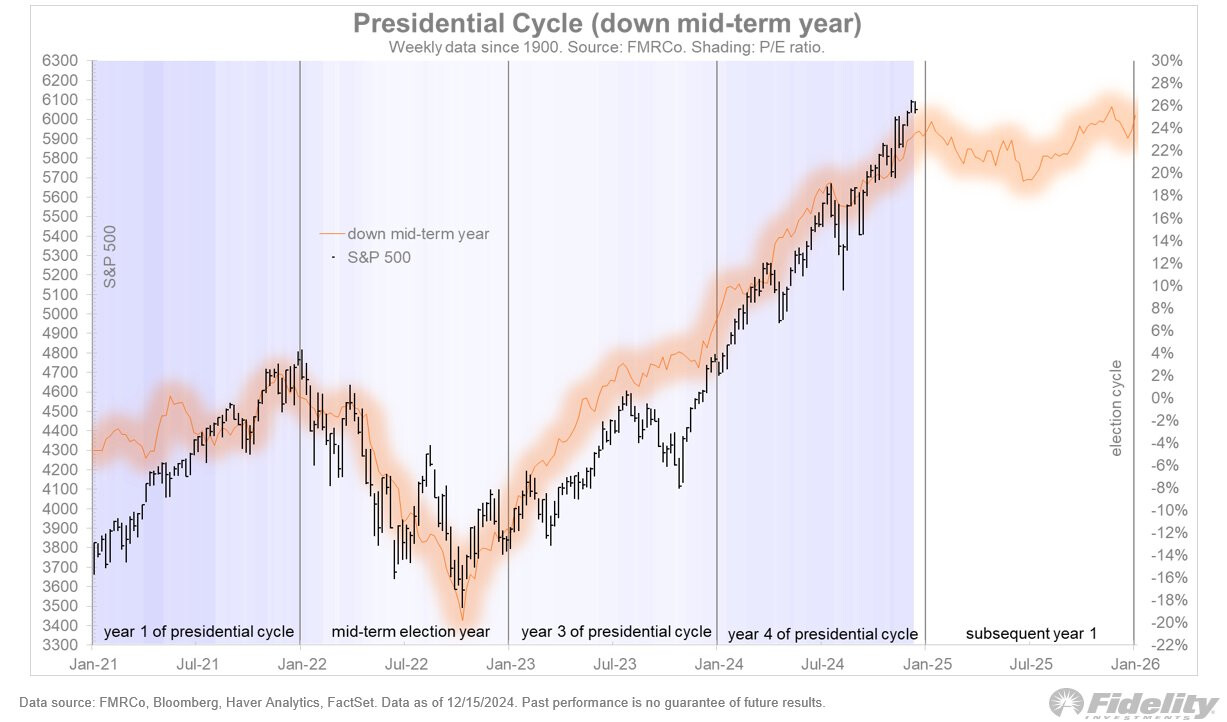
Few price analogs worked better in 2024 than the Presidential cycle, specifically the iteration below which isolates the “down mid-term” years (which in this case was 2022).
Soon we will be entering year 1 of the next Presidential cycle, which has tended to be the second weakest of the four (year 2 generally having been the weakest and years 3 and 4 being the strongest). Weak does not necessarily mean down, just below-average. Perhaps 2025 will be different as it will mark a second term sweep, but it’s something to keep in mind. These patterns are averages of a small and highly dispersed data set, and therefore should be taken with a grain of salt.
Source: x.com
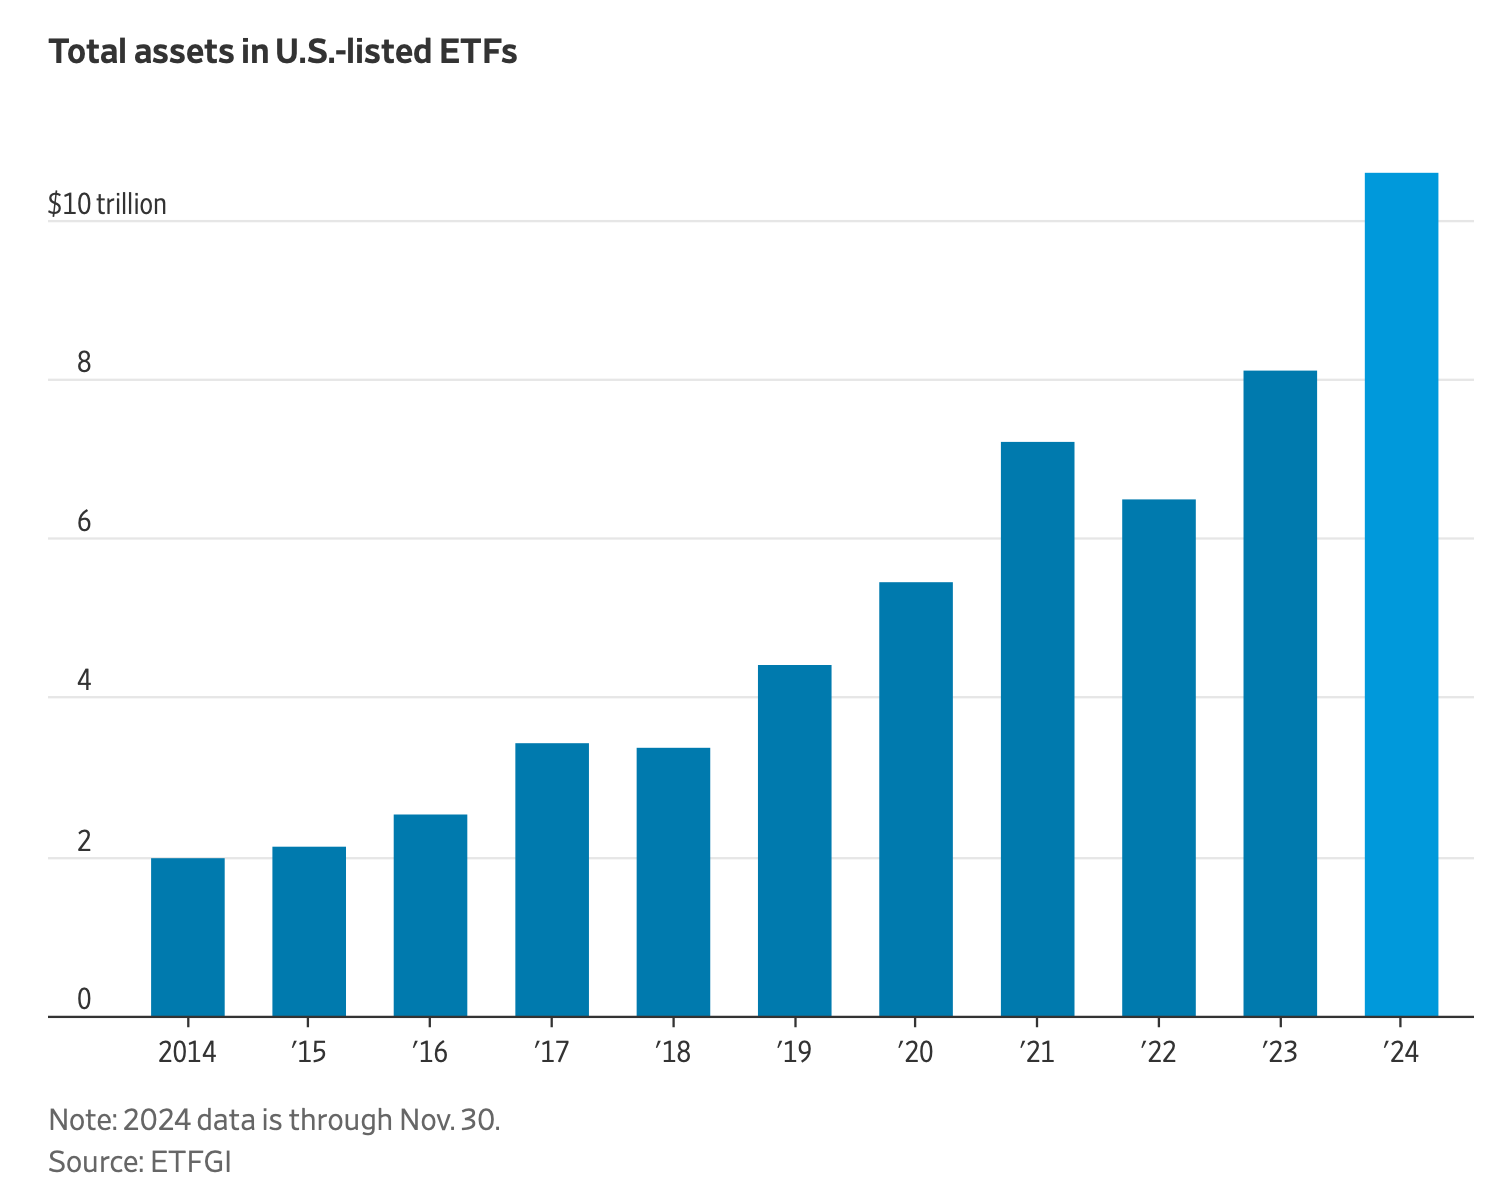
Investors plowed more than $1 trillion into U.S.-based exchange-traded funds in 2024, shattering the previous record set three years ago and raising Wall Street hopes for an even bigger year ahead.
Source: WSJ
When something start to seem like infinite money glitch, it attracts so much capital that it stops being the infinite money glitch at some point
For time being it’s US stock market
Not really a chart, but a fun essay by the one and only Clifford Asness:
2035: An Allocator Looks Back Over the Last 10 Years
Excerpts:
U.S. Equities
First, it turns out that investing in U.S. equities at a CAPE in the high 30s yet again turned out to be a disappointing exercise. Today the CAPE is down to around 20 (still above long-term average). The valuation adjustment from the high 30s to 20 means that despite continued strong earnings growth, U.S. equities only beat cash by a couple of percent per annum over the whole decade, well less than we expected.
…International Equities
Of course, after being left for dead by so many U.S. investors, the global stock market did better with non-U.S. stocks actually turning in historically healthy real returns (like 5-6% per annum over cash). It turned out that, just as we thought, the U.S. really did have the best companies (most profitable, most innovative, fastest growing) and this indeed continued in this last decade. But it also turned out that paying an epic multiple for the U.S. compared to the rest of the world mattered somewhat more than we thought, and international diversification, as we knew it would one day, did eventually work. It turns out there was indeed a price at which European stocks made sense.
Great read, i would include this insightful snippet too:
You will have to pry our Fartcoin from our cold dead bums.
![]()
From the Journal:
Your Fancy, New ETF Might Be a Little Too Fancy
Exchange-traded funds have mostly been great investments, but they are getting too complex for their own good
History teaches that financial complexity always creeps upward. Lately that trend has reached investor-friendly exchange-traded funds.
Last year, U.S.-based ETFs broke a record, surpassing $1 trillion in total inflows. They are cheap, liquid and, crucially, far more tax-efficient than traditional mutual funds. If you want to hold stocks and bonds, the flagship trackers from industry giants BlackRock, Vanguard and State Street Global Advisors already do the trick for very low fees. It is tough, and not especially rewarding, to compete with those industry behemoths head-on.
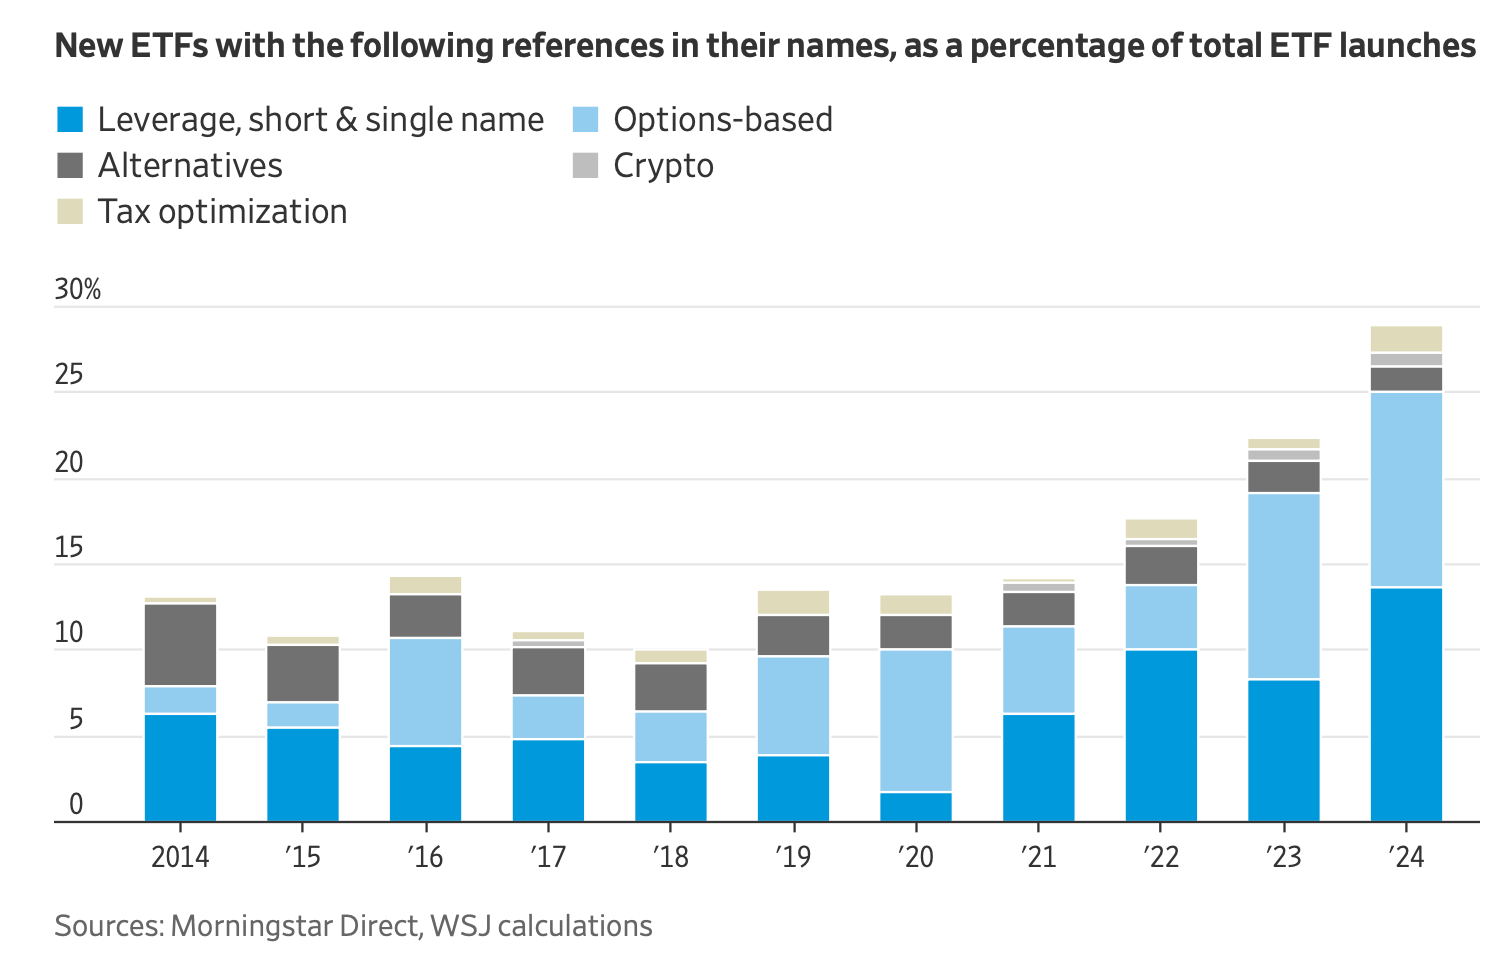
So Wall Street has found a new gold rush: packaging even the most sophisticated products in ETF form. About 30% of ETFs launched in the U.S. in 2024 referred to some complex strategy in their names, an analysis of Morningstar Direct data suggests—double the average of the previous nine years. What it says on the label is becoming increasingly creative, and what happens inside of those funds is increasingly obscure.
(Source)
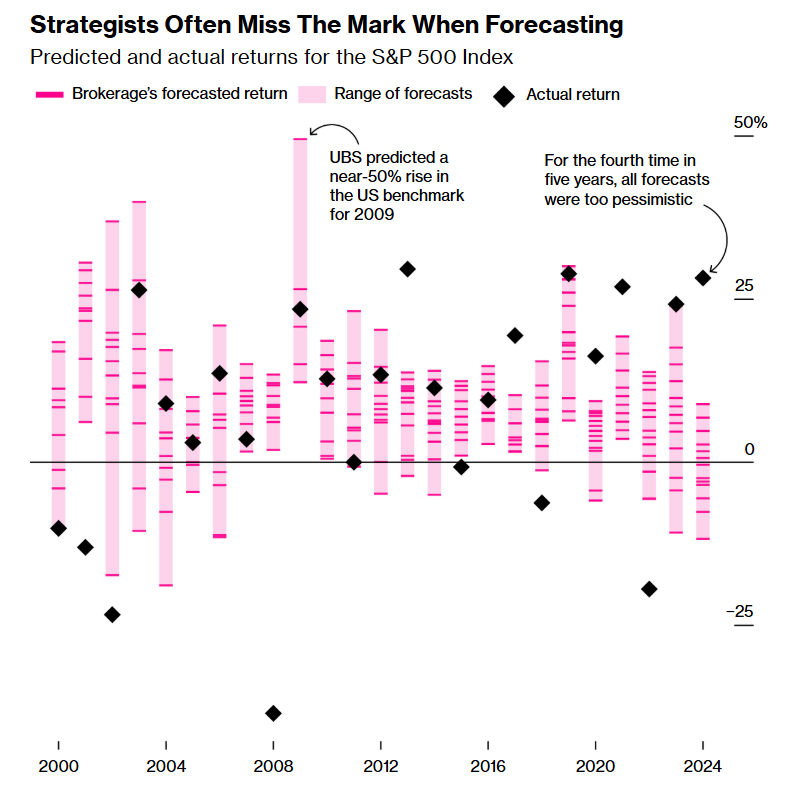
If hearing the brokerages’ average 2025 forecast of a 9.1% gain is giving you a sense of déjà vu, you’re onto something. Over the past 25 years, 53% of the 376 firm forecasts surveyed by Bloomberg clustered between 0% and 10%.
In seven of the past eight years, the market’s returns were outside the range of all forecasts compiled, often collectively underestimating the index’s return potential.
It’s what I’d referred to as “traders for hire” here.
I think a key benefit is that, as far as I understand it, ETFs can’t put one in debt if one’s long-only and does just buying and selling without derivatives.
You just gave the finance industry a new idea for a yet different kind of ETF … ![]()
I really likes this channel - clear, concise and to the point.

Makes me wonder if there’s FOTM going on BlackRock filing for hedge fund strategy ETF underlines new tilt
Pinging @Tony1337 not to double post on the MF thread.
SPDR also filed for such an etf recently
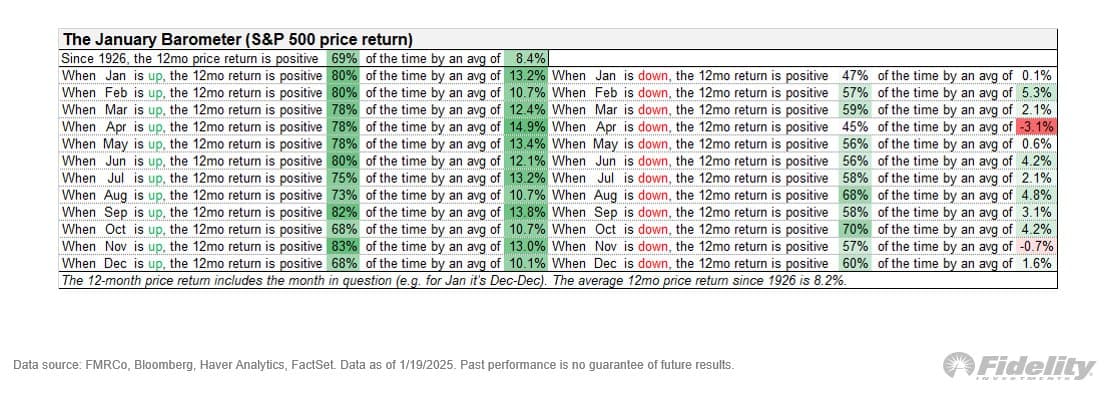
Fidelity’s Jurien Timmer:
With another week or so left in January, talk will inevitably start to focus on the fabled January Barometer. This is an age old indicator that says that “as January goes, so goes the rest of the year.” It’s good to keep in mind that statistically speaking this is true, but it is true for every other month in the year as well. All this indicator really says is that markets trend, which means that if the month in question is up (or down), it is likely part of a trend, suggesting that the months that follow will do the same.
Overall, I still think we are in the 7th inning of both a cyclical and secular bull market. That suggests that there are more gains to come, but at a less impulsive pace than what we got in 2024. Earnings will have to do the heavy lifting (which they are), with rates either supporting the valuation side or detracting from it.
(Source)
It’d be interesting to plot these data, maybe I’ll do it for fun over the w/e as there seems to be a clustering around Q2-3 for higher expected returns. Or it’ll be just overfitting/hallucination as from 1926 to today a ton of world-shaping events have taken place.
Edit: or it’s a simpler explanation, as the source is suggesting, and it’s trend+psychology driving this. A Jan to Dec-Dec makes sense as it follows the perception of “a year” as we’ve built it over millennia, so an April to March-March wouldn’t make a much sense because nobody thinks this way except the UK tax office?
I need a translation.
Baseball. Game has nine innings.
How long does 1 inning last?
Just so I know when to exit and reenter. ![]()