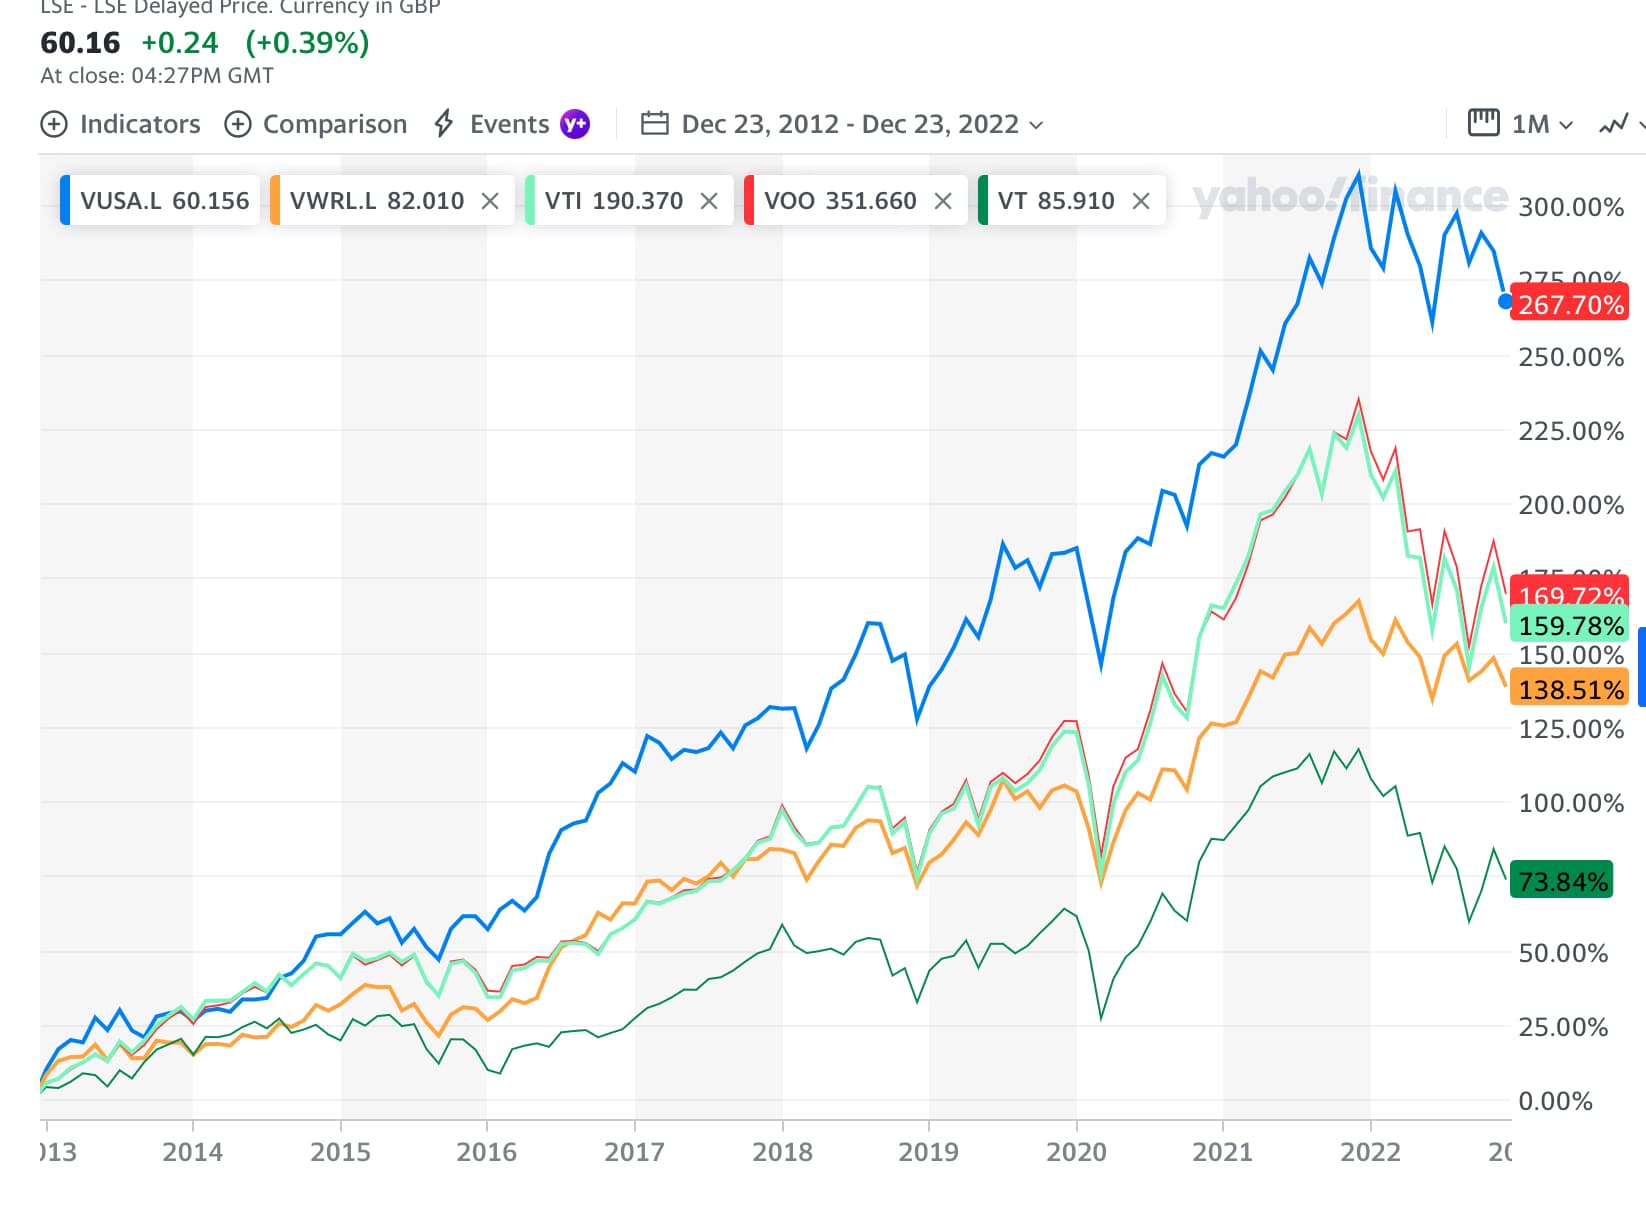
Can someone please help me? I’ve been playing with the yahoo chart comparison. Is it saying that in the last 10 years, VUSA has performed better than VOO (as ETFs tracking the S&P 500)? I do realize that VUSA has a higher TER than VOO… There are statements on google saying VOO performs better… so I don’t get how that statement would be justified, when I look at this chart. Thanks for any help and your patience.
1 Like
It looks like you’re comparing performance of ETF’s in GBP to ETF’s in USD.
The GBP easily depreciated 30% to the USD in the last 10y. That’ll give a basket of stocks quoted in GBP a “30% performance boost”, compared to the same basket quoted in USD.
5 Likes
Yes, you should compare performance of prices quoted in the same currency. Yours even shows that it’s in GBP.
You can do it in TradingView, let it recalculate the currency. From May 2012 I’ve got +192.64% for VOO and +177.91% for VUSA in USD.
P.S. Oh wow, TradingView even shows that if you have mixed currencies. My respect to developers ![]() .
.
You can give up. Yes, first of all you need to make sure you match the currency of both, so you need to look for VUSD, not VUSA.
Secondly, what you care about is total return and not price. But you’re comparing price. Yahoo does not tell you the total return (dividends included) of these ETFs.
Finally, the US and EU ETFs have different trading hours, so you’re always comparing the prices at different closing times at the start and end of period. I.e. if you choose the next day as the start of your comparison, you might get a wildly different result, because a swing in price in just a few hours can be 100x bigger than the difference in TER.
3 Likes
Vanguard publishes performance of fund’s NAV in USD. Should be relatively easy to find it and compare. I guess there are already few hundred comparisons out there.
I tried to compare it myself, once. I took e.g. 1-10 January 2010 as start date and 1-10 January 2020 as end date, added the dividends back in, and calculated the return for each combination in a 10x10 grid. But my results were inconclusive.
I wonder, regarding NAV, is it calculated in the same way for both VUSA and VOO? That is, the closing price on NYSE? Or maybe for Europe it takes the intraday price? The methodology has to be ever more complicated for VWRL / VT, where multiple exchanges are involved.
I think the price of one unit of VUSA / VOO should always stay in line. I think Vanguard deducts the costs from the dividend. But it’s just an assumption.
I would appreciate if you looked for one of this hundred and posted a link ![]() would be interesting to see if someone did a better job than me.
would be interesting to see if someone did a better job than me.
NAV is calculated once all stock exchanges are closed as far as I know. So 22:00 Swiss time.
1 Like
Thanks for all he comments and corrections about VUSA! Yes I hadn‘t thought about the currency and that Yahoo only shows the chart without dividends reinvested.
@Bojack I did see your past post comparing US vs IE domiciled funds. If your results were relatively inconclusive, I guess I’d feel more comfortable investing in an IE domiciled fund like VUSD instead of VOO for money we intend to leave for our kids - due to less hassle with estate taxes if anything were to happen.
For money I would invest for us as a couple, I could be comfortable with US-domiciled funds like VOO or VTI, if the NAV is much better than their IE-domiciled counterparts. However, my questions would be:
- Does the withholding taxes stay out of the market for a whole year for US-domiciled funds, vs. IE funds where CH isn‘t charged withholding taxes?
- Also the risk that the DA-1 refund might once be denied if we once get a mortgage is there.
Or does my simplified reasoning not make sense or based on false understanding?
…Btw, I‘m exploring US market ETFs as we have enough CH, Europe and emerging markets exposure in our Viac and Clevercircles investments IMHO.
What I meant was that I didn’t trust these results, and I wasn’t able to see any pattern.
The tax is charged on the dividends, and both US and EU are affected. When you make a tax declaration in January, you can reclaim that US tax (but not if it’s an EU ETF). Then, a few months later, you get a letter saying they have granted you the refund. So it takes about a year until you get back that withholding tax if you hold a US etf.
As you’re talking about funds with only US companies:
- The 15% US WHT are taken for both US- and IE-domiciled funds
- For IE-domiciled funds, the 15% US WHT are lost (not even listed in your broker statement). You pay Swiss taxes on the remaining 85% of the dividends
- For US-domiciled funds, you get the 15% US WHT as Swiss tax credit, but limited by roughly the Swiss taxes you pay on these US dividends (here mortgage deductions become relevant)
- If you hold US-domiciled funds at a Swiss broker, an additional 15% of dividends are withheld by Switzerland, which you always get back (independent of your tax rate) if you correctly fill out your tax declaration (timeline presumably the same as for the US WHT tax credit)
I.e., purely from a dividend/withholding perspective, US-domiciled funds held at a foreign broker are never worse than IE-domiciled funds.
As what you get back for US WHT is simply a tax credit, capped at your effective taxes for these dividends, “Does the withholding taxes stay out of the market for a whole year” doesn’t really make sense. You won’t ever get the 15% back for reinvesting. You get them back as deduction of your Swiss taxes (i.e. to avoid double taxation). You may want to account for it when deciding on how much taxes you pay in advance (depending on the canton).
On the other hand, it may be relevant for the additional 15% withheld by Switzerland. I recommend investing with IBKR if you choose US ETFs to avoid the additional 15% (and high fees).
Well it looks not so simple. After I looked at VOO vs. VUSD as it was suggested by @Bojack , there is hardly any difference between their prices. Probably there is a problem with the currency recalculation. Difference in market closing time can also affect closing prices (which are not NAVs) that we are looking at.
And after I was thinking about it, it started to make sense. Both funds track the same index, so more or less the same basket of stocks. If both funds would perfectly replicate the index, there would be no cash positions (all dividends are paid out immediately) and we would look at NAV without dividends reinvested, the relative price change should be exactly the same (in the same currency, USD). I mean, the ratio of fund unit prices should be a constant.
Now let’s think what in the real life is different from this idealized situation. I don’t think that funds’ composition and closing time can significantly affect price change. Cash positions are being accumulated before a distribution, and the pay out schedule is different. So one might see some deviations in short time scale around distribution dates. But in a bigger picture, the unit prices should change in a lockstep.
So I again used TradingView and looked at the evolution of the ratio VOO/VUSD. And it indeed looks rather constant during 10+ years (!) with occasional spikes up and down. So let’s say, the price change of two funds is the same.
Now the answer to the question, which fund has a better performance, becomes obvious: the one that you get more dividends from, that means you lose a smaller part from distributed dividends. We have reduced this problem to the one which I have already considered:
VOO has smaller TER and L2 withholding tax could be 15% or lower vs. 15% L1 withholding tax of VUSD. So, VOO should have a better performance. Calculating this performance is not straightforward as it was mentioned here, because you get reduced tax loss as a tax credit and so on.
Now a small note. If there is actually a tool that calculates total performance of VOO vs. VUSD, the results are most probably misleading. Such tool would rather calculate all distributions reinvested without losses for taxes (gross) or maybe calculate with for example 30% tax loss (net). The problem is that this reinvestment would be calculated with dividends already reduced for L1 withholding taxes for VUSD, but with gross dividends for VOO.
In fact the difference of performance between VOO and VUSD will be mostly determined by the effective L1 tax on dividends distributed by VOO, i.e. how much of 15% L1 withholding tax you can get back.