Timing the market using moving averages - an experiment

Now that you have all these data, whtly are you not doing a numerical exercise of implementing the other strategies you mentioned?
I am pretty sure for you, looking the good way you manage numbers, it should not be a big problem to implement it in excel or any coding language :slight_smile:

I hope you will take this suggestion,being sure that I would not be the only one interested in this here

Thanks in advance Wolverine

1 Like

I’m currently using my focus on trying to understand the macro economic factors of the situation we are in, how market participants react to them and how their psychology and mine evolve as time passes by and things happen.

After that, I’d like to devote some time to designing a risk partiy portfolio centered on a somewhat risk averse swiss investor with a home country bia.

I’d also like to take some time and get into Julianek’s series on valuing a business.

I don’t have much time nor interest for other technical models at the time being. I know @kraphael is making use of MACD indicators, though it seems to suit him well and he may not be looking for developping other tools.

Also, and most of all, these models/strategies function mainly in pair with our own psychology. Am I able to follow it? Does it give me more leeway to try more risky strategies on the side? Is it eating all of my time and not efficient on a maximization of enjoyment of life basis? You don’t get those answers with paper tracking, you have to have real money invested.

I don’t see myself pursuing those other strategies in the future, though this is only my current forecast and time may, or may not, change my mind.

2 Likes

You have a point. The time invested in this is definitely non negligible. That’s why I was mentioning to do it a posteriori now that you have all data pretty well organized. Just as a numerical exercise.

Is there anyone else in this forum, on top of what you mentioned already, using this kind of analysis?

1 Like

@ItalianEngineer : i’m actually using similar models to make my investment decisions…

I’m basically combining moving averages (a shorter one and a longer one to get a better feeling in what direction the market is moving) which then gives me entry and exit point.
As moving averages tend to be somehow slow to react in stress situation, i’v developped a pretty good “low-point-indicator”… those low points are only relevant in a phase where you are not invested and tend to appear all couple of years - but only when there is too much stress in the market (did not work in the financial crisis for example, but well in Eurocrisis, as well as during the sell off at the end of 2018). The last 2 ones where:

  • in March (Market Low at the time before the rebound) and
  • during the covid-low in 2020

The model is such that there are only very few transactions over time… this year would have been:

  • out 1st of February
  • in March low (due to low-point indicator) for 3 weeks as there was no “in” signal coming from the MA and then out again
  • still sitting on the sidelide…

So i’m pretty fond of such models as it is empirically proven that momentum has an edge in investing…but i won’t elaborate much more on it as we are looking at a specific experiment here.

2 Likes

Eventually in a different post or in private, I would. Interested in knowing more about this low point indicators you developed.
Literature background? Or fully developed by you?

Are you doing all these manually or through programmed trading sw?

1 Like

I’ve been assuming the question was directed toward @FI_yes_RE_maybe but just in case, everything is manual for me. Both because I like it that way and because I don’t have the desire to develop the skillset required to automating it while still understanding what’s going on behind the scenes.

Alright, folks, it’s update time and boy are these times, well, interesting. September was a down month, big time, as I assume US market participants finally came to terms with the idea that the FED was going to tighten for real. That is, until the first days of October but they seem to have settled again.

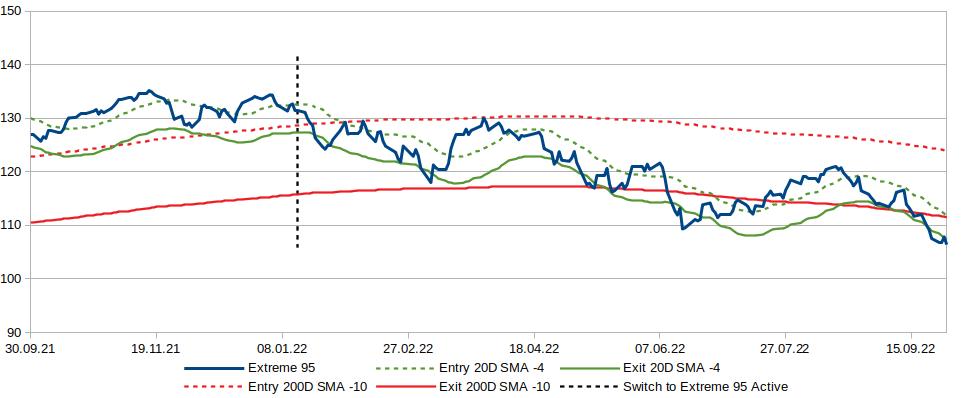
Situation at the start of the month
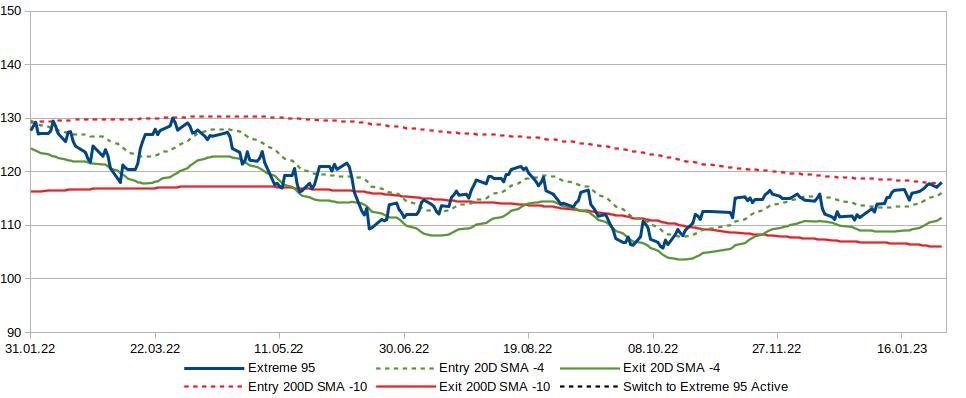
The 20D SMA -4 strategy was invested.
The 200D SMA -10 strategy was out of the market.

Triggers

The 20D-4 strategy proved excrutiatingly resilient to triggering its exit and only got divested on the 27th. It just barely stayed so at the start of this week.

The 200D-10 strategy didn’t get close to triggering its entry. As expected, it is way less subject to volatility, allowing for potential greater relative losses on a miss but also greater peace of mind by not being subject to the daily swings of a market like the high volatility one we’re having now.

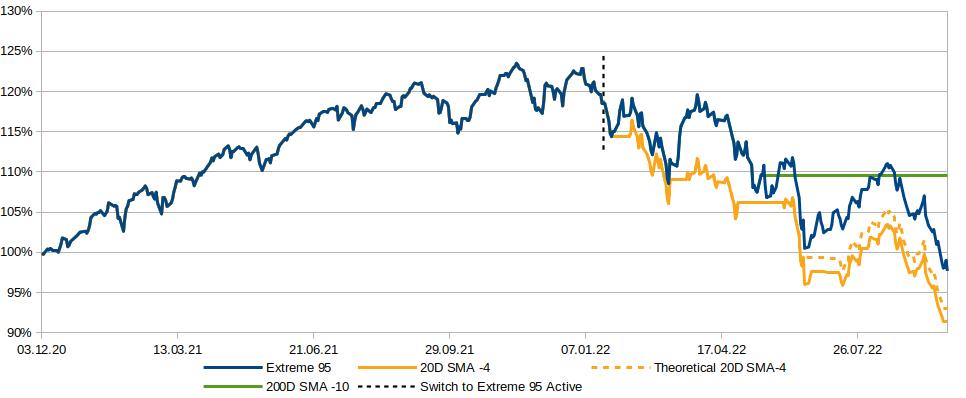
Time-weighted returns

It’s still too early to draw conclusions on that front. The 20D-4 strategy is loosing for now and will have some work to do if it is to get ahead out of this specific downturn.
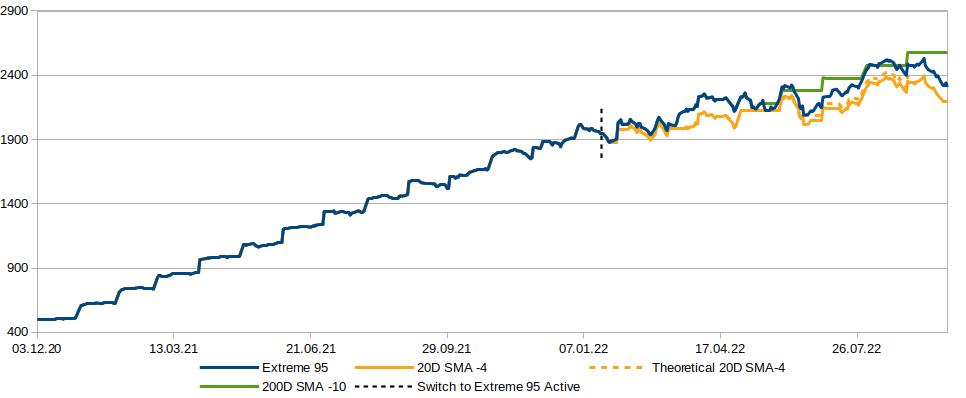
Real data

Not much to say. Looking from this perspective, being out of the market and having new contributions actually taking my assets higher looks good, though I’m a bit detached from it these days.

Mood: not gonna lie, I’m not sleeping much with the kind of gyriations we are having right now. Not really because of this experiment, nor because of the buy and hold part of my portfolio but because I’m trying to grow a small betting position I have on the discrepency between where the market is and my lecture of it. Trying to read the market is excrutiating.

20D-4 Th. 20D-4 200D-10 Bench.
TW Returns
CAGR -4.6% -3.7% 4.9% -1.2%
September 22 -7.3% -7.3% 0.0% -7.6%
YTD -25.3% -23.9% -10.4% -20.1%
Max DD
All time -26.0% -24.7% -11.3% -20.9%
September 22 -8.4% -8.4% 0.0% -8.7%
YTD -25.6% -24.3% -20.5% -20.5%

Red all around and new lows. Let’s see if we are heading into Downtober or Octuper! :smiley: As of right now, all bets are off.

1 Like

Well, the 20D-4 entry trigger just got crossed. This is not a 2008-like crisis. :laughing: (I had used 2008 for my backtesting).

When you say that it is not like the 2008, what do you mean in practical terms, from the moving average perspective?

Can you please share your back calculations on the 2008 and eventually highlight what you mean?

Thanks a lot for the great effort you are doing for this community. Many of us read your post, but we tend to forget to thank you for sharing such good, extensive and continuous job. Thanks!

That data is on an “old” hard drive on which I will have to get my hand again. I’ll try to answer within a week but that might take a bit longer.

Howdy folks? Long time no see!

Things have happened that got in the way of updating this thread, mostly life but also a software update that did outclass my smartphone and made me unable to access my account data (but I still had access to the benchmark fund, so all is good).

No trigger was hit during that time, until today. The entry point of the 200D‐10 strategy has been hit and all funds will be invested going further, until the next exit trigger gets hit.

I’ll do more reporting this weekend but that’s where things stand for now.

7 Likes

I have to come clean and announce that this experiment has been brought to an end. I had lost track of it when I changed computer early this year, then dealt with the perturbations coming with being fired, searching for a new job and starting it.

My plan was to get back to shaping my tracking file and posting updates as things got better, then I found and bought a house that was at the border of my affordability threshold and, after some debating, have decided to move all my 3a assets to my financing bank in order to “gain” leverage when I’ll come back to them to negociate a bigger mortgage to fund the renovations I am planning to do.

A big thanks to you for having been following me and my apologies for not coming through. May your investing ventures be fruitful and your life fulfilling.

10 Likes