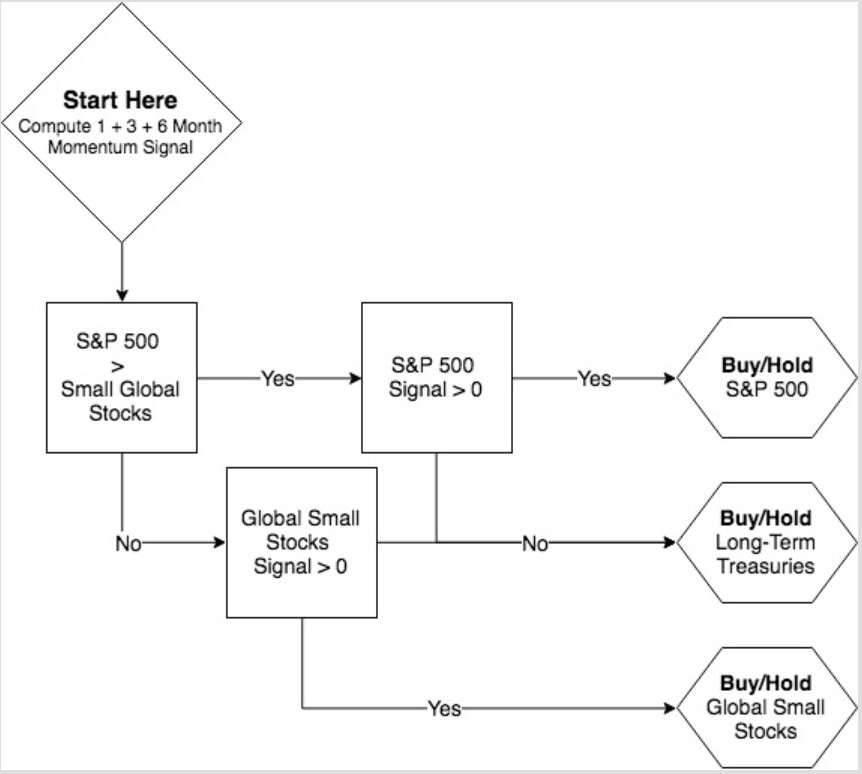
Timing the market using moving averages - an experiment

Hi folks!

Some of you have seen that I’ve opened accounts with frankly. to give in to an experiment I’ve been wanting to try for some time: timing the market using moving averages. I’ve now launched it and will provide regular updates as to how it is going but for now, let’s spend a few posts talking about the setting.

So…
.

What are moving averages?

There are several kinds of moving averages. For the purposes of this experiment, we’ll only focus on Simple Moving Averages (because I’ve not studied the use of other kinds well enough and the few dabbling I’ve done with them is not conclusive to how I want to use them).

They are averages drawn on a set period of time, that then move with the current date. When the curve you’re studying goes up, moving averages are usually below it (because past data was lower than the more recent one). When the curve you’re studying goes down, moving averages are usually above it, given it either goes low enough or for a long enough period of time.

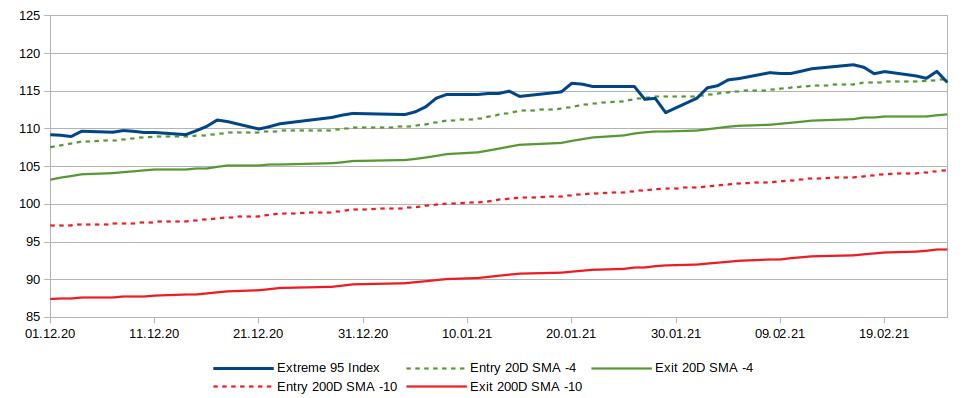
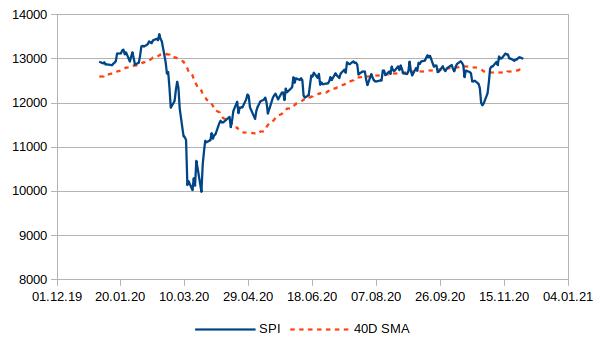
The graph below shows a plot of the SPI (blue line) and its 40 days Simple Moving Average (dashed red line) from January to November 2020:
40DMA_sample

.

How can they be used to time the market?

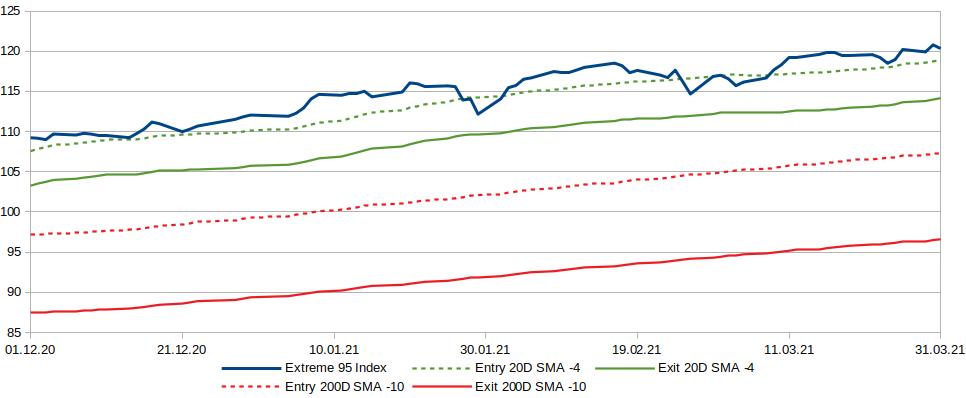
The magic can occur because moving averages don’t behave like the curve you’re applying them to but they cross it, both when it goes down and when it goes up. And they cross each other, providing easy to identify data points that can be put to use… or not.

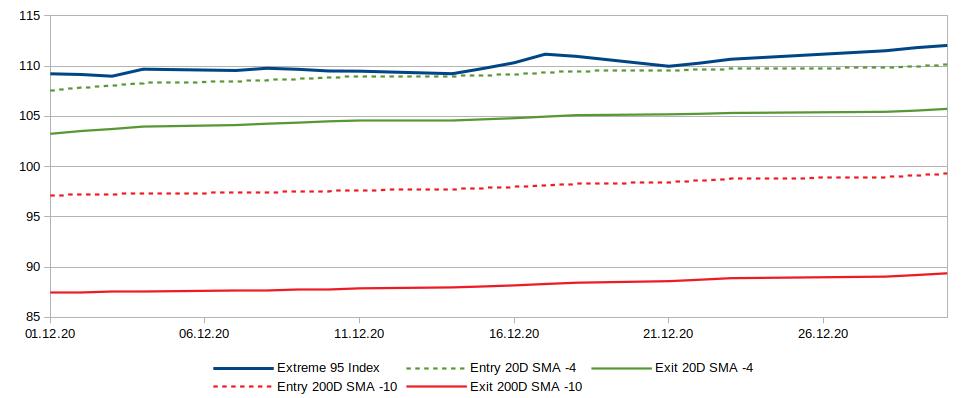
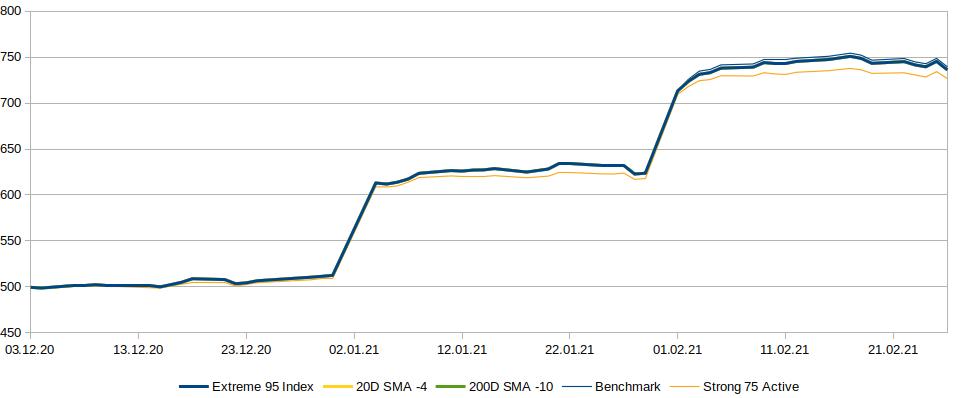
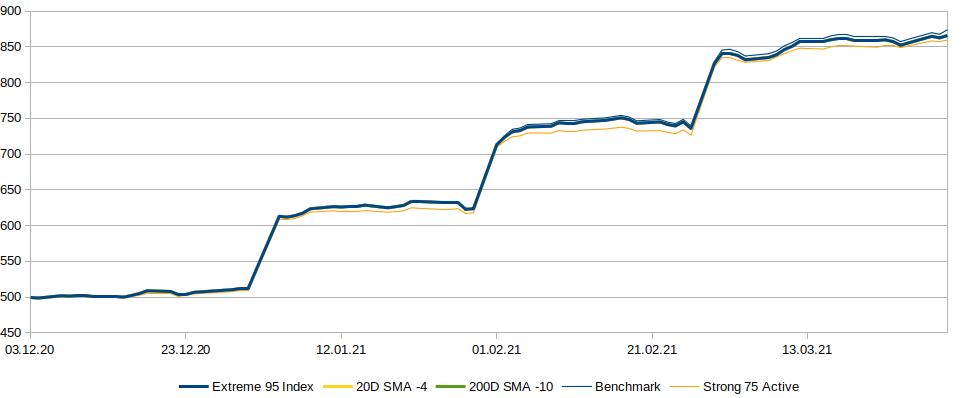
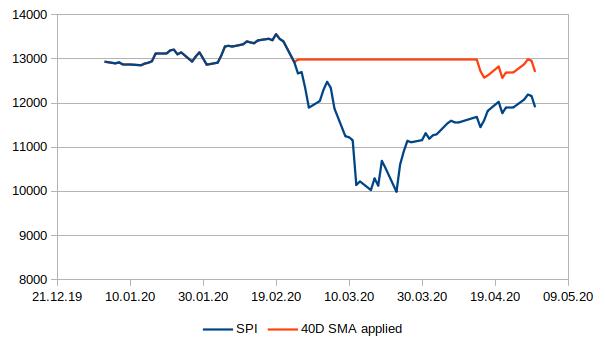
See that graph below? The red line is what would theoretically have happened with an investment “tracking” the SPI (blue line) from January to April this year, if it had exited and entered the market based on the crossing of the 40 days Simple Moving Average, checking at close what move should be made and buying/selling when the market opens.
40DMA_start2020
.

Notable is that an investor following that strategy would have avoided most of the drop and increased their returns.

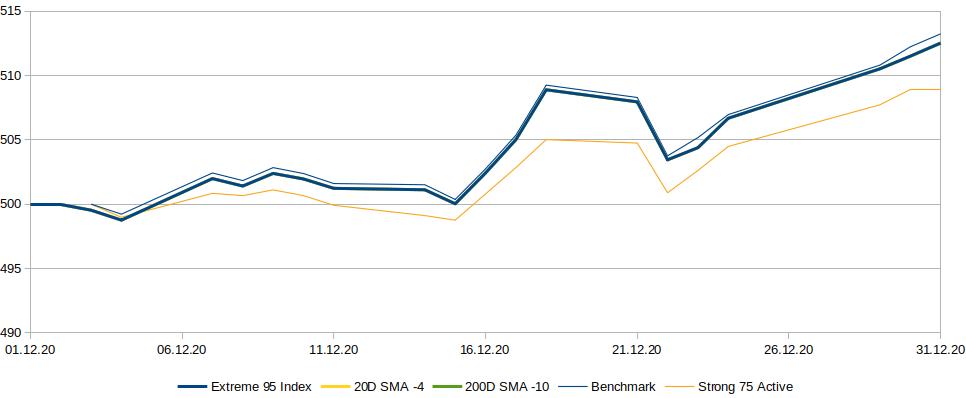
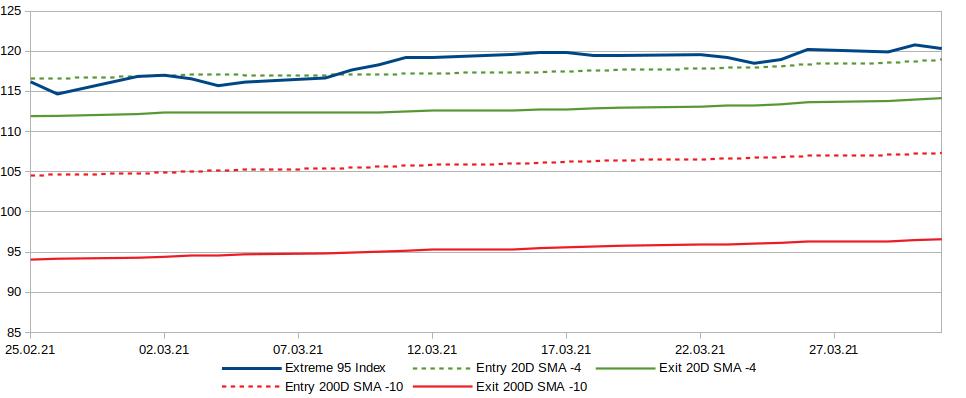
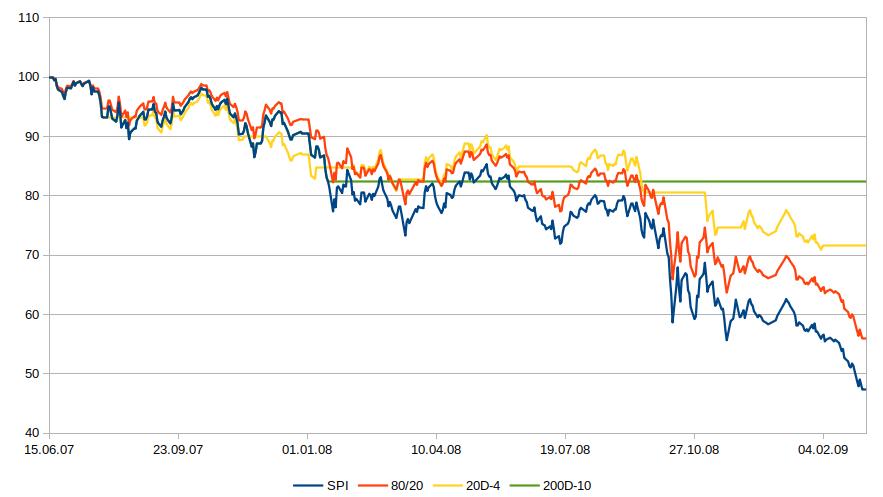
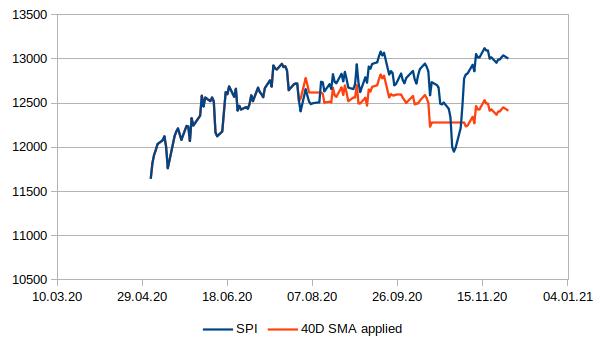
But… see that other graph? That’s what would have happened with the same strategy, this time from May to November 2020:
40DMA_mid-end2020

.
Moving averages are not magic but they can help inform decisions. They are very good when the market goes up unequivocally, and then goes down significantly, then starts going up again, but slowly. They are awful when the market is basically flat but volatile: they start providing entry and exit points all the time, you keep getting in and out at the wrong time and you incur fees. That’s bad and can drain your account while everybody else is staying flat.

The previous graphs incurred no fees when buying or selling assets, the fund was following its benchmark index without discrepancy and had a TER of 0%. The investor was paying no taxes. You can imagine the effects of flat markets on your investments when you are subject to spreads and fees: the wrong strategy can quickly melt your assets when everybody else is standing still.

.
What can I expect?

I can expect downturn protection. Sharp downturn? Protected. Watch them panic about their portfolio loosing value and/or hesitating about the right time to enter the market again and grin.

I can expect false positives. No matter how you design your strategy, there are some points right after you’ve made a move where you are vulnerable. If the market changes behavior just after that, you’ll probably face a false positive. That means that you are selling low and buying high. You are loosing returns. That is fully normal, it happens from time to time, or often, depending on your strategy. I’ve put a real empasis about what kind of false positives I was willing to accept while crafting my strategy.

The protfolio can go down to 0 in a slowly decreasing market. Downturn coverage isn’t 100%.

The portfolio can go down to 0 in flat but volatile markets. Some strategies can reduce that, I’ve designed mines to lower that vulnerability.

I may get better returns than the fund I’m using at times. Overall returns are deeply affected by the starting point and behavior of the market, so I may beat the market, or not.

I can expect lower volatility than a (near) 100% stocks fund.

6 Likes

About my strategy:
.

Why applying my strategy on an ETF?

ETFs usually represent a broad basket of stocks. I have no control of what goes into it and, as with individual stocks, can’t tell at any time in which direction it is going to go. I also find it hard to consider owning shares of an ETF as owning a participation in the companies it holds. I get no voting rights, I’m not part of the decisions of the fund. For all intents and purposes, to me, an ETF is a curve. It is a wandering price per share that I can’t control and can just watch. Using a graphical approach to them makes sense to me. Treat a graph like a graph, no emotions involved.

.
Why frankly.?

As stated above, I’m not a fan of ETFs. 3A solutions don’t offer investments in individual stocks, though, so mutual funds is the way to go for stocks investments by default.

3A assets also aren’t really my assets and they don’t count either in my income, nor my net worth. As such, I’m not restricted to any holding period that may expose me to being classified as a professional investor. 3A solutions are a great place for shorter term investments and strategies differing from the proven buy and hold. If my strategy requires me to buy and sell the same asset in a two days interval, I can do it without loosing any sleep.

frankly. offers few funds but the active ones are relatively low fees (0.47% TER at the time of writing). The Extreme 95 Index incurs additional fees for the RE part of its investments as well as 0.1% issuing fees and 0.09% redemption fees, which is problematic but not overall too high (beware of their other passive solutions, these fees are higher).

They offer quick realisation of your orders (3 days to get in/out of the market with a passive solution, 2 days with an active one), which is paramount to my strategies (there are ways around a slower but planned processing of your orders like VIAC offers but it’d be less interesting to follow a strategy based on that).

frankly. depends from the Sparen 3 pension fundation of ZKB. It has been developed by the ZKB, which I trust.

.
Why the Extreme 95 Index solution?

Because of its high stocks allocation, higher expected returns than the Strong 75 Active, still low fees (issuance and redemption fees are reasonable, the RE part of the fund is low). The 3 days delay between an order and its execution is a problem but should be manageable.

I may switch to the Strong 75 Active later on if I realize that either the fees or the additional delays are costing more than what is gained with the additional returns.

.
And all that being said: what exactly is my strategy here?

I’m used to read that timing the market is difficult because you have to get right when you exit AND when you enter. I actually find that knowing when to enter is the easy part: the market goes up more than it goes down, you WANT to be in most of the time. If you don’t know whether you should be in or out, the answer is easy: that means you should be in. You should only ever be out when you have a solid explainable reason to do so that convinces yourself and you can state unequivocally to other people. That’s when you know you want to be out. The rest of the time? You want to be in, no matter if stocks are said to be overvalued and it’s said that a crash is coming and the market has already started going down.

As I’ve started fidling with curves and numbers, it’s become apparent to me that what would define my strategies was what level of exposure to false positives I am willing to take (how deep of a dip I want to happen before I get out) and how long I want to stay out when deep crises happen.

But no matter what moving average curve I would use, I’d keep a huge vulnerability to flat markets, because if the market remains flat long enough, it doesn’t matter how long a serie of data you are considering, your moving average will wander around the underlying curve and cross it all the time.

That lead me to consider using two different curves for getting out and entering the market. After fiddling some more, it has become apparent that if I wanted to avoid flat markets, I needed to use not a real moving average, but to lower it by some amount in order to have it float below everyday volatility.

Now, when I’ve experimented with getting back in the markets, there has always been this uncomfortable spot right at the start where you don’t really know what to do if the markets drop again, because you don’t have a usable curve to use as marker. In order to avoid that, I’m using the Simple Moving Average associated with my exit curve as my entering curve. That way, I always know what to do: the two are parallels and the space between them is used to follow whatever move had been enacted earlier.

I’ve come up with two strategies:

  1. Medium catch-all strategy
    I want a reactive, short term moving average with just enough of a percentage modifier to avoid most of the smaller dips but still catch most of the prospective ones. This leads to the:
    .
    20D SMA -4 strategy: I’m exiting when the price of a share of the fund drops below the 20 days Simple Moving Average -4% and entering whenever it crosses back the 20 days Simple Moving Average curve.
    .

  2. Long term deep crises strategy
    I also wanted a strategy that would be impervious to all but the deepest crises, which leads to the:
    .
    200D SMA -10 strategy: I’m exiting when the price of a share of the fund drops below the 200 days Simple Moving Average -10% and entering whenever it crosses back the 200 days Simple Moving Average curve.

.
And so you have it folks! I’ll soon post my December update. Spoiler alert: it’s boring and nothing happens. Most updates should be like that, the purpose is to be in the market most of the time, after all. :wink:

6 Likes

Howdy, folks!

Want action and a good thrill? Well, this ain’t it.

I’ve been putting CHF 500 (each) into three accounts. One will follow the Extreme 95 Index strategy without market timing; that’s my benchmark against which I can weigh the use of the two tested strategies. The other two funds will follow one of my designated strategy each. I’ll be adding CHF 100 to each account on the first business day of each month.

The initial investment was credited on the accounts on December 1st, it’s been invested on December 3rd.
I’ll be using two diagrams for monthly feedback. Let me know if you’d want additional data or would prefer another format. All prices are taken at close (no intra-day values taken into account).

  1. Theoretical values of the Swisscanto (CH) Vorsorge Fonds 95 Passiv -VT CHF- (the fund in which assets following the Extreme 95 Index strategy are invested), as displayed by the ZKB: https://zkb-finance.mdgms.com/products/funds/zkb/prochart.html?FI_ID_NOTATION=272840096
    .
    With entry and exit curves for both strategies:

  1. The actual value of my investments as shown by frankly. on my account.
    I’m adding the Swisscanto (CH) Vorsorge Fonds 95 Passiv -VT CHF- adjusted for the amount invested as a benchmark as well as the Swisscanto BVG 3 Responsible Portfolio 75 RT CHF (Strong 75 Active) to keep an eye on the true cost of the additional fees and delay of the Extreme 95 Index solution.

.
Mood: happy with my gains.

December 2020 returns (all strategies): 2.5%
December 2020 max drawdown (all strategies): -1.1%

1 Like

Hello Wolverine,
perhaps I’m the only one, but I find very interesting your trial. I was always very interested by this topic but, because of lack of time I never went truly through it.

I have some points of reflection for you:
1-would not be better to apply it on a passive fund, in which you are somehow sure that the tracked indexes remain constant in the time? All your calculations might work well, but if the fund manager changes fund composition than you are out
2-did yuo intended to do it only on an initial lump sum or also test what happen when this is done on regular payment (just for example, 100 CHF/month)?
3-Did you carry on a long term simulation backanalysis (5-10 years min) on both cases mentioned in point 2, to see if the method truly works?
4-How did you selected the 4 and 200 days? Are you sure that 4 days is a good timeframe taking into account that any decision you will take will have a delay of 2 days minimum?
5-Did you consider taking a third possibility in which you weight (how, I do not know) the informations coming from the short term analysis (4 days) and the long term one (200 days)? In case they do not agree how would you select which one to follow?
6-How are you feeding your data and how are you calculating the entry point? Everything done manually or automatized excel file that alert you when is the time to move?
7-Did you think to share realtime with the community the data obtained and eventually the moving time?
8-Can this be done in Frankly or there is any policy limitation?

Last but not least, December 2020 was an easy month, always growing; I’m waiting in a bit more critical months, in which singal are discordant and there is truly the need to enter and exit the market

Thanks a lot for the big effort you are taking for the community. I’m sure many people are teased by this idea.

Best regards,

ItalianEngineer

2 Likes

Hi @ItalianEngineer and thanks for your reply. I like where your mind is. This is meant to be a living experience, I’m looking forward to gathering feedback and ideas from you.

Warning, wall of text ahoy!

Frankly.'s Extreme Index 95 is advertised as a passive strategy, it invests in the Swisscanto (CH) Vorsorge Fonds 95 Passiv -VT CHF- fund, which they say is a fund of passive funds which are not detailed and I have no clue what indexes they track.

Frankly. is a very opaque provider, which is not important for this experiment. It would worry me very much for a normal investment if I was not in as much for the fun value than the returns.

So, yes, it’s better to use a passive solution. I’m assuming this is what I’m using but, in truth, I have no way to verify that.

I’m investing 100 CHF/month on the first business day of each month.

I’m using a lot of gut feeling but I’ve tested 2019-2020, 2016 and 2007-2010. The fund is not that old so I’ve used the SPI, which it doesn’t track. I’ve chosen this index because it’s flat pretty often and that was the situation I was worried of, so wanted to give it additional weight.

Backtesting while keeping in mind how I’ve felt this year in regards to what scenarii I want to avoid and what constitutes an acceptable false positive.

For the 20 days SMA (I’m not using a 4 days SMA, the 4 in the name of the strategy refers to the -4% I apply to the 20 days moving average when checking for signals to get out), I’ve considered the October dip as an acceptable false positive: I was really feeling that this could be it and would have wanted downside protection against it.

For the 200 days SMA, the February-March drop would have been a false positive. It felt like a big crisis, so I find it acceptable that it matches the criteria to get out of the market. Avoiding that would have made the strategy mentally inefficient in 2008, which is the kind of crisis I wanted to design it for. It would have come into effect too late, letting way too much space for panic before actually lessening the hit.

In truth, I have good confidence in the first strategy and not so much in the second but I’m willing to get surprised. Best case scenario, I realize none of them works and get to really believe in not timing the market at all instead of just doing it because it’s the word on the internet.

I’ve considered a lot of things but not that particular one. I’ve pondered using a sliding asset allocation rather than an on/off switch (going from 100% invested, to 90%, to 80%… instead of just 100% or 0%).

I’ve considered using two different moving averages to go in and out of the market, adapting the one I use to get out to match the ones available after re-entering the market after a drop.

I’ve considered applying a mix of indicators and gut feeling to discard positive signals when I believe we’re in a flat market.

I’ve considered reverting it and trying to aim for the periods where the market goes up significantly, being out of it the rest of the time. This one could actually show promise but would have required starting the experiment with it not invested, which it was too late for when I thought of it. It would have to be compared to a different benchmark, with a more conservative AA since it’s purposefully never going to beat the market but aims at lessening my exposure to down markets.

All in all, I like the concept of these strategies because it gives me clear signals to follow in times when the market gets wild. It doesn’t have to beat the market to work, but it has to provide me with emotional stability in times of turmoil. I’m not putting a significant part of my portfolio on the table, though, so that effect will be lessened.

I’m using two different accounts, one for each, so if they disagree, we’ll get to track the impact of both of them. They should agree whenever the 200 days strategy get triggered, though. The 20 days one should just keep hopping in and out of the market while the 200 days one should steadily stay out in case of a really big and prolonged drop.

I’m a big proponent of doing everything manually. I’ve entered my historical datapoints for the backtesting manually, one by one. This gives me a kind of a feel of what it would have meant being invested in those markets and better understand how I would react to it and how my strategy behaves in that context. It could be automated, though. It may be better if you don’t want to spend a lot of time managing your finances or prefer not to know what’s happening for psychological reasons.

That’s the purpose of this thread. I intend to update monthly but post every time I get in or out in real time. What will get in those updates will depend on the occasion.

Not that I am aware of.

I know, right? It feels strange rooting for a big downturn or even just more volatile times just to get more significant data points (which would probably lower my returns in the second case xD).

Have fun and enjoy the ride. :slight_smile:

2 Likes

Time for an update!

January has been pretty smooth though things may take a turn down in February, or not. I’m glad I have an exit point if it does and glad I get to ride the wave upward if it doesn’t.

I’ve tried to evaluate what to do in my VIAC account, where any reaction would take one month and the best solution still seems to ride the wave down and then back up. If you can’t do it, like I probably can’t (troubling times are a time for experiments), you may not be 100% invested right now so other strategies aimed at offering downside protection are costing me returns right now.

This update is mainly about getting my formulas right and choosing how to calculate my returns. I’m using the value of VT class of shares as provided by frankly. to figure out exit and entry points. I’m tracking my monthly returns with real unprocessed data. Since new inputs of money happen between months, I’m using normalized data to calculate returns and drawdowns for longer periods than that.

So, how close are we to exiting the market ?

January 2021

Since December 2020

Not very close. The three curves are sitting on top of each other, so only one is showing. We’re on a downward slope, though, so the medium-frequent strategy’s exit point could be hit early February, or not, once again, I have no way to know. The deep crisis strategy still has a long way to go before getting activated.

Here are my real data:


Still nothing has happened and extra fees (the reason I’ve added the Strong 75 Active curve for comparison) wouldn’t make it better to use an active frankly. solution as of yet. The new inflows (that steep increase between December and January) dwarf the returns but that’s normal at the start.

Mood: happy with my gains, glad to have an exit point with the medum-frequent strategy, not caring for the deep crisis one.

January 2021 returns (all strategies): 1.8%
January 2021 max drawdown (all strategies): -1.8% we’re in a middle of one, though.

All time compound monthly returns (all strategies): 2.2%
Annualized, that’s a 29.8% rate of returns. The markets are climbing steeply right now.
All time max drawdown (all strategies): -1.8%

All time meaning since the beginning of December last year so it’s a very short all time. :wink:

Edit: corrected the returns: I had left out one day, creating gaps from month to month.

For the record: Frankly has a day of delay with the US stock market, so today was a down day even though both the S&P500 and the SMI/SPI are/were up. There’s not much comfort in thinking that I may hit my exit point while knowing it’s going to go up the day after. Sticking to the rules looks like it’s not as easy as I thought (there’s still a good 2% down to go before actually hitting the exit point).

We’re talking about small amounts of money, so that balances it. It’ll be interesting to see how I react when the size of the accounts will have grown.

Hello!
In the past, I spent a lot of time looking at various indicators but found that you end up just letting them tell you whatever you want to hear by changing the coefficients and overthinking it as if you were analysing a physical signal. Moving average: change the number of samples, exponential average: change the weighting factors. Want to be smarter than moving average ? Take its derivative. And the derivative of the derivative for earlier warning. There are tons of neat indicators but they really should be (in my own opinion) only helpers, indicators, and not decision makers. If you go with simple indicators like moving average & exp average, I found that Relative Strength Indicator and Relative Momentum Index are good complements.
At the end of the day, timing the market is more about psycology of the crowd rather than curves analysis.

2 Likes

Hi Stef!

Indeed. I don’t quite trust myself with acting on my understanding of crowd psychology yet, provided I don’t even know which crowds I’m dealing with, what market participants hold what amount of assets and how they react to diverse scenarii, so I’m settling for 100% rules based for now. It makes it easier to discuss it here, too.

Thanks for your insight, I guess I’m walking on the path you’ve gone through, your inputs may make the trip and further understandings quicker.

Nothing worthy of mention happened in February, we’re still on track for a 20%+ returns year. The fund looks to be balanced enough that the worst drop so far has only been 3.3% (between January and February), which has been partially eaten by a contribution hapening at the same time. We may be on track for more of the same: good months with drops at the end seems to be a theme for this year.

February 2021

Since December 2020

Real data

Mood: nonplussed, this is starting to get routine.

February 2021 returns (all strategies): 1.7%
February 2021 max drawdown (all strategies): -2.0% (could get deeper in the coming days)

All time compound monthly returns (all strategies): 2.0% (annualized: 26.8%)
All time max drawdown (all strategies): -3.3% (January 21 to February 1st)

YTD total returns (all strategies): 3.44%
YTD max drawdown (all strategies): -3.3% (January 21 to February 1st)

Edit: corrected the returns: I had left out one day, creating gaps from month to month.

Amy update Wolverine?

It’s working. By that, I mean that the fund is going up and I am invested in it. We’re still on track for a 30%+ year, which seems too good to last so we’ll see if it holds up, flattens or drops in the future.

That’s beside the experiment but I’m a little bit excited because I’ve transfered my other 3a assets to VIAC and they’ll be invested in the global 100 strategy for April. Frankly has also launched an “Extreme 95 Active” strategy, which means I’ll be able to do some nice comparisons next month to see which one performs the best. Looking forward to it.

I’ll update with numbers and graphs in the coming days. Thanks for your interest. :slight_smile:

Hello Wolverine,
impatient to see the numbers. But as you said, I do not expect any big surpirse…
What do you mean by “Extreme 95 Active” ? Was it there already last year, no?!

Hi guys,
I am not sure I saw it mentioned but a marketing strategy remind me of the Dual Momentum strategy with Global Equities Momentum (GEM) from Gary Antonacci.
The idea is to keep your whole portfolio either in the US stock market, Treasury bonds or Small caps based on a rebalance signal.


I have found this blogpost that track its performances.
He followed 4 other market timing strategies.

I was interested in the strategy but never put it into action. I remain more lazy invested.

Actually, I don’t think I’m doing a good enough job of emphacizing the fact that me still beeing invested is a part of this working: in order for it to be so, I need to be out of the market when the fund goes down significantly, but I also need to be in when it goes up. I’m one of the people who think stars are aligning for some big downturn sometime in the future. This strategy makes my beliefs irrelevant (just as a simple buy and hold one would): if a downturn occurs, I am ready and will have a signal to follow, I can stay invested without worry.

We’re having relatively volatile times (not April 2020 levels but sill). We’ve had another 3.2% drop between February and March and it didn’t send a signal: the volatility sensitivity tuning is working this far (just as a reminder: there most probably will be false positives at some point still).

They had active 10, 25, 45 and 75 solutions. They have added a 95 one on Tuesday. It contains 5% bonds so, despite their advertising that it’s meant to overperform its benchmark, I’m expecting underperformance but who knows? Maybe my assumption that they’re swiss institutional bonds is wrong and they actually have some yield, and some risk baked in.

@FunnyDjo Thanks for the discoveries. I’ll have some reading to do and will come back to you when it’s done.


March has been a relatively volatile month, starting low and raising up. Nothing extravagant but very good gains and a few indentations.

March 2021

Since December 2020

Real Data

I’ll replace the Active 75 control line by the Active 95 next month. It’s there to keep a check on fees (there are no fees to buy and sell active funds on Frankly) and selling/buying delays (active funds have a 2 days delay, passive ones a 3 days one).

Mood: happy with my gains.

March 2021 returns (all strategies): 3.64%
March 2021 max drawdown (all strategies): -1.1%
Intermonths drawdown (all strategies): -3.2%

All time compound monthly returns (all strategies): 2.4% (annualized: 33.1%)
All time max drawdown (all strategies): -3.3% (January 21 to February 1st 2021)

YTD total returns (all strategies): 7.31%
YTD max drawdown (all strategies): -3.3% (January 21 to February 1st)

Note on graphs and numbers: I’ve corrected the range of data displayed in the first graph to add the last data point of February and stop missing that day. I’ve done the same for the YTD computing, which used to start on January 4th and now starts on December 31st 2020).

Do tell me if you’re interested in other data.

In these 3 months there was no trigger to sell?

So for now the results are the same as your benchmark I suppose?

Yup. It helps keeping things in perspective: we haven’t had a significant drop yet. If the fund is well diversified (how would I know xD), it’s also not the most volatile asset. Tech stocks/funds and cryptos would probably have triggered an exit, which could be interesting to study: have different sectors/markets/market caps to pursue and switch from one to another depending on momentum, as linked by @FunnyDjo .

4 months (including December 2020) is a short time and not meeting a trigger should be the norm so, all is normal up to now. It does mean we only have one curve to “compare” so it’s a bit boring until they differ.

I dont understand the attraction of this strategy. A simple 80/20 split that you rebalance will make sure that you are buying when the stock crashes - it seems to me that in this strategy you are barely buying into stock when they are crashing.

I think you got it backwards. I grin a lot when my portfolio crashes, because I can buy more at low prices.

1 Like

It bears a different risk/rewards profile than a balanced buy and hold strategy. They separate themselves most when we’re going through a lasting downturn.

When all goes well, a 80/20 or a more conservative split will sacrifice some returns (the 20 part, that underperforms stocks) in order to have a better behavior during downturns (less drawdown, more purchasing power). The in/out SMA strategies sacrifice some returns (false positives that will make me sell low and buy high) for downturn protection.

When the market goes down, the in/out SMA strategies should hopefully limit the drawdown in a significant way. Take the SPI from its peak on June 15th 2007 to its through on March 9th 2009.

Taking the SBI AAA-BBB as our bond index, rebalancing every end of month:

The SPI had lost 53% from its peak.
A 80/20 strategy would have lost 44%.
The 20D-4 strategy would have lost 28%.
The 200D-10 strategy would have lost 18%.

Change the indexes, the dates or the rebalancing method and the results change, of course. I’ve used the data I had easily available with the scenario I wanted to cover: they’re hand picked but it illustrates the use of these strategies when they go well: they significantly limit drawdowns.

For me, it makes a difference when considering the time horizon of the investment. It can make a difference when the unexpected makes money we thought we wouldn’t need, needed. It can allow to take advantage of good opportunities when blood is on the streets (crises usually have opportunities for those who are spared the worst of them). Or it can be leveraged to increase returns.

It is more complicated and requires more time and attention than a simple diversified allocation and rebalancing strategy, though, so being diversified, choosing an allocation that fits our need, ability and willigness for risk and buying and holding is still the approach I advise.

By the way, if people are tempted to implement these strategies to their own investments, please be aware that they’re handpicked to a specific indice (the SPI) during specific periods of time (2007-2009, 2016, 2019-2020). The numbers chosen won’t apply to other circumstances. Please, do your own assessment before blindly following the signals here.

Edit: with a graph of those scenarii, normalized, for the period, because I like graphs:

Edit 2: The buying doesn’t occur when stocks go down but, instead, when they start recovering. The timing can go well, or not. When it does go well, there should be more dry powder available to buy them on the cheap than there would have been with a traditional rebalancing strategy.

But these are paper losses. They are meaningless. It only matters if you are using them as pledge or against a loan.

If you are not, then what’s the point ? Why would you worry about your stock allocation going down 50%? It’s all paper losses,meaningless, and in 30 years you wouldn’t even remember this crash.

I simply don’t see the appeal of protecting against paper losses.

Is the total return consistently much better than compared to let’s say 100% stocks or 80/20?
Or is highly dependent on your filtering parameters?
Because being dependant on a couple of parameters adds a whole new layer of risk