Timing the market using moving averages - an experiment

@Wolverine you could register to the newsletter of Engineered Portfolio to receive update on when to rebalance your portfolio

They follow different strategies with goal to out perform the SP500:

You can also backtest a moving average or Dual momentum strategy on PortfolioVisualizer

That would take all the fun out of it. :wink: If the purpose was not playing with building my own strategy and pitting myself against the market, I’d pay a manager to do it. :stuck_out_tongue:

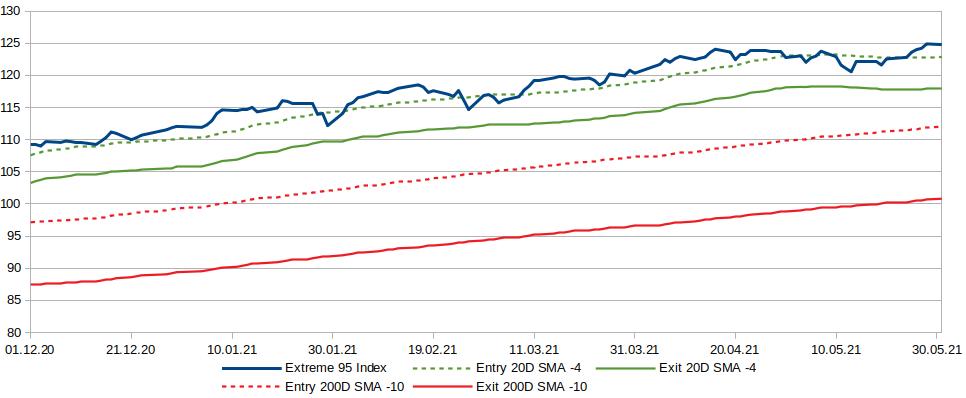
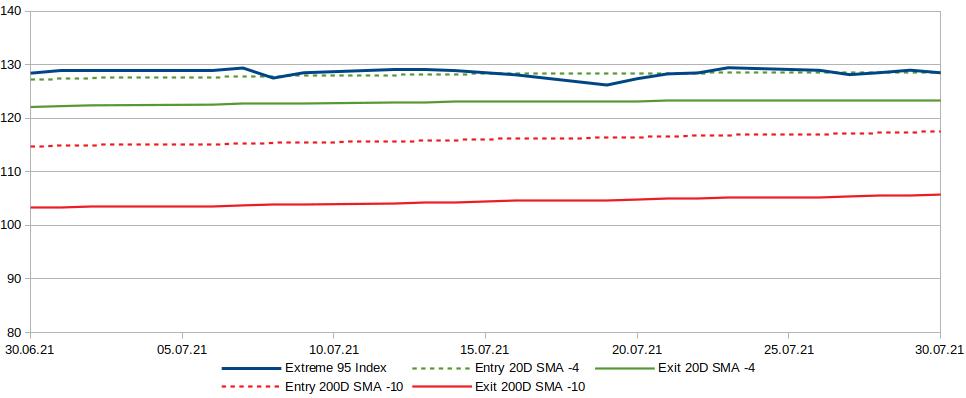
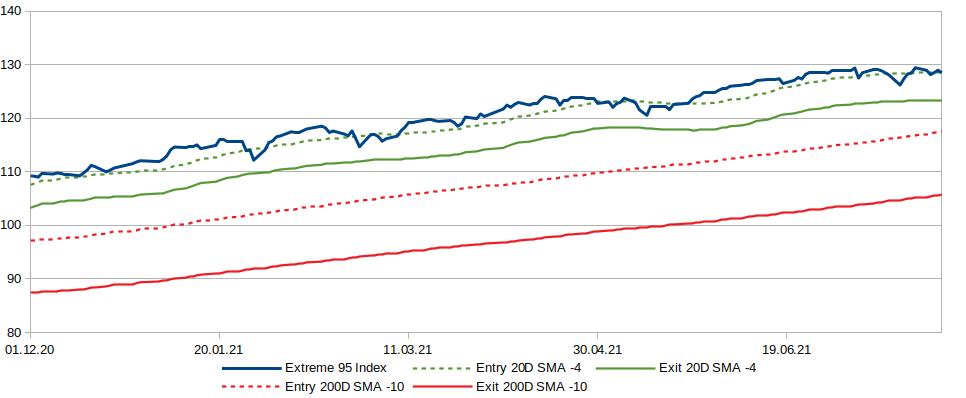
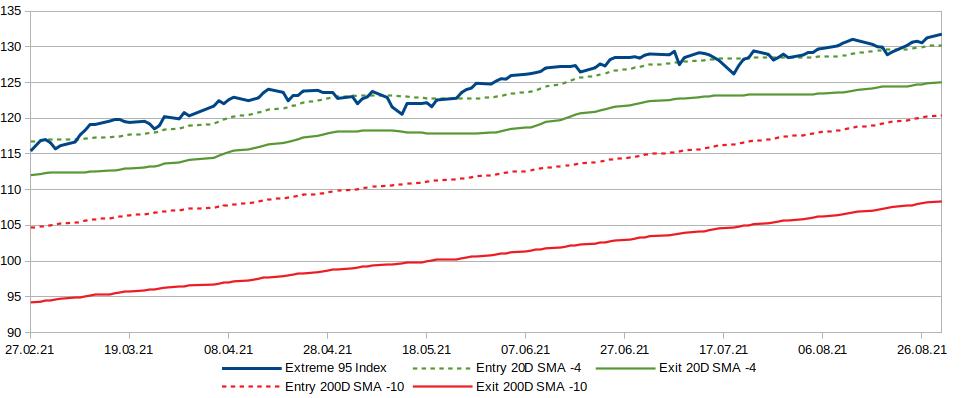
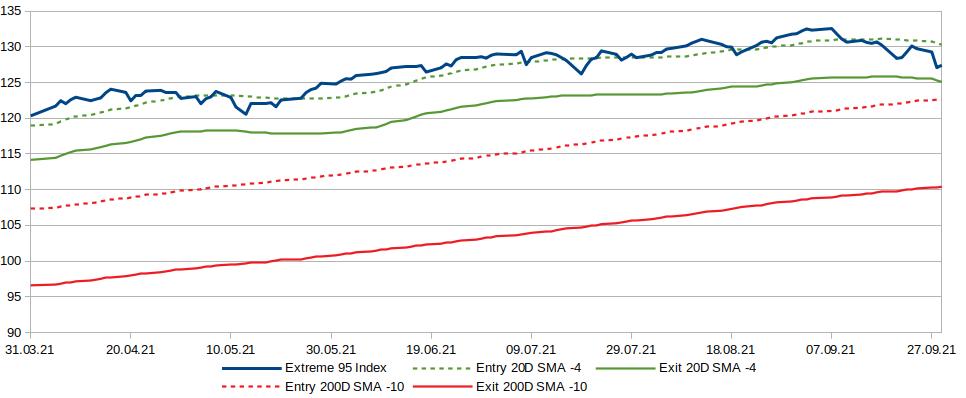
Edit: also, the cut taken on the moving average to shift it down is a core part of why I’m confident in this strategy. I’ve yet to find an automated tool that allows for this parameter.

If you can shrug it off, indeed, a portfolio of broad, diversified assets and a buy and hold strategy is all you need. I think we mainly agree on that and on the concept that the optimization must not be financial only, but that freeing our mind and time for other activities is a huge plus that allows for a better life.

Time is precious. We shouldn’t waste it chasing profits.

Not everybody is an accumulator, though. The GFC (Global Financial Crisis - 2007-2008) lasted 2 years, those who lost their job during the first hit to the financial sector went out of unemployment benefits during the crisis, when finding a new job wasn’t that easy. Meanwhile, those who had available money could buy real estate on the cheap as the prices crumbled down.

For me, part of this is entertainment. Part of it is rising up to the challenge after being a bit bored of reading again and again that you can’t time the market and that even if you get your exit right, you still have to re-enter at the right point. I’m under the impression that the people having these discourses think that, in order for a market timing strategy to work, you have to exit at the exact peak and enter at the exact bottom, everytime.

That’s not my belief. For me, for it to work, you have to make it somewhat predictable and working most of the time while fully acknowledging what can happen when the timing is wrong. This experiment also aims at either affirming my belief or help me craft the belief that I can’t, indeed, time the market and that buying and holding is the best strategy for me. Tinkerers gotta tinker. I am a tinkerer, I need to experiment by myself and get burnt from time to time to learn and flourish.

By itself, I would not expect anything more out of it than reduced drawdowns. If it works, it can be paired up with lombard loans, inverse ETFs, derivatives or other kinds of funds or assets to boost the returns, in which case, I’m confident it’s possible to overperform though it’d be time consuming and probably not very scalable. It’d raise a bunch of tax issues in Switzerland, too (use of leverage, holding periods, use of derivatives, amount of returns).

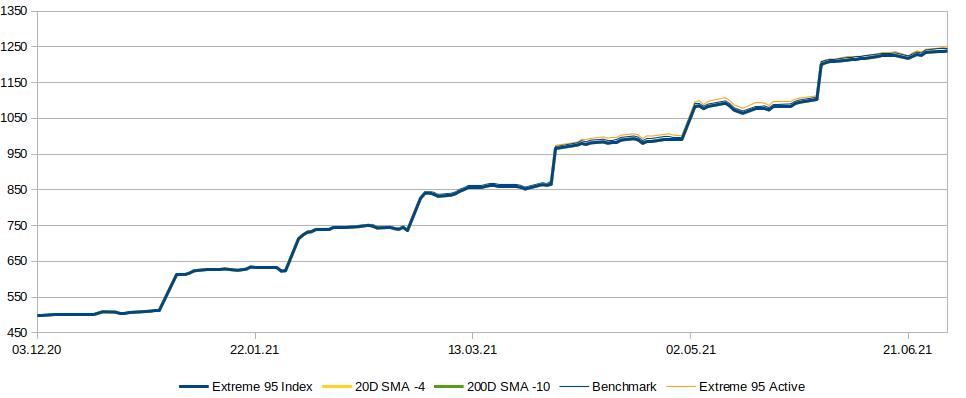
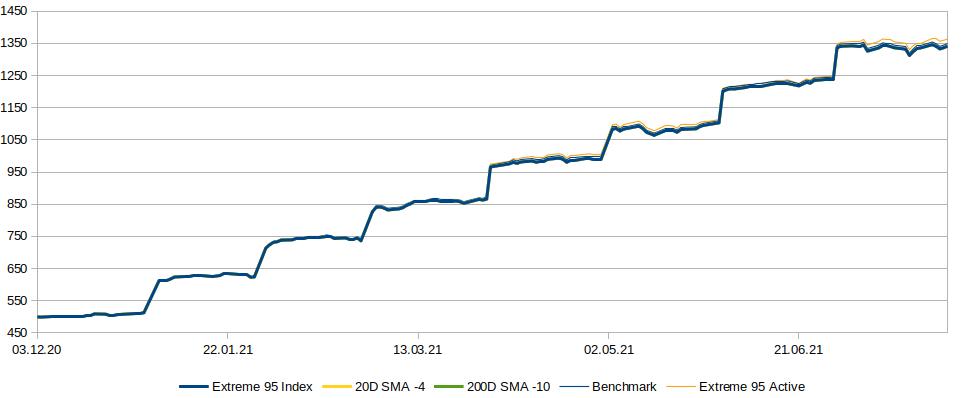
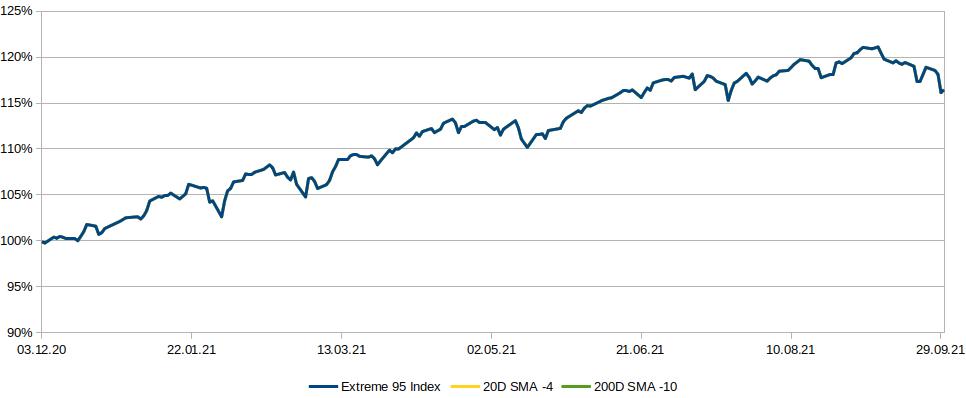
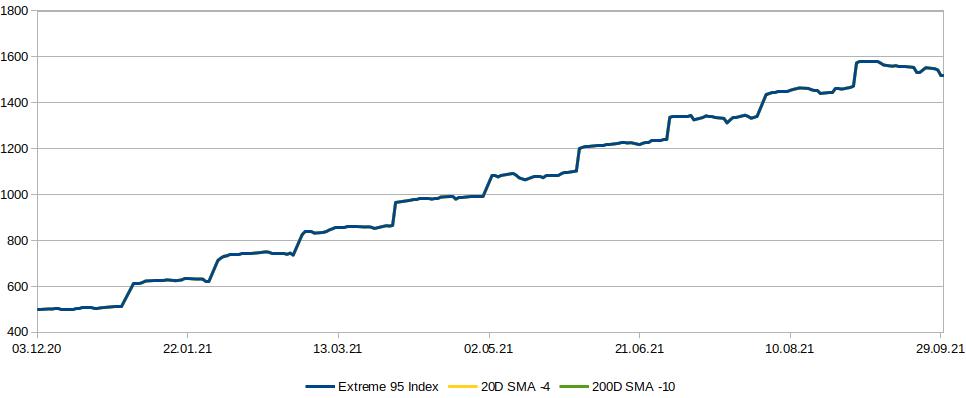
It is highly dependent on the parameters chosen, which, as you note, raises a different layer of risk. I’m confident the behavior of the Extreme 95 fund is close enough to the SPI (or S&P500-like) and that their behavior shouldn’t change drastically in the near future, so I’m confident the retrofitting I’ve done should work in a relatively satisfactory fashion for the coming times. I have to stay aware and may have to adapt it if the conditions change drastically. I’m confident it’s relatively sturdy, though, we’d be speaking Bitcoin-like volativity or anti-stocks legislation for the parameters to fall completely off track, in my opinion.

1 Like

Is now ten years that I looked into investing.
My realization for these kind of strategies is that they are far more difficult to keep going consistently than buy and hold. I still have to meet somebody who has kept the same moving average strategy over 10 years without fiddling around. First time there is sideways market with some sawtooth behavior they inevitably panic and start changing strategy. I’ve read uncounted thread of people reporting…and after some years and crashes they stop.

7 years ago i started simply buying VT and stopped looking at the share price, indexes whatever.
Psichologically? Way less stressful than any momentum based strategy.

Believe me, in 10 years you are not going to be following exactly the same strategy, same parameters, that you are following now. And if you are not…then it’s pointless to start :wink: because it may only works if you are exactly consistent. Which in certain situation is very stressful.

Just my 2 cents.

5 Likes

Well I’m actually following a moving average strategy since around 2015 and I’m quite satisfied with it.
Manly following the approach suggested by Meb Faber in his book Ivy Portfolio and also tracked monthly by dshort site: https://www.advisorperspectives.com/dshort/updates/2021/03/31/march-moving-averages-up-4-2-from-february

Btw my rationale behind the strategy is more to reduce the max drawdowns and allow myself to be fully invested in stock knowing to have a plan B if things goes south.

Nice thread, will follow it!

3 Likes

Not much to say for April. I’ve replaced the active 75 indicator for an active 95 one now that there’s one. As a reminder, this isn’t relevant to the strategies themselves but with Frankly, active strategies bear less fees and have less delays for moving funds, so if a 3 days delay to move money out and in of the passive fund ends up being too much, I may switch to the active fund.

April 2021

Since December 2020

Real Data

Mood: this market feels invincible. For a bear like me, that feels like a capitulation moment that could relate to a market top. I’m glad I’m not stuck trying to figure out what to do with it and to be invested instead.

April 2021 returns (all strategies): 2.61%
April 2021 max drawdown (all strategies): -1.3%

All time compound monthly returns (all strategies): 2.5% (annualized: 33.5%)
All time max drawdown (all strategies): -3.3% (January 21 to February 1st 2021)

YTD total returns (all strategies): 10.12%
YTD max drawdown (all strategies): -3.3% (January 21 to February 1st)

We’re already 1/3rd of the year down the road and still on track for a 30%+ returns year. I’m starting to think we’ll make it (which is, of course, dangerous thinking: there’s still a lot that can happen).

Just to make sure I do it properly, what are you wanting to be displayed?

My benchmark is the “Swisscanto (CH) Vorsorge Fonds 95 Passiv -VT CHF-” fund/share class.

The strategies haven’t yet triggered and all I’ve done so far is invest in that fund for a few months. The differences in returns come from:

  • The fixed management fees of Frankly.

  • The issue and redemption fees in favour of the fund that apply whenever shares are bought/sold.

  • The part of the money that isn’t invested (there are always of few cents staying on the sidelines).

  • The opportunity loss of having new money sitting in cash for 3 days when it gets invested.

Should these be counted as part of the benchmark (in which case, the “Extreme 95 Index” strategy would be it, since this one will only be buying and holding fund shares with all the fees that it implies) or do you want them to show in the time-weighted performance of the strategies?

Thanks, that will probably be included in the first graphs once there’s a difference between B&H and following my signals. I’ll switch to log scale a bit later, I like the normal scale for the early stages.

So, leaving alone the 3a part of this experiment, would you suggest also plotting a few indexes for comparison? I wouldn’t know which ones to chose but I guess the swiss SPI and FTSE Global All Cap Index (used for VT) could be a start.

What made you stop in 2015? Another use for this money/other funds to invest in or getting bored with the time spent on it? You did catch that 2008 crisis quite well, congrats!

I wasn’t convinced by Wolverine’s idea until I saw your chart. You are right you will miss some big up days but you missed the big downsides whilst still participating in some of the gains. Perhaps the approach has merit when you transition from the “wealth accumulation” phase to “wealth preservation”. Historically the approach was to rotate from stocks to bonds but not sure that works right now

Sorry, I’m a bit late. Nothing happening, still sturdily keeping being invested. I haven’t felt the need for a time-weighted comparison graph for now, it’ll probably happen later on.

May 2021

Since December 2020

Real Data

Mood: nonplussed.

May 2021 returns (all strategies): 1.13%
May 2021 max drawdown (all strategies): -2.58%

All time compound monthly returns (all strategies): 2.2% (annualized: 29.5%)
All time max drawdown (all strategies): -3.3% (January 21 to February 1st 2021)

YTD total returns (all strategies): 11.36%
YTD max drawdown (all strategies): -3.3% (January 21 to February 1st)

June has been a very smooth month with steady and nice returns. We’re still on track for >30% returns this year and we’re through half of it.

June 2021

Since December 2020

Real Data

The logarithmic scale doesn’t seem to make sense yet, the second graph can be taken as a proxy for the time-weighted behavior of my investments. Adding one more graph for it will probably start making sense when the strategy will diverge from the benchmark.

Mood: happy with my gains.

June 2021 returns (all strategies): 2.99%
June 2021 max drawdown (all strategies): -0.72%

All time compound monthly returns (all strategies): 2.3% (annualized: 32.0%)
All time max drawdown (all strategies): -3.3% (January 21 to February 1st)

YTD total returns (all strategies): 14.69%
YTD max drawdown (all strategies): -3.3% (January 21 to February 1st)

1 Like

Some volativity reared its head again in July but it’s still very tame and nothing got near to ticking a trigger.

July 2021 (triggers)

Since December 2020

Real Data

Mood: pretty nonplussed.

July 2021 returns (all strategies): 0.21%
July 2021 max drawdown (all strategies): -2.44%

All time compound monthly returns (all strategies): 2.1% (annualized: 27.9%)
All time max drawdown (all strategies): -3.3% (January 21 to February 1st)

YTD total returns (all strategies): 14.92%
YTD max drawdown (all strategies): -3.3% (January 21 to February 1st)

6 Likes

Hello Wolverine,
thanks for keeping up with this interesting trial.
No clue how many others are following your thread, but I am a big fun of it. Do not stop please :wink:

3 Likes

good experiment. I’ve opened my finpension 3a on the 3rd January this year (February to August) and it’s up 21.5% (mind blowing for a pension product) with an 80% allocation of MSCI Quality US blue chips and 20% allocation of CH blue chips.

Waiting for the storm, I guess :slight_smile:

Not planning to, though I’ll probably change the graphs next time to better reflect what I want to show, now that I have a better grasp of it.

As am I… as am I. It could still go up quite a bit, or even never come down. I stand by my principle that whenever in doubt, being in the market is better than being out.

It may be a good time for the friendly reminder that there are no magic bullets and this could just turn into being a way to melt capital away. :slight_smile:

2 Likes

August has been a good month. My general feeling about the market is that whales are battling whales and someone is buying the dip as soon as someone tries to slowly dump their assets. We’ll see how this goes.

As stated last time, I’m changing my graphs a bit. It’s still too early for logarithmic scales and it will be a bit bare for now, all strategies following the same curve but hey! That means stocks are going up so I’m not going to complain. :slight_smile:

Triggers
I’ll be displaying the last 6 months here, from now on, less isn’t very evocative and I don’t have one year yet.

We didn’t get even close to a trigger.

Time-weighted returns

Real data

Mood: happy with my gains, excited to see what’s awaiting forward

August 2021 returns (all strategies): 2.19%
August 2021 max drawdown (all strategies): -1.64%

All time compound monthly returns (all strategies): 2.1% (annualized: 28.1%)
All time max drawdown (all strategies): -3.3% (January 21 to February 1st)

YTD total returns (all strategies): 17.43%
YTD max drawdown (all strategies): -3.3% (January 21 to February 1st)

2 Likes

September has been the first down month since I’ve started this experiment. If anything, it’s been an illustration of the value of diversification: Frankly Extreme 95 Index is holding its own with roughly:

25% Swiss LC+MC
5% Swiss SC
45% Developed ex CH LC+MC (37.5% hedged)
10% Developed ex CH SC
10% EM
2.5% Gold
2.5% RE.

We’ve still got a ways to go before meeting a trigger. We may get there in the future, who knows?

Triggers

Time-weighted returns

Real data

Mood: curious to see what happens.

I must admit that I’m way more following market news since this has started, which would normally not be necessary, so it’s a time consuming hobby that may take more of my peace of mind than I’m truly realizing. My current job situation leading to a very agressive risk assessment (my assessed need to raise capital quickly exceeds the risk of loosing already accrued capital) may have something to do with it too.

Septembre 2021 returns (all strategies): -3.28%
September 2021 max drawdown (all strategies): -4.11%

All time compound monthly returns (all strategies): 1.5% (annualized: 20.0%)
All time max drawdown (all strategies): -4.1% (September 8 to September 29)

YTD total returns (all strategies): 13.60%
YTD max drawdown (all strategies): -4.1% (September 8 to September 29)

We may finally be getting to a drawdown deeper than 5%. Time will tell.

3 Likes

shit is getting real! :smiley: it’s exciting to see if the trigger will make you dump everything at the end of the slide, before it goes back up (Murphy be damned).

Fun story: my personal risk assessment is that I need to take on as much market risk as I can in order to shorten the time during which I’m low on money and very dependant on my job for short term financial stability so, I’ve used this strategy to invest my emergency fund, on the assumption that it would have some protection against drawdowns and be mostly available should a real emergency occur.

It was invested in UBS ETF (CH) SPI (CHF) A-dis (SPICHA) : https://www.ubs.com/ch/en/asset-management/private-investors/funds-prices/product-details/ch0131872431.html

Swiss stocks are having a bigger drawdown than the rest of the developed world (because of more chinese exposure, I guess?) so I went out on a spike down. It keeps going flat or up ever since and I’m very close to having to get back in at a loss. It’s interesting to see that I really don’t want to, because I presume swiss stocks may go back down shortly and I’d pay fees twice for nothing. Already thinking of tinkering with my trigger to get back in in order to make me stay out when the market is flat, even though the trigger to get back in was the one I was the most confident about.

I think I’ll keep it all as is and just follow the signals but human psychology is a funny territory to wander in.

On a side note, I’m not yet sure getting risk on was the right call as I envision more and more some flatish times for the market. My reaction seems to have been mostly greed driven, which is starting to slightly hurt, as it should. It’s a good thing I have very little to loose (few investable assets) and my current returns won’t mean much in the bigger picture.

Fun times.

Side note squared: the fund used for this experiment has still a good way to go before triggering anything, diversification really is something. :slight_smile:

1 Like

Done.

Getting back to basics, the strategy is designed to limit drawdowns, be resilient to small drops and quickly get invested again when out of the market. My basic philosophy was/is “when in doubt, be invested”. It has fulfilled all 3 of these criteria. Thinking again of my backtests where I had willingly accepted false positives in order to get the protection I wanted against larger drawdowns helped.

It’s interesting to note that I was actually glad that the market was mostly declining softly, avoiding triggering the exit and would have prefered staying invested. On the up way, I was diappointed that the upper trigger was getting near and would have prefered having a reason to stay out.

I guess I don’t like the uncertainty that comes with acting on a trigger and the subsequent period of vulnerability during which the market can make a u-turn and recover/go back down.

Also of interest is that I did regret not using the opportunity to invest on the way down, lowering my cost basis. I’d advise buying and holding as the superior strategy for people with only few assets, like me (where new inputs have a bigger impact than the performance of the portfolio already invested).

All in all, a nice learning experience and a cheap lesson. Looking forward to have some more. :slight_smile:

1 Like

Reading up and now I am still confused as to what happened…
Did your thresholds finally cause a trigger?
Did you sell?
And you stayed out of the market because no upward signal was triggered?