Timing the market using moving averages - an experiment

Hello, thank you for sharing this experiment.
If you want to make more than an annual report, feel free to do some per quarter.

Sorry, I’ve expressed myself poorly. Updates will remain monthly, the only thing that will change is the “all time compound returns”, which will be p.a. and not monthly anymore. For some reason, this appeared to me like “a lot of data”…

Enjoy the ride!

3 Likes

This 1000%
Stopped looking at the market in 2015. Just drop money whenever you have it and keep an eye on assett allocation

6 Likes

And one year in.

Triggers
Moving to a one year display length:

We’re getting close but we’ve been there before. Could go down, could bounce back up and rise some more.

Time-weighted returns

Real data

Mood: excited by the smell of opportunity.

November 2021 returns (all strategies): -0.74%
November 2021 max drawdown (all strategies): -3.95%

All time compound returns p.a. (all strategies): 19.2%
All time max drawdown (all strategies): -5.18% (September 8 to October 5 2021)

YTD total returns (all strategies): 17.87%
YTD max drawdown (all strategies): -5.18% (September 8 to October 5)

1 Like

Volatility is back, baby!

December has been a good month, and 2021 has been a very good year. Nothing hitting a trigger though there have been 2 closer calls, so not much to say for this strategy for the time being. I’m not complaining.

Frankly’s Extreme 95 Active solution is nearing the 200 days of history and I’ll be switching to it during January, mainly because it seems to behave “passively” enough (in that it does follow the main market movements) and for the 2 days delay to buy/sell shares vs 3 for the passive solution. I’ll create a post for that in about 2 weeks so don’t be surprised when it comes.

Triggers

Time-weighted returns

Real data

Mood: nonplussed, we’ll see what next year brings.

December 2021 returns (all strategies): 2.57%
December 2021 max drawdown (all strategies): -2.35% (9.12 to 21.12)

There has been an intermonths drawdown of -5.06% between November and December (17.11 to 06.12)

All time compound returns p.a. (all strategies): 20.4%
All time max drawdown (all strategies): -5.18% (September 8 to October 5 2021)

2021 returns (all strategies): 19.25%
2021 max drawdown (all strategies): -5.18% (September 8 to October 5)

4 Likes

Alright, I have 200 days of data on the Extreme 95 active solution from Frankly. A comparison of the Active vs Passive versions of the Extreme 95 solution during that timeframe below:

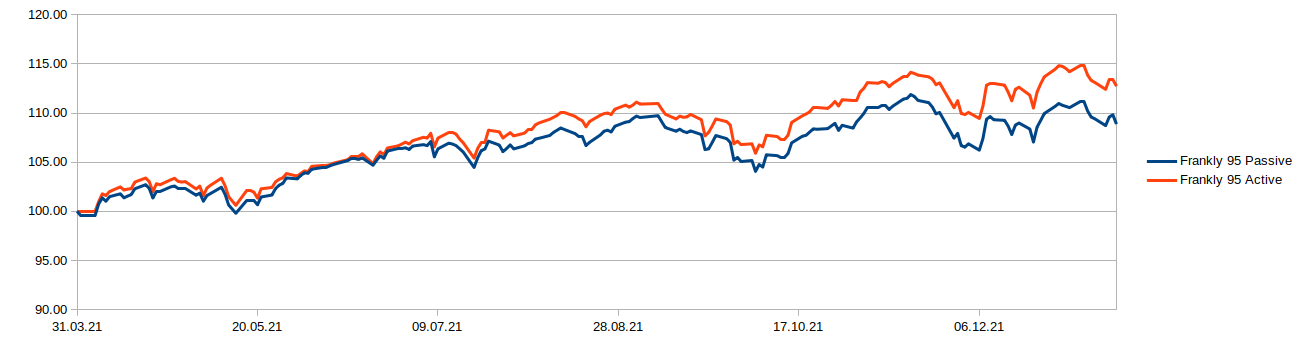
As stated previously, the active version behaves “passively” enough, in that it follows the mains ups and downs of the passive version with similar shapes. My guess is that they’re using the same funds but weighting them based on their expectations. The outperformance is absolutely not guaranteed but it incurs less fees (no buying or selling fees, small though they are for the passive strategy) and, above all, allows for quicker buying and selling of shares (2 days vs 3).

I’ve initiated the change of strategy tonight and will be out of the market the coming days as the shares are sold, then bought.

Well folks, this is it!

The exit curve of the 20D SMA -4 strategy has been crossed.

On the right of the black dashed line is when I’ve started tracking the Extreme 95 Active solution rather than the Index one. Moving averages have been adapted accordingly (the curves under the Extreme 95 Active curve derive from Extreme 95 Active data).

September felt like it was it but we rebounced. November was more of a meh in my head, it seems that going flat with volatility finally caught the more reactive strategy (20D SMA -4, as opposed to the slower to react 200D SMA -10).

We’ll see if stocks keep dropping or if we have a false positive with a rebound. I’m a bit anxious I’ll not manage the orders to get the funds into cash properly, we’ll see how that goes. For better or worse, we’ll now see a difference between one of the strategies and the benchmark.

Mood: pretty nonplussed, actually, I’m becoming somewhat numb to this.

Edit: Hey, buying and selling shares manually is actually very easy and intuitive. Kudos to those who designed that user interface and validation process! :smiley:

8 Likes

Well, if it keeps going up, I’ll have timed the bottom perfectly! :smiley:

Triggers

Time-weighted returns

With a spawn of 1 month for better view of the different outcomes (as of now):

Real data

Mood: pretty amused. Watching things too closely makes you focus on some events over others, picturing yourself as the worst market timer. Clouds, stocks, same thing.

Jan 2022 All times (p. a.) YTD
Extreme 95 (Bench.) Returns -5.1% 13.6% -5.1%
Max DD -6.9% 04.01 - 26.01 -7.4% 17.11.2021 - 26.01.2022 -6.9%
20D SMA -4 Returns -6.4% 12.2% -6.4%
Max DD -6.9% 04.01 - 31.01 -7.4% 17.11.2021 - 31.01.2022 -6.9%
200D SMA -10 Returns -5.1% 13.6% -5.1%
Max DD -6.9% 04.01 - 26.01 -7.4% 17.11.2021 - 26.01.2022 -6.9%

I’m switching to a table display for ease of use. Let me know if you like the text version more (or would like the table as a picture with negative numbers in red. It’d be pretty red, then. ^^)

Try shortening text strings wherever you can, table gets hard to read on (my) mobile.
(e.g. January → Jan or 1; drawdown → DD etc.)


So IIUC your model triggered the sale (but not the rebuy yet)?

1 Like

Better? (I’ve edited it.)

Also, yes, sales triggered, no re-entry for the time being. The strategy is biased toward reinvesting quickly rather than staying on the sidelines, we’ll see if that was a good idea. ^^

If we’re going that way, I’d say the “problem” is diverging from simply taking the market’s returns and being done with it: you never know what you’re going to get. It could have protected my downside, and it still can, so there is that. I’ve been told the hard part was sticking with the strategy false positive after false positive, I’m willing to believe it. :slight_smile:

It’s still a low amount of money, and it’s still probably not worth it vs keeping buying on the way down and up, at cheaper prices. The later seems also better for my peace of mind (not very worried but I’m probably giving this more focus than it’s worth).

Edit: for outside watchers (I’m sure @TeaCup knows this): this is expected behavior; volatility on the way up and down is normal, markets rarely go down or up in a straight line.

1 Like

And back in we go!

Frankly provides data only for the day before (so, today, it’s the price from Wednesday, February 2nd that is available), so I expect a down day tomorrow. It’s a bit disconcerting for me to act while expecting the downward trend to resume but I have to recall that one of the purposes of this design was to avoid any kind of need for predictions and/or thinking, so I’m biting the bullet, taking the loss and following the signals as they come.

That’s a 3.9% loss so far on the 20D-4 strategy when compared to buying and holding.

Also, some weird thing happened and there is now a slight difference in value for the benchmark strategy and the 200D-10. No idea what has happened but I’ve had display glitches with Frankly before so it may sort itself out tomorrow.

Mood: strangely enough, it’s kind of reassuring to see this kind of volatility while companies post earnings (Damn you, Alphabet! I would have gotten away with this too if it wasn’t for meddling children and a search engine!). I take it as meaning that price discovery is still active and we are not in a full on insanity market. I’m taking solace in that.

2 Likes

anything interesting is happening in the.movong averages in these days of 4Q results and (almost) war in Ukraine?

It’s actually interesting: we’re in slow bleed mode. It’s starting to look probable that we’ll cross the exit point of the slower to react strategy before the quicker one.

Another thing I’m starting to realize more thoroughly is that the quick to react strategy actually doesn’t offer reliable downside protection: it’s actually lower than buy and hold right now, and can trigger more false positives in the future, meaning that the market can actually go slightly up, and my strategy go down to zero. I had targeted something like a max drawdown of 8-15% when designing the quick reacting strategy, it was overly optimistic. We could easily go to a drawdown of 14% now, and it could get lower from there.

What this shows to me is that it’s one thing to plan and prepare for something and another one entirely to live through it, which is also part of why I’m conducting this experiment: to have better insights on my own psychology in regards to investing. It’s not taking a toll for the moment, I’m pretty much nonplussed, but I’ve also lost the apetite for random triggers just for the sake of it.

We’ll have to see what happens going forward but at this point, it seems like another way to have a risk/rewards profile potentially similar to buy and hold (meaning the downside protection and potential for more, or less, upside depends a good deal on luck and random patterns) with the added stress of having to look at the markets daily (or automate it but I wouldn’t feel good with automated trades). I’m starting to see the real power of buying and holding, which is the set and forget part of it. More energy for the meaningful things in life while still reaching financial success in due time.

Edit: putting an added thought here: I’m just back from a week in the Jura where we’ve done orienteering in the snow. One thing I’ve noticed is that I had a tendency to, at times, want a path to be the one to take and would then experience confirmation bia, seeing only the clues leading to that path being the right one, while neglecting those showing that “hey man, we’re not in a carebears world, yes, the path leading up the slope is the one leading to your target point”.

I had to fight it actively and ponder each time a decision had to be made whether it relied on all the information I had available or if I was using confimation bia to get the result I wanted. I think the same holds true for investing: it’s easy to get lured by ideas and see only the good points of them, then, when faced with reality, consider that reality is at fault for it. Keeping an open eye on the situation and staying honest with ourself requires active attention, market participants do what they do, and it’s very hard to predict. The markets can go up when all the signs we see point to down, it can seesaw for some time with participants apparently getting out and in and out and in and it is normal. Market participants will do what they want and that will make prediciting the market a vain endeavour. Expecting a certain set of results on the short term, even when backed by a lot of concurring indicators, is bound to get frustrating.

7 Likes

interesting situation from your graph. let’s see how it will evolve.

indeed, I guess that the major benefit of this experiment was for you the learning on how you truly are as a investor, and finally as a person.

if you continue with this experiment, please be sure that you at least a fan following you :slight_smile:

5 Likes

A quick reminder of my bias:

The 20D-4 strategy is meant to be quick to exit the market, and quick to re-enter. It is based on the assumption that “when in doubt, be invested”. It has triggered once so far and is currently underperforming the benchmark (buying and holding the same fund).

The 200D-10 strategy is meant to be slow to exit the market, but be decisive when it does. It hasn’t triggered so far, though for unknown reasons, my last investment in this strategy and the benchmark happened on a 1 day delay, so that there is a very slight difference in favour of the 200D-10 strategy as of yet (which is in no part due to the strategy itself).

That being said, things are starting to be interesting.

Triggers

We went real close to triggering an exit on the 20D-4 on Friday, but it didn’t by a hair and has now rebounced a bit. It could get triggered again any day now, or not. I’m not willing to take bets.

We still have a ways to go before triggering an exit on the 200D-10 strategy.

Time-weighted returns

The miss on the 20D-4 is visible.

Real data

The difference seems less impressive. I’m not too disapointed for now, this was bound to happen.

Mood: too much money sitting on the sidelines ready to get in or out on a whim. Can’t wait for central banks to actually tighten and reduce that amount, hoping it would lead to the market to make some kind of sense once again.

New display for the numerical data. Let me know if it’s better than the last. TW stands for time-weighted, CAGR is all times compound annual growth of returns, Max DD is max drawdown:

20D-4 200D-10 Bench.
TW returns
CAGR 9.1% 11.0% 11.0%
February 22 -1.9% -0.9% -1.0%
YTD -8.2% -6.0% -6.0%
Max DD
All times -11.3% -9.2% -9.2%
February 22 -5.9% -5.9% -5.9%
YTD -10.8% -8.7% -8.7%

The underperformance and failure as a downside protection in this specific case is apparent.

And that’s it for today folks! Have fun and don’t blow all your money on luck reliant strategies. :wink:

3 Likes

An additional thought: I find interesting to note that while the value of the shares of the fund have globally gone down, all 3 strategies are invested right now. My own sentiment was toward more downard pressure up until yesterday (and I’ve acted on it with other invested money I don’t want to loose). I am now considerably less convinced and think we may have hit a bottom, or not (in short, I don’t know, while I previously thought I might have an inkling, which might very well have been a mirage).

What I’d like to note is that even though my sentiment has changed, I am not willing to act on it (with my other funds, not in this experiment, which is set and will follow the rules I’ve stated at the start). I’m mainly resistant to change. I don’t mind too much being invested or not (for now, as the amounts considered are still low) but I do mind selling or buying with the lot.

Once out, getting back in is psychologically more difficult (for me), I imagine it gets worse the longer we stay out. Once in, getting out also becomes psychologically more difficult.

2 Likes

Aaaaand… here we go again. We were over the bar by 3 cents yesterday, the exit trigger for the 20D-4 strategy has been crossed today.

Either we rebounce next, or we’ll cross the 200D-10 exit trigger too.

Mood: pretty nonplussed.

1 Like

:smile: Back in we go! It didn’t take long, I must say. It’s looking like another net loss for the 20D-4 strategy.

Mood: Confident in the future (my bet is the markets should move up and no trigger get hit in the coming weeks).

2 Likes

March report and things are getting serious. There has been a big miss on the 20D-4 strategy, which is now greatly behind the other ones who have just bought and held so far. To be transparent, I’ve had some doubts about the sense of this kind of market timing during the month, especially when comparing the time spent following the market’s movements vs logging in once a month to buy with available funds and then hold forever.

These are just a set of circumstances, though, so there’s plenty of time for me to change my mind in the other direction going on if some big downturn happens and I get scared with my invested funds. Even if I fully stoped believing in the strategies I’m using here, I think the experiment would be worth pursuing, be it only to illustrate how vain this endeavour is.

On the other side of the coin, I went into this believing that keeping on despite false positives was the hard part, so I’ll just shrug this off and keep on. I’m curious to see where this all is leading.

Triggers

March was a continuation of the previous drops at first, then an awesome recovery from the 10th onward, starting right after the exit trigger of the 20D-4 strategy was hit, provoking a magnificent rebound right when I went out, without fail. It’s true that it’s hard to time the bottom, because the recovery can come quickly. I’d need a significantly bigger drop for one of these strategies to shine.

Time-weighted returns

Can you spot the laggard? :smiley:

Real data

The difference is significant, though a bit less visible. It’ll compound from now on.

Mood: welcoming the learning experiences: this enlightens my other investments. I have considered switching strategy toward a more buying and holding-ish one with my taxable investments at some point.

20D-4 200D-10 Bench.
TW Returns
CAGR 7.6% 13.0% 13.0%
March 22 -1.1% 3.5% 3.5%
YTD -9.2% -2.7% -2.8%
Max DD
All times -14.1% -12.1% -12.1%
March -5.5% -5.5% -5.5%
YTD -13.7% -11.7% -11.7%

The max drawdown has increased in March as it goes from November 17 2021 to March 9 2022. It could go deeper still yet previous gains were good enough that the annualized returns are still attractive.

As stated before, the 20D-4 strategy does not guarantee a downside protection and could keep falling lower than the other two in the future.

7 Likes

As an additional personal trivia: an observation I’ve made is that since I’ve started this thread, I’m trying to anticipate the direction in which the market will be moving. While I’m for the time being not too wrong about it, it appears that by the time I’m feeling confident enough to act on it with other investments, other market participants have already acted and it’s hard to make money trading on it.

It’s true that it’s not enough to be right, but that one has to be right before the others. It turns out there’s a reason the proper time for action would be when I’m not yet confident enough so I have to either decide to gamble and act without confidence in my bet, or accept that I’m not quick enough to beat the market.

It’s not intuitive. I really had to experience it to realize that, yes, even when being right and pretty early, it still already is too late to benefit from it. I encourage those who feel they could beat the market to launch a small experiment with a small amount of funds and use it to act on their predictions/beliefs while comparing it to the market performance. It’s been enlightening to me.

6 Likes