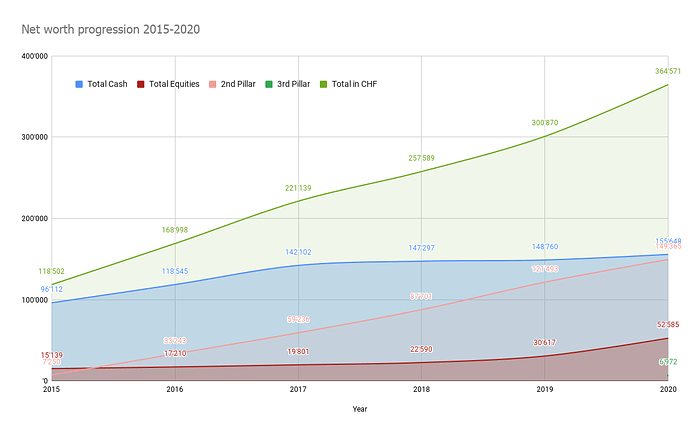
Going with the flow, I’m was a bit nervous about doing this but it revealed some insights. For instance, I was an idiot for keeping so much cash. I knew at heart it was far from ideal but our situation was complicated until very recently. There are some anomalies which the graph doesn’t show, for instance in some years I received tax returns for two years at once.
The data has been plotted with values from year end, taking into account EUR.CHF closing exchange rates. I started my 3rd pillar only on the second half of 2020 so it’s barely visible as a blib at the end of 2020.
I have more granular tracking for the cash in YNAB. I also started tracking the 2nd and 3rd pillars as well as equities monthly end of this year. Hopefully next year there’s an easier way to use those data points.
Some lessons learned:
- keep on converting cash to equities - should I even pick up the pace?
- my 2nd pillar is a significant (way more than I thought) portion of my NW
- between 2015-2019 I didn’t really manage or even actively invest in my portfolio at all and it shows
- this was kind of therapeutic so I might contribute in the “Pants down - yearly spending” thread too.
Luckily our uncertainty issues should now be behind us and I can continue what I did in second half of 2020.
Edit: the cash position should be about 20k higher. I forgot one account when generating the report in YNAB. NW is therefore a shy of 390k.
