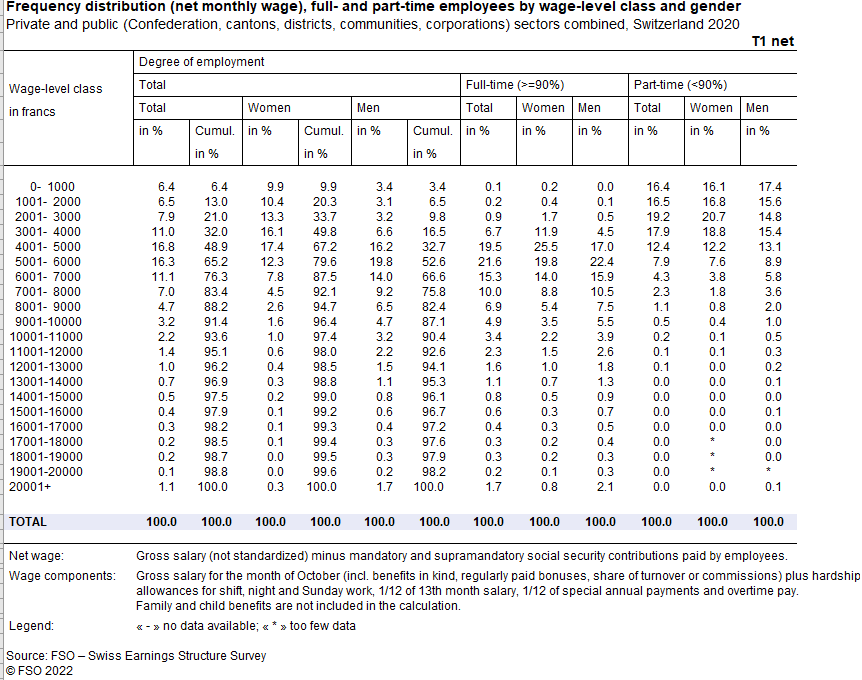
To keep the discussion about salaries in Switzerland, if anyone is interested. Based on the data from BFS, we can come up with some gross numbers. As the numbers are net, for simplicity lets assume that 88% gross = net (the older, the higher the deductions for 2nd pillar). We should also ignore part time salaries and focus on full time salaries (>=90%). So gross:
50% earn up to 82’000 (median salary in CH)
65% earn up to 95’000
75% earn up to 110’000
85% earn up to 135’000
90% earn up to 150’000
95% earn up to 205’000
98% earn up to 275’000
Would be interesting to understand whether these are for standard employees or also for company owners. I have the feeling that most 1% are in the latter category.
Is this for individual income or household income?
I always assume this data is a bit deceiving and there are more high earners than these metrics show for reasons like:
Tax evasion (all those businesses that take tons of cash and then claim they only earn chf50k)
Working as a contractor/self-employed/business owner when you start earning a decent rate and being paid as a company so having lower taxable individual income
The very wealthy living off capital gains
The retired living off of capital gains and limiting pensions/annuities to stay at lower tax rates
The many who choose to work part time (shouldn’t compare them to 100% workers imo)
If this is net data then high earners paying back 2p gaps pre-retirement can be disgusting savings on net
Rural earners included - maybe personal to me but my frame of reference is workers in a Geneva/Zurich so comparing to someone living in a 500k house in Jura is going to add a skew
UN/NGO workers in Geneva who don’t pay tax and won’t report income
Also net->gross should scale with income? e.g. at 242k->275k at 88% is more like 60% in Geneva or maybe 65% across Switzerland = 372k for 98th percentile.
It has been reported a couple of times that 350k gross (all-in for an individual) is the 1% threshold in Switzerland, although I don’t find a good source on the spot (and there can’t be, Switzerland doesn’t publish that data). With 5.25 million workers, there are therefore at least 50’000 people earning that much.
Assuming 88% net of gross pay is definitly wrong, as this skewes much lower with age and at higher incomes (higher share of 2nd pillar to avoid income taxes), probably for the 1% close to 80% (at least that is what efficient setups allow).
I also don’t believe that company owners dilute this data that much. True (100%) owners pay themselves only as much as needed in salary for tax and social security efficiency reasons.
These stats are based on a survey, other statistics are based on taxes data.
As mentioned by @hippo, I also believe that high-income individuals are a bit underrepresented in these data, but I don’t believe it would change the stats that much a massive impact, but are still speaking to a relative small number of people
This isn’t exactly true. The Federal Tax Admin publishes in-detail statistics about the number of taxpayers per bracket, and so do most cantonal tax admins.
Where I live, it’s pretty easy to figure out the distribution of both taxable income & taxable net worth just by looking at one Excel spreadsheet with ~28 workbooks.
Sure turns up something, but not what was asked, which was: What is the 1% income threshold? Both EFD tax statistics and BFS survey data cuts-off at 200k, 240k at best, and AHV income data is not published.
Or I am wrong and ask again: You got a link to that?
Again, I am familiar with that page, and believe to be familiar with these statistics. Either I am blind or there isn’t that much detail in it as the two of you claim.
So, help a blind man? What is the 1% income threshold and where is it in these statistics?
If you don’t like the brackets in the statistics you see, look at others. I’ve been able to find the 99.7% percentile in @Guillaume_GVA’s link above within five minutes.
And then, the canton I live in groups people into 150-250, 250-500, 500-1mln and 1mln+ brackets. So if you don’t find it in the ESTV data, look at your local situation. It’s probably more relevant to you personally; filtering out the outliers in ZH/ZG/SZ/etc that do not affect your personal living situation. (If you do live there, those cantonal tax admins also have detailed statistics available.) etc etc.
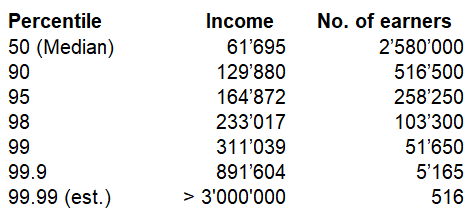
AHV did an analysis on request of NZZ, so for the first time we have the actual percentile data (for 2021) based on all employees in Switzerland (analysis excludes self-employed people):
Yes! Good you ask, because this is important: This is the raw income data, so on the low end there are many part-time earners. All official statistics consider and correct this impact, which is why your initial post with BFS data shows a much higher median.
Mit dem Lesen und der Teilnahme an diesem Forum bestätigst du, dass du die Forum-Richtlinien gelesen hast und damit einverstanden bist sowie den Haftungsausschluss auf http://www.mustachianpost.com/de/ akzeptierst.