It is based on historical data and if it works is very helfpul for stress testing financial planning.
On the other hand it is a black box. In addition I have the feeling the results are skewed to be overly positive, as sometimes it only takes data from the past 30 years (depending which asset classes you choose)
I guess my reason for asking is that I was planning a 2.5% safe withdrawal rate after RE. The tool is telling me that if I do this I am likely to die very well off, and that I have been way too conservative in my planning. I am still hesitant to believe it
It reports ~9% real (inflation adjusted) CAGR for US large cap growth and small cap growth stock. It seems realistic based on history but I was planning for 7% or less. At the end of the day the question is whether that can be sustained going forward.
You can always start some side work to come back on the safe side. Personnally, I would not aim for absolute safety, but be ready to react (decreasing living costs for some time by cutting some luxury spending (closer travel, less restaurants for a short amount of time, starting a side job…, what ever).
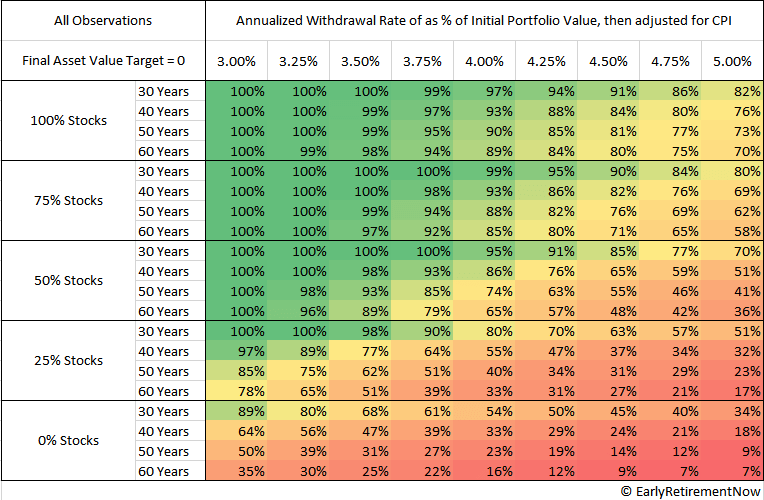
If my memory serves me right, studies show that 4% is enough to not run out of money for 30y, in all circumstances encountered until now (gread depression, word wars…). 30y is a long time to react, and therefore a SWR of 2.5% seems really pessimistic.
Have you included the effect of the USD depreciating at an average of something between 2 and 4 % per year against the CHF? (if FIRE’ing in CH)
So in CHF a 5-6 % p.a. CAGR may be a more realistic value.
PS I’m calculating with a SWR of 2.5 to 2.8%, but I’m also risk-averse / don’t want a risk that I’d have to go back to an employment after FIRE.
Well, yeah, MSCI ACWI and VT distribution yields are 1.6-1.8%, and outside of US you get distribution yields over 2%. So with 2.5% you barely touch your stake.
But I also agree with you in using 2.5% for calculations. RE is not in cards for me, but I think with 2.5% withdrawal rate for any hypothetical RE.
In theory, I think it’s captured if you use the inflation adjusted numbers. For example if I choose “US stock market” as the only asset class it pulls data from 1972 and suggests nominal Time Weighted return 10.76%, and real return 6.66%. This is close to what I recall hearing before
[Edit: 2 to 4% per year USDCHF depreciation might be a bit too high. 1 Jan 1994 USDCHF was 1.46, today 0.92, so approx. 1.7% per year in this period]
Try entering your numbers and life expectancy. I nearly fell off my chair
Does anyone have thoughts how to account for debt and loans in this tool? (mortgage and margin loan)
I have entered my gross assets (before deduction of debt). Then I added the interest on my loans to my annual spending. I think the approach makes sense but would welcome alternative inputs. My debts are 10% of assets so almost zero chance of facing a margin call.
Safe withdrawal rates are usually affected by the worst possible starting years, with the portfolio being likely to grow under more favourable circumstances, which are most of the time. I’m not surprised a 2.5% SWR shows high chances of high growth.
Mit dem Lesen und der Teilnahme an diesem Forum bestätigst du, dass du die Forum-Richtlinien gelesen hast und damit einverstanden bist sowie den Haftungsausschluss auf http://www.mustachianpost.com/de/ akzeptierst.