Pants down: yearly spending!

We split evenly most common expense with some exceptions, groceries is evenly split so around 3500 per year as a family.
It’s maybe because we prepare most of our food from raw ingredients and don’t buy much meat/alcohol.

1 Like

Aldi/Lidl shouldn’t be taken as examples. They are so optimized in CH, that the difference in non-meat product is minimal. In Germany is slightly better.
I am not sure about vegetables.

You seem to confirm my impression that if I shop at Aldi/Lidl I am already optimising groceries as much as I could and taking a trip to do just that would not improve things (when taking fuel and time into account). Still there seems to be lots of people regularly wasting a full day to drive to a border country to di shopping, so I might be missing something.

Vegetables are likely quite a bit cheaper in Italy, but I guess one travels abroad mainly to buy non-perishable stuff.

Yes, meat probably is considerably cheaper, but you can only import small amounts.

2 Likes

How can your car be this cheap? My car insurance alone is above that and I drive a cheap compact car.

and then only 150 for transportation?

I received money back from Ticino this year as I bought an EV last year. Without that and not split is around 2600, which doesn’t include charging at home that is under bills.

Transportation doesn’t include trips and I’m mostly driving now when I need to move but I often work from home.

Family of 3 renting in GE:

Label CHF
Rent and charges 1524
Additional charges for heating and water 9
Internet Fiber - no TV 41
Power 40
Serafe - Radio and TV 28
Genève - personal tax 2
RC + House insurance 20
Car rental insurance 9
Laundry 33
ASLOCA contribution 36
Deposit at the Bank 2
Bank fees 8
Daycare 1897
Health insurance for 3 768
Groceries+take away+restaurant 867
Travel expenses (me) 935
Monthly TOTAL 6 178
Yearly TOTAL 74 136

My wife will participate in 30% of our fix costs but 50% on the groceries, take away, trips …

I did not include personal expenses of my wife (travel cost, some groceries, night out …).

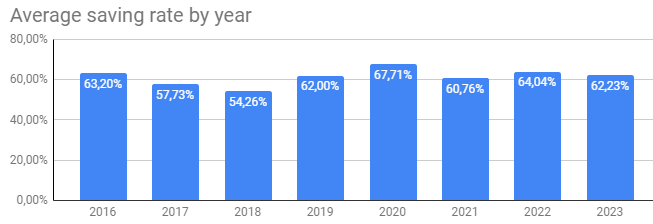
Final year with the saving rates above 60% … next year we’ll spend 12 months daycare and not 6 months …
image

6 Likes

My 2023 expenses. Married, but I only count my own expenses + my share of the common expenses (we keep our finances separate and split expenses).

Category Yearly
Taxes 22287.03
Home 10157.33
Travel 8,792.54
Insurances 4511.37
Food 3853.21
Gifts 3120.27
Shopping 2428.11
Restaurants 2407.35
Transports 1398.5
Entertainment 1303.15
Electronics 1131.35
Phone 1123.85
Sport 1016
Health 955.2
Bills 635.27
Car 411.45
Snacks 312.29
Bar 187.9
Clothing 175.25
Education 51.65
Moto 0
Family 0
Total 66259.07

And how it compares to the past 3 years (monthly averages):

All in all I’m quite happy with 2023, I spent 9k CHF less than in 2022, and almost 15k less than in 2021 ! I started caring about personal finances in late 2020, as can be guessed here.

3 Likes

What is “Shopping” ? You should incorporate it in Home/Snacks/Car/Sports etc instead of being by itself.
Or it’s more like “Other stuff I don’t need” ? I’m curious.

if you are living with your spouse and have a kid together, what sense it makes to give “your” expenses?

The only thing that makes sense for me is “our household expenses” in that regard.

Not if she pays the other half…

She doesn’t track all her expenses, only the shared expenses

Sorry for the late reply. It’s indeed what doesn’t really fit anywhere else, but can be bought in shops. In 2023 the main expenses in this category were ~1k for furnitures and tools (moved to a new place), a watch, and a few misc things ordered on galaxus.

Not the most precise category of course, but as it’s quite low in the list, I don’t feel the need to add more granularity here.

You could put almost everything under “Home” and the rest in “Hobby”. This way you could track better how much your hobbies costs. Or maybe watches are not your hobby so it should go under “apparel” instead.
Just my opinion. Every time I see this labeling I always wonder what I could track with them and if a separation would make sense to track something special. For example I don’t have a “furniture” label because I can use “home” to see rent+anything related to it (not on “home care” on my own list)

getting offtopic sorry.

Which tool do you use to get these nice graphs :slight_smile:

Just Google sheets. :raised_hands:

First time posting here. I´m a little late but wanted to share my full year spending for 2023.

For background to the numbers I live together with my girlfriend, as she´s studying I pay for most of the rent, all of the utility bills and somewhere around 2/3 of the cost of our joint holidays. Food we split in half. The rest of the spending categories are just for me.

Sharing it including my taxes and income so it´s clear what is and isn´t included in the numbers. I also already created this diagram so I could easily see where my money was going!

Overall spending (not including tax) was 47,031 compared to 46,340 for 2022.

I calculate my savings rate as 70.7% (all savings including pensions divided by all net earnings). I guess it could also be a lot lower if I calculated it differently.

7 Likes

What is baking and insurance and why is that high?

I love sankey diagrams… u did that in R?

It´s mainly health insurance, but also includes liability insurance, home insurance and a small amount for banking fees too.

Not sure what “R” is, I created it on the SankeyMatic free tool it was quite easy to use once I got the hang of it.

2 Likes

The plot is great!

How is it that your employer’s contribution to your 2nd pillar is 25k, but yours is only 11k?

Great employer I guess, I had this as well with a previous employer. Currently my employer also pays way more than I do.