Nugget's Journal

Heyall,
here is my Journal. before making this thread, i posted my (semi-) annual income/expenses statement here

I got motivated to make this thread when I came up with the Idea of calculating the percentage of my race or FIRE:

more content to follow up :slight_smile:

4 Likes

here is a most unmustachian post, but i couldn’t resist showing my last IB report. for fairness sake, please remind me to post after the next crash :smiley:
what you can see here is the performance of my [100% all world stock + small & value weighting-] Portfolio that i implemented on IB end uf July 2017:

well, in the end, it’s been a bull market!

3 Likes

Since you’re overweighted in EM, small cap and value, the real advantage of your portfolio will be reflected in the long run. Short-time comparisons won’t be very reliable because during the crash your portfolio most likely will go under more than VT (just as during the bull it will go more up). So, brace yourself and stay on course @nugget! :slight_smile:

By the way, how often do you rebalance and how much it costs you?

that is the plan :smiley:

every monthly cash transfer to IB results in full balancing, since the transfer amount is (in my current state) far bigger than the course changes between my 5 funds. as you can see here, each trade costs me on average USD 0.3, regardless of the trade volume. for the next year, until i reach CHF 100’000 and the monthly fee of $10 applies, my additional costs for each trade will be virtually zero. bottom line, rebalancing costs about nothing. I also dont rebalance amounts smaller that USD 200, and this thresold will increase in future, to still keep commissions low.

Now when my monthly cash feed won’t suffice to rebalance, I will have to come up with a rule. probably a full rebalance after each 6 or 12 months or when the allocation percentages deviate 2-5percent points from their intended values

Are all your curves expressed in CHF? Your portfolio surely is, but I am not sure about SPX, EFA and VT…
I am just asking because USD gained 4% against CHF in the last two months, which profited me as well, but will surely come back as a regression to the mean in the close future…

good point. i didnt check it. I’d assume they don’t plot SPY in USD vs. my portfolio in CHF but who knows?? im too lazy to luuk this up now :smiley:

@nugget which site do you use to manage and chart your portfolio ?

to manage it, i use my robo advisor sheet this one being an example for readers to play with, the real one i don’t share :wink: but is identical up to some numbers

i don’t chart or plot it, i just came across that chart when playing with the IB report options. which i think are really nice!

1 Like

Never tried IB charting options (only table reports). Will have a look.
Thanks.

Found it in the pdf reports. Really nice and detailed ! :smiley:

Dear all,
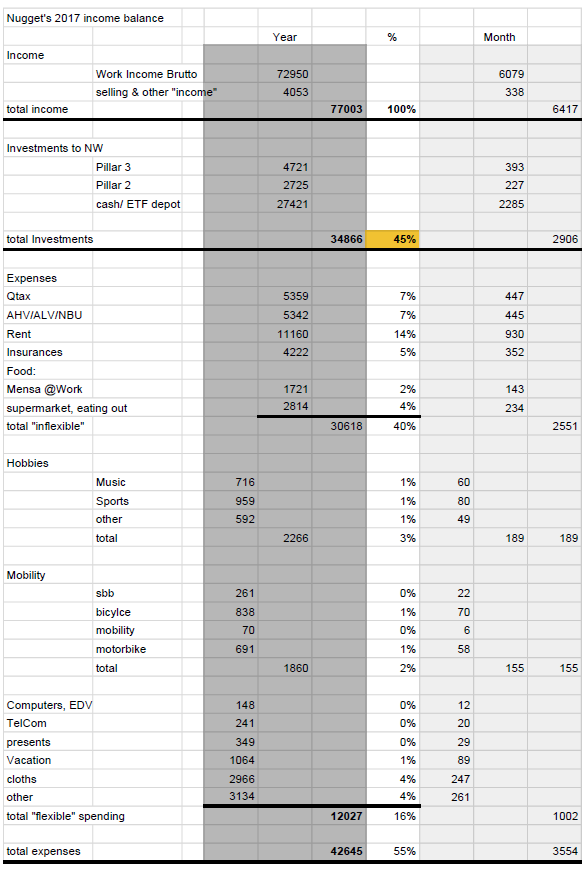
it is 31.12.2017, that means it’s balance sheet time!
compared to 2016 i could boost my savings rate up to 45% before taxes! (48% if i remove Quellensteuer and AHV/ALV/NBU from the calculation)
This means I could save almost 35’000 in cash!
this is pretty in line with my 2017 half year statement.

pretty much all my forecasts from end of 2016 came true, and most forecasts will be identical for 2018. Especially since I am still a PhD, expecting to (finally) finish later this spring.

happy new year and saving in 2018! Luck, health and happiness!

[edit]
fyi my salary is 3rd year Ansatz 4 of the ETH salary regulation page 8

5 Likes

It’s been 2 years now that I am with IB, time for a recap!
My portolio ist still aiming for “having the same $$ in every liquid stock” and can be found here. A 2Y-comparison vs. SPX, VT and EFA looks like

so clearly, betting on SPX the las two years would have more than doubled my returns.

However I am a passive indexer with my portfolio on auto-pilot, so i will just ignore this and let my portfolio ride for the next 20, possibly 60 years :smiley:

3 Likes

Hello Nugget,

I am a big fan of your portfolio and implemented it couple months after you posted it.

Thanks a lot for sharing your progress along the way, aways nice to hear updates.

One question: how do you track performance of your porfolio? How do you generate these graphs?

the graph is from the default content of one of the the IB Reports. Righ now i dont exactly recall, but you find it in via portfolio analyst - reports - detailed since inception (or similar wordings)

I’m glad my works here inspired other people :slight_smile: