I’m not short selling, it’s a buy order at -20%, untriggered yet but pretty close, I’ll use a loan for the buy, so no cash is blocked in the meantime. I made a nice amount of money the same way during the corona crash.
Who has got to “close the gap” here? ![]()
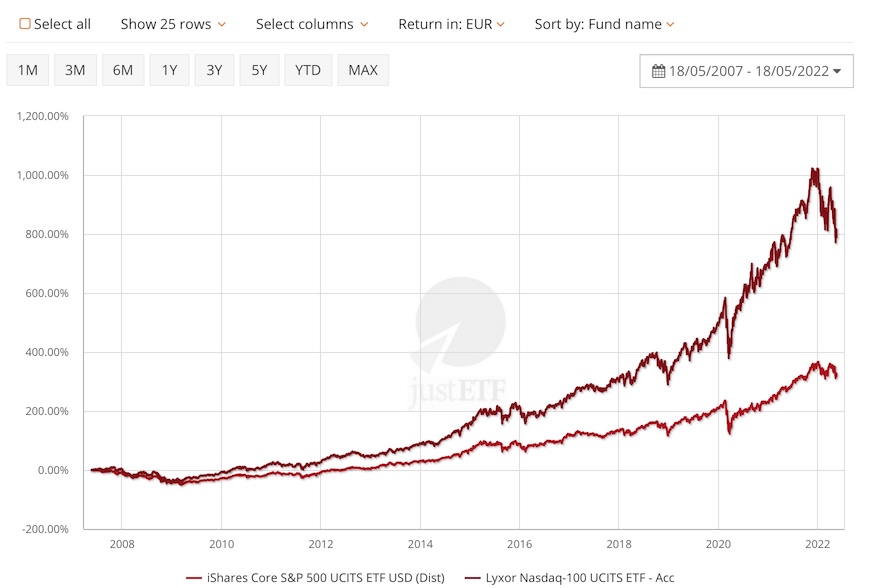
NASDAQ 100 peaked in 2000 at 5132 on March 10. It’s currently at 11950.
Two weeks later, S&P 500 peaked at 1552. It’s currently at 3900.
The period around 2000 was a relatively short 2-3 year outlier though, from which a investor would have fared better by investing in the S&P500 rather than NASDAQ-100.
Even keeping in mind the slightly higher dividend yield of S&P500, when you look at the ratio between these two indices
Nasdaq to S&P 500 Ratio - Updated Chart | Longtermtrends
…there has been quite clearly a longterm trend of NASDAQ-100 outperforming S&P500.
3 Likes
Thanks for the update. Indeed the selection of 2000 as the starting year in Portfolio Visualizer was not ideal - but as I said before, it’s the longest data which was available for SPY and QQQ. I didn’t specificly selected year 2000.
The long-term trend is indeed impressive!
Never done that, thanks for the tip!