Dividend growers ETF anyone?
Are you all Divident growers or there are also Dividend showers?
![]()
Ok I see myself out … as some of you clarvoyants say …
2 Likes

I just took 20k CHF lombard credit to buy 10k of BLOX and WPAY each, together with my other HY ETF it is paying me now 2k CHF per month net on the portfolio. Swissquote lombard credit in CHF is free until March, so why not surf this wave of crypto boom a little? In context: my portfolio is around 250k CHF in mostly safe global equities. But my monkey brain likes the idea of having this income contributing to the purchase of more safer globally diversified assets. I could allow to lose that 20k but it would be painful for sure. Would you consider it reasonable risk appetite or plain stupidity?
More like bored ape I think.
6 Likes
Wasn’t sure where to best post this, but after replying on the Best Portfolio for a retiree topic I felt reminded of an ancient grandfathered postion of some CSSMI (now iShares, tracking the SMI) that I bought in … (Goofy checks Swissquote) … 2011.
Should I maybe replace this position with CHDVD, generating a little more income in CHF? Hrmm …
Let’s look at the poor man’s version of Bloomberg and divide CHDVD by CSSMI:
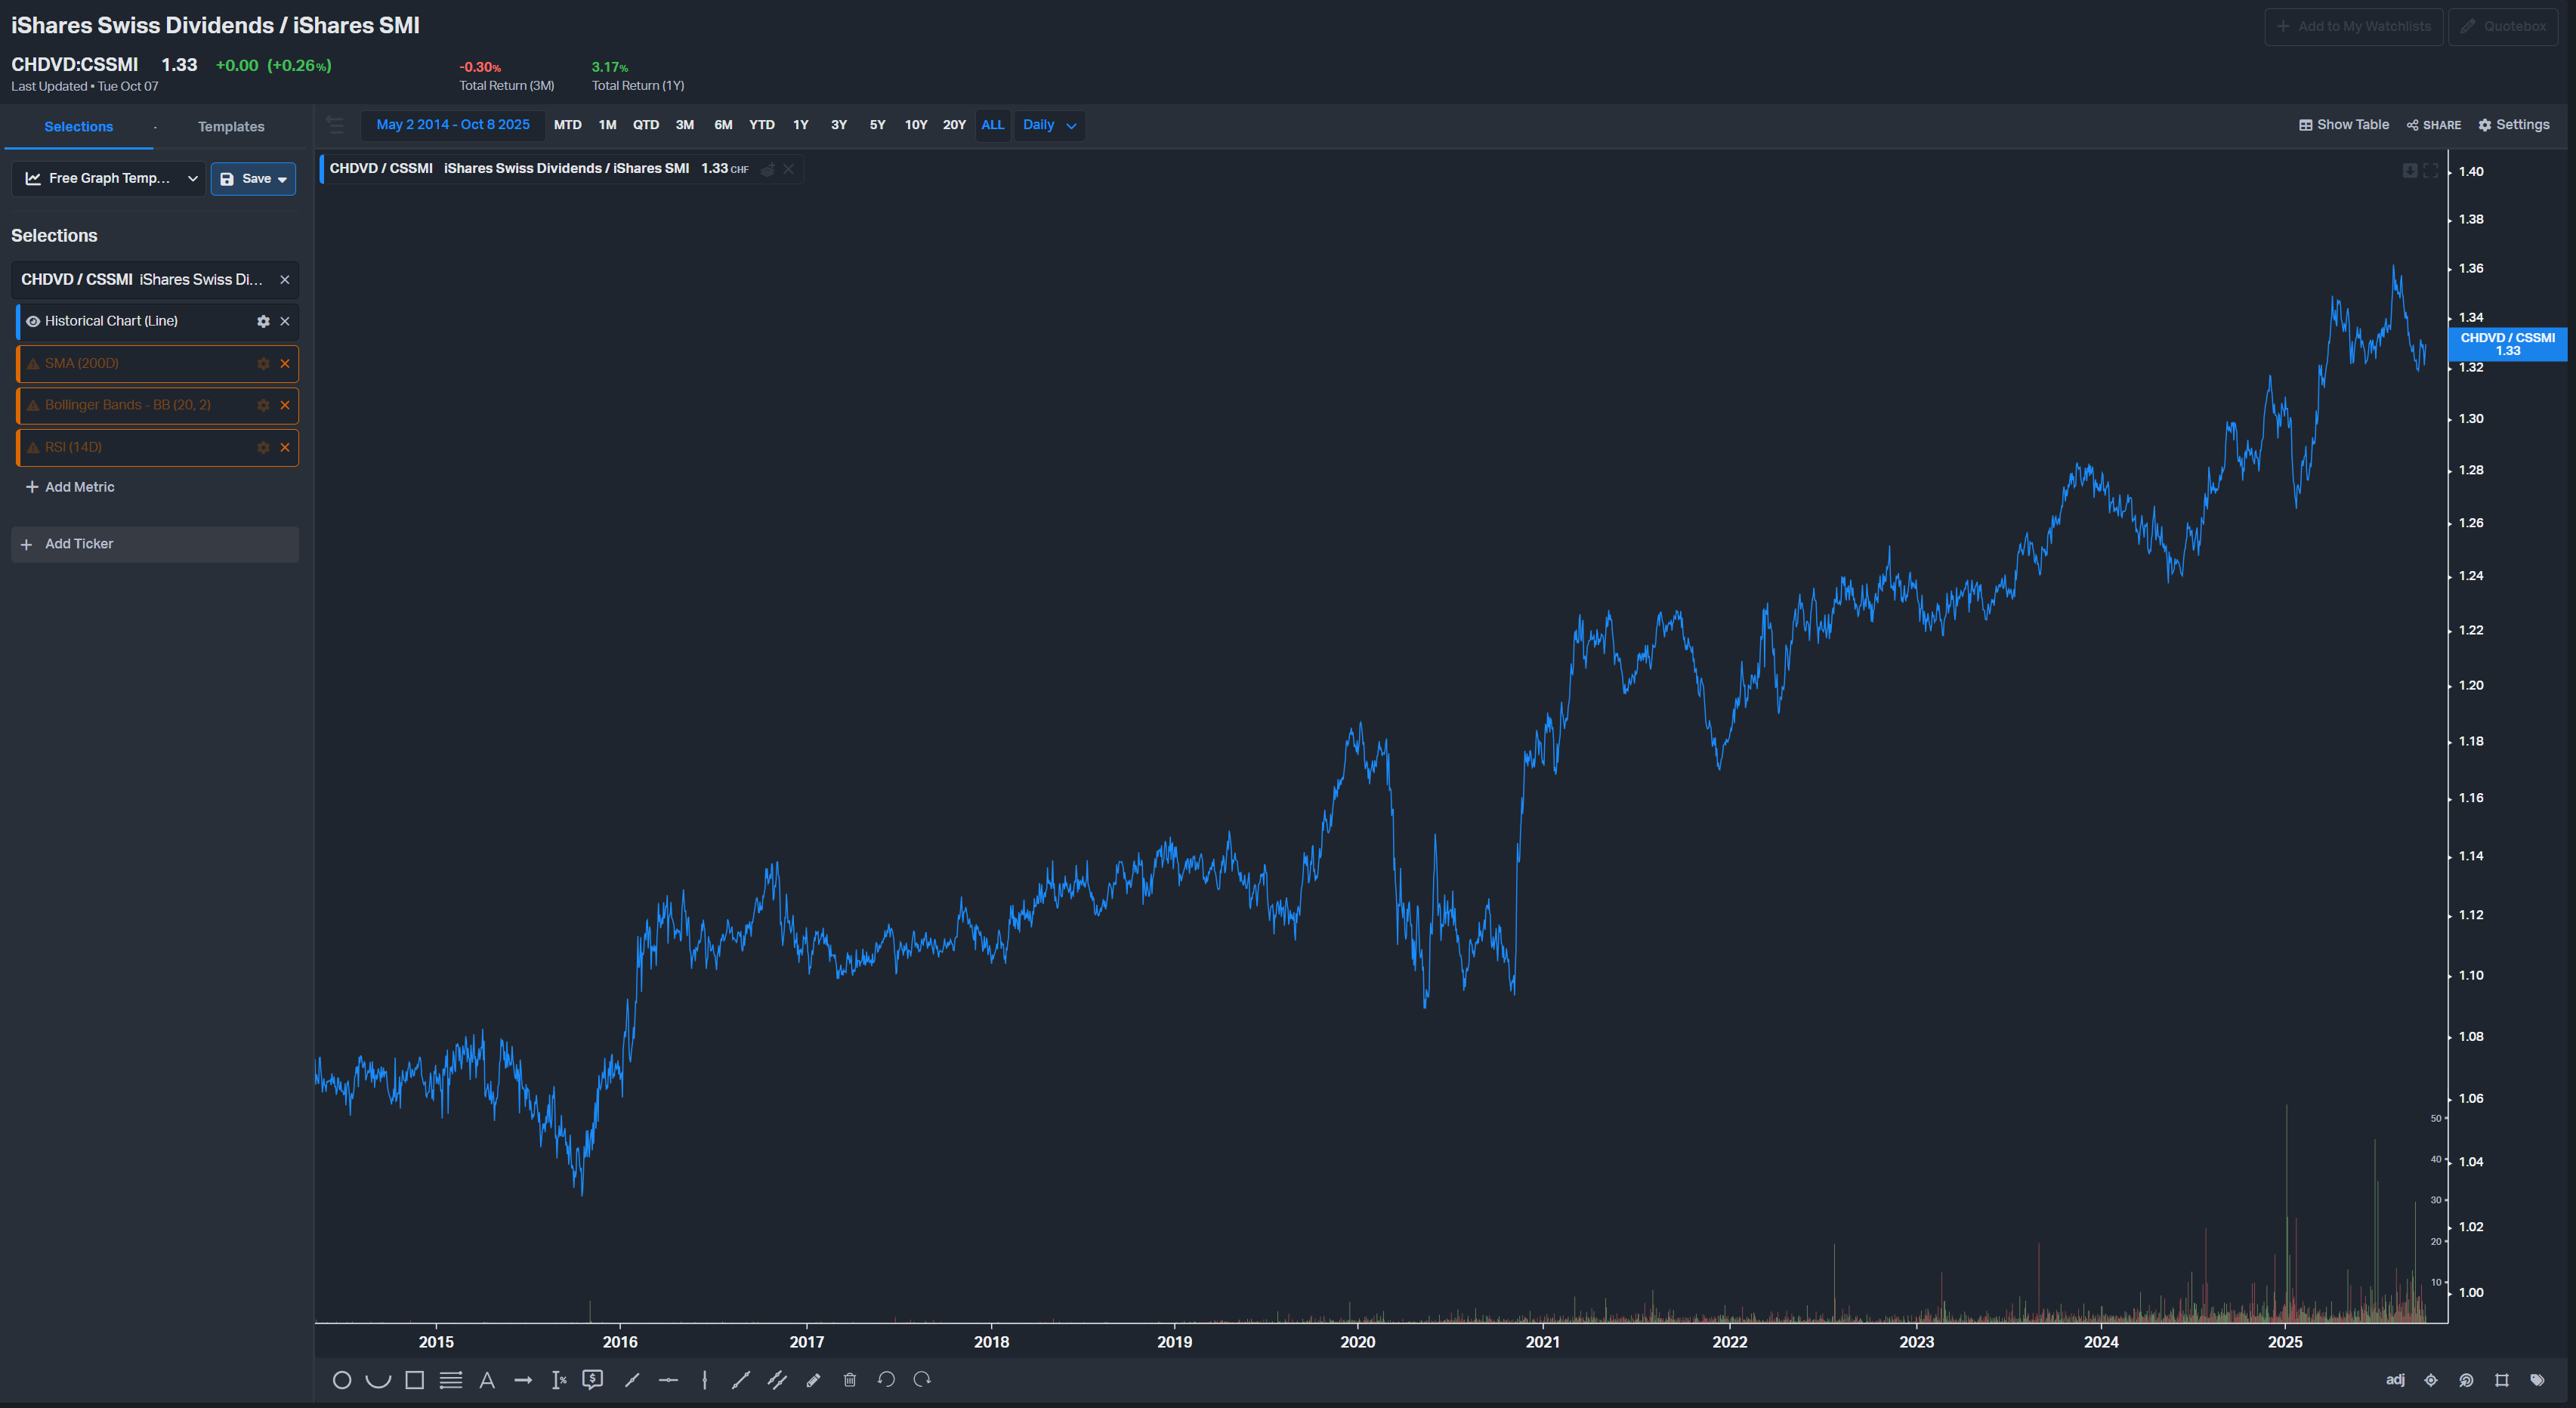
Well, I’ll be darned!
Of course, we I knew all along that dividend payers do better than the rest, but just look at this! Isn’t this a beautiful chart?
If you see SMI plummeting later this week and CHDVD ripping into the sky, you know why … ![]()
1 Like
OK OK you convinced me.
I was wondering how to supplement my Dev Ex-US portion that sits within 3a pillar (and is thus limited in size);
And I guess a little home-bias divvy goodness won’t hurt too badly.
Ape strong together ![]()
1 Like
Compared to SPI, It’s quite recent. it looked more like same performance with more diversification for SPI, diversification was supposed to be “better” for an equally performing fund…
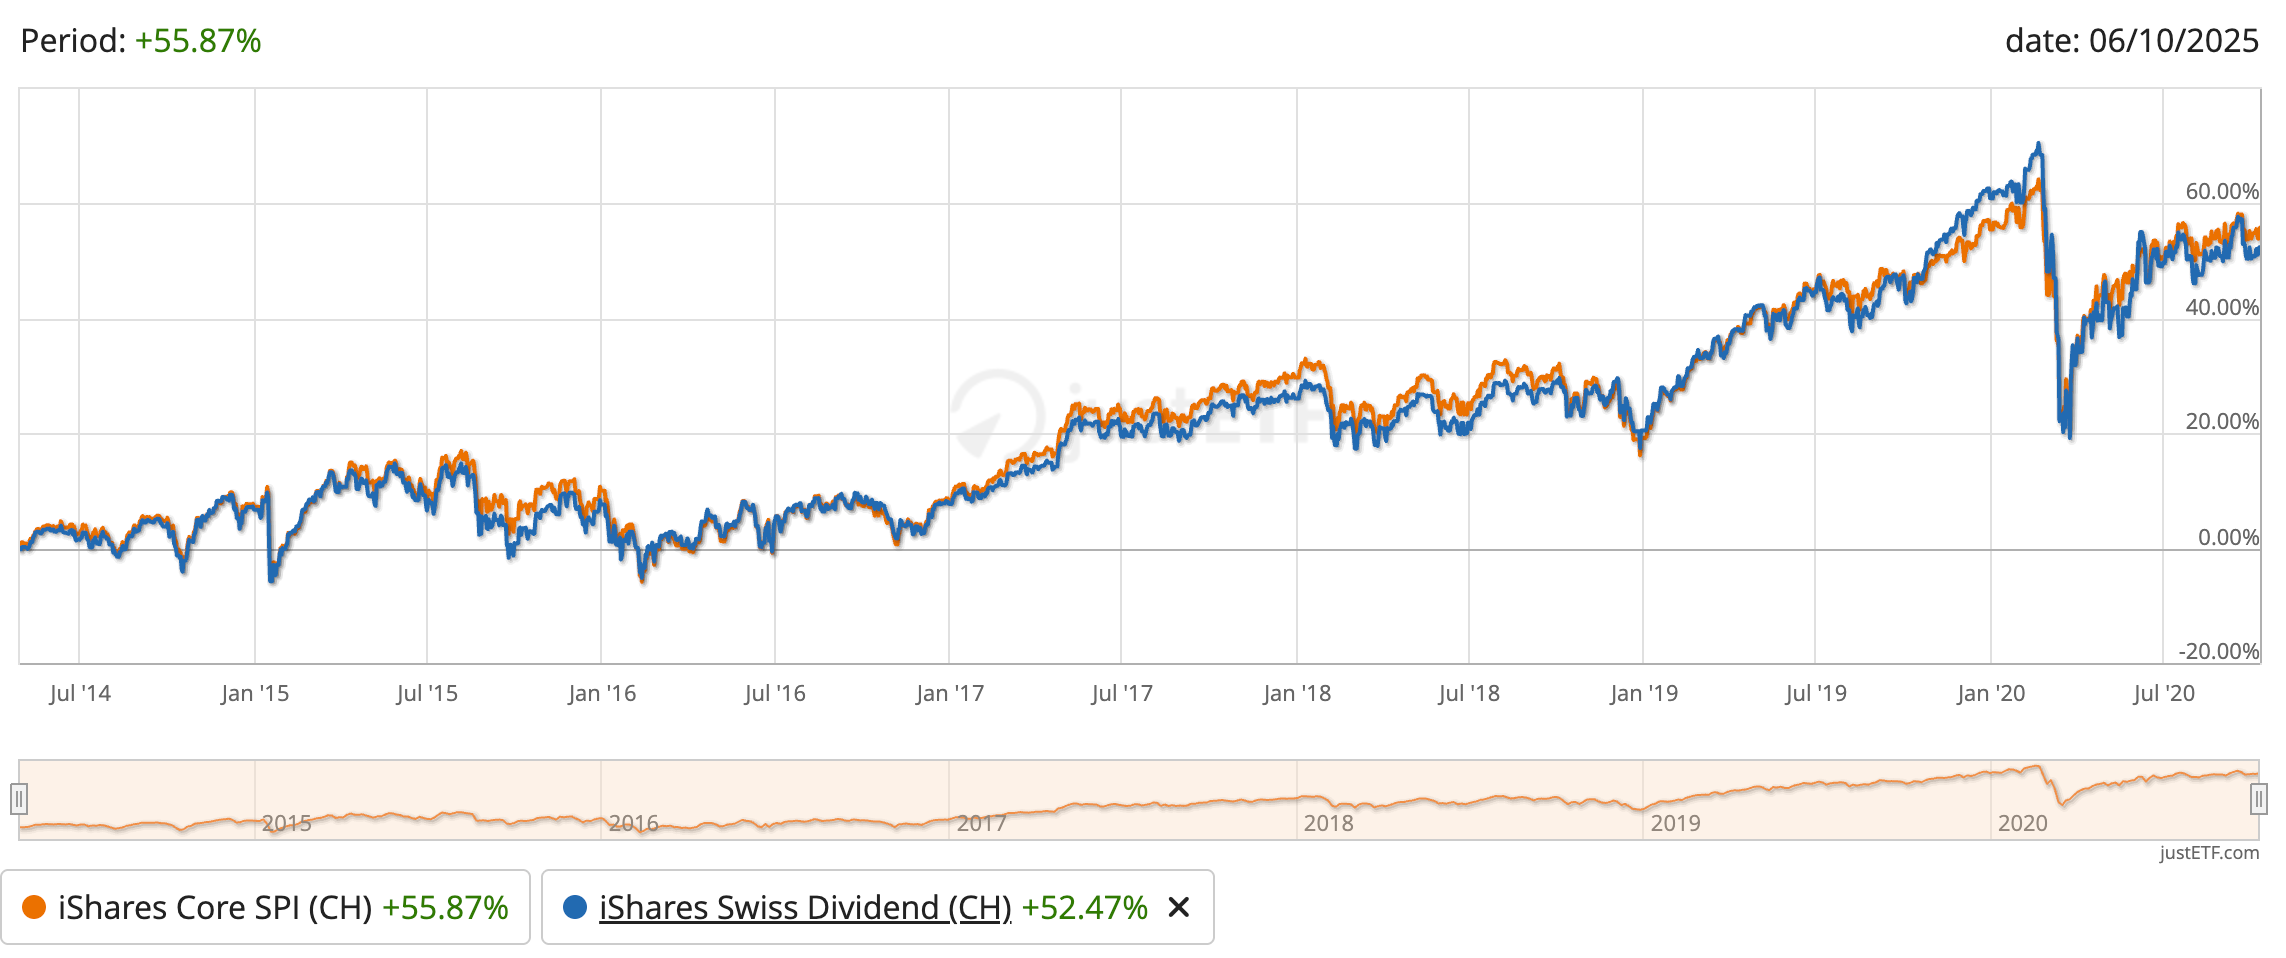
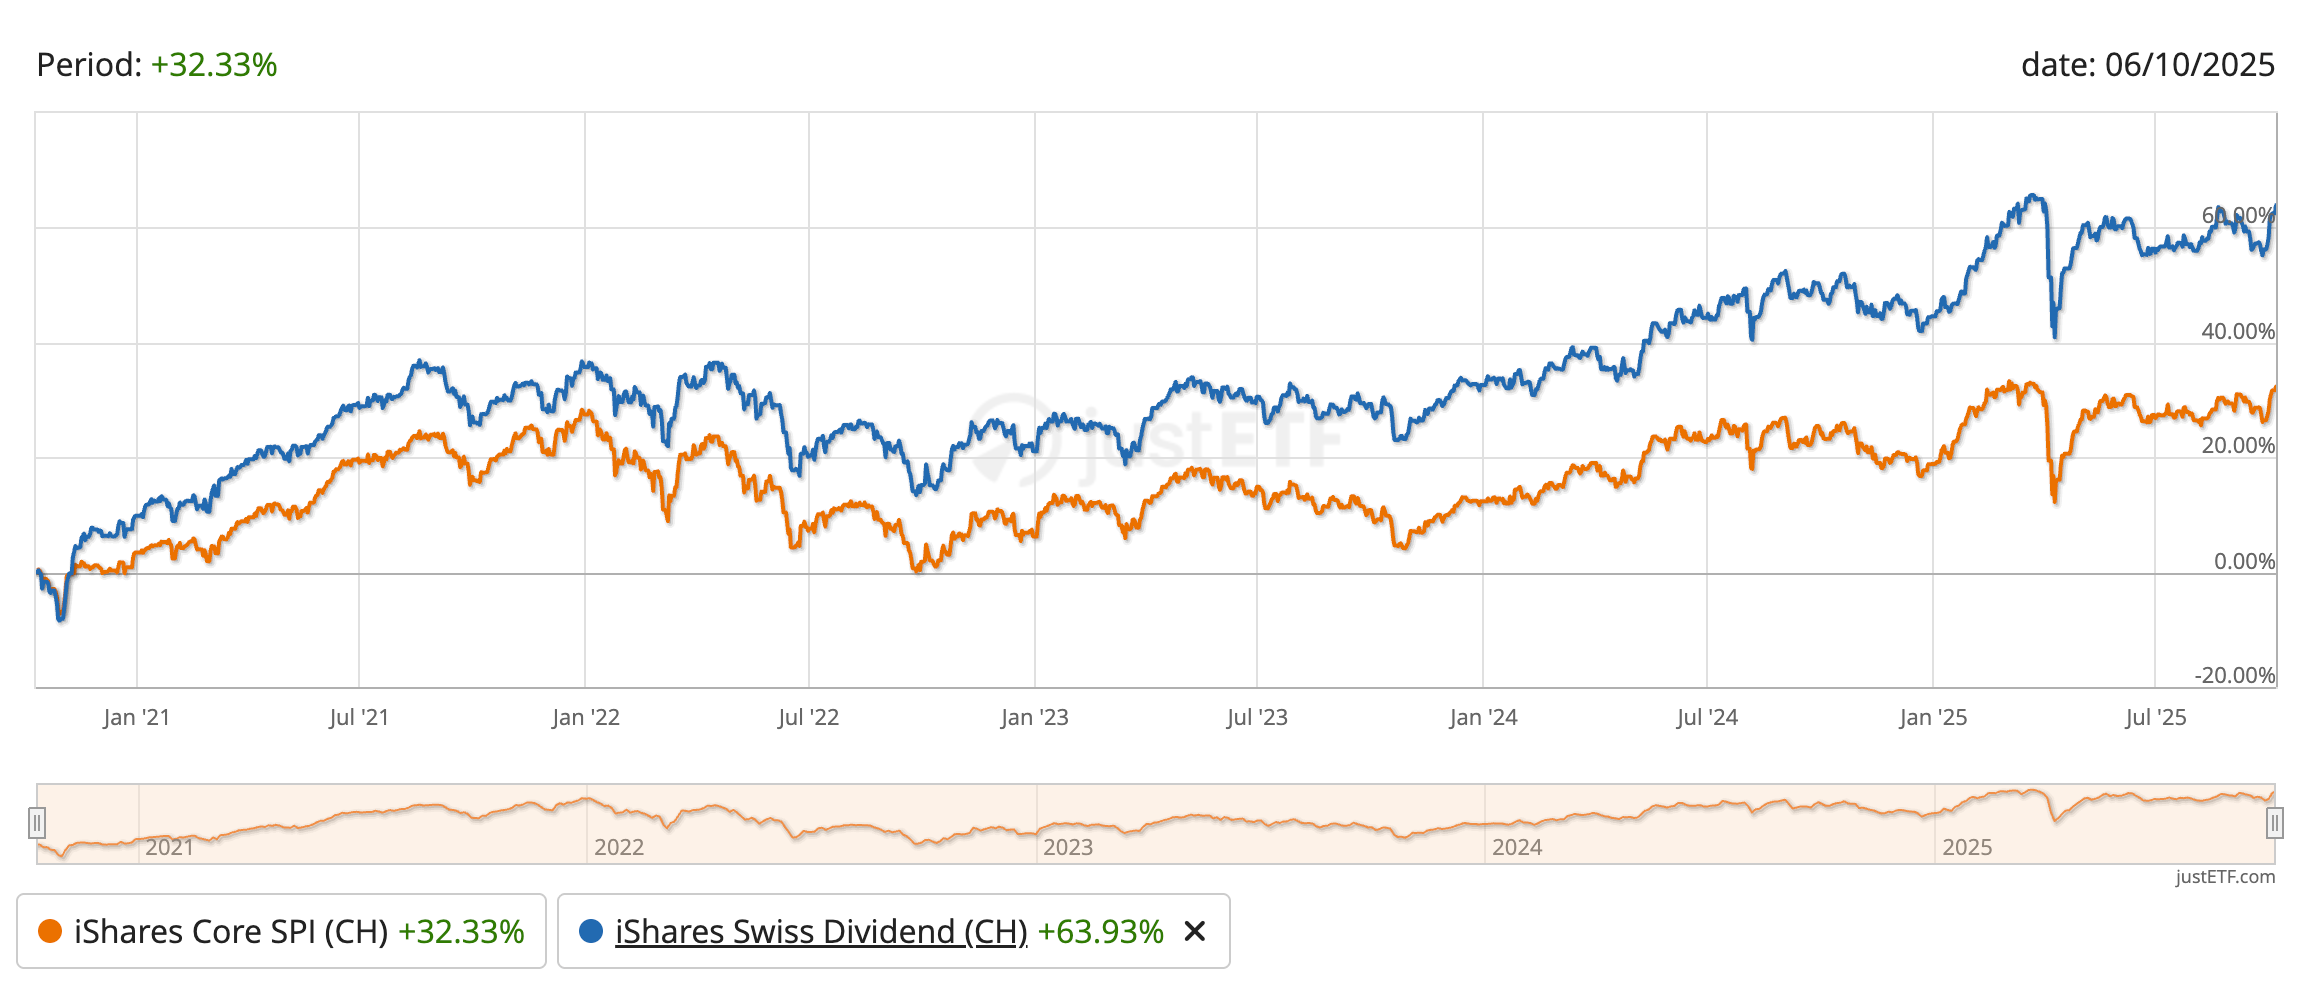
From end of 2020 it’s another story though.
It might as well reverse, this timeline is short.
Looking at the price action for the SPI between April 2014[1] and April 2025 I arrive at an impressive 195%.
Not quite as impressive as the 240% of CHDVD, but in the ballpark.
1 April 2014 being the inception of CHDVD.
Yes but this is only due to 2021-2025 period. 2014-2020 SPI even beats DVD. If I read justETF graphs well enough (I uploaded 2014-2020 and 2021-2025 separately, see above). And incl. dividends, tax free, which are higher for CHDVD, so it benefits from this artefact a little more.
Let me summarize: when I pick some time period, I can demonstrate that this strategy outperformed that strategy?
![]()
3 Likes
I’m trying to get both 50-50 so I don’t have to listen to this ![]()
But since it’s interesting to talk about it. Are we sure that the reverse might happen? The reverse might happen if some of the top stocks make a freefall, otherwise if the bear market is the same for both or if the fall is slow enough, DVD could be always better. Something doesn’t perform well: it gets thrown out of the index.
1 Like
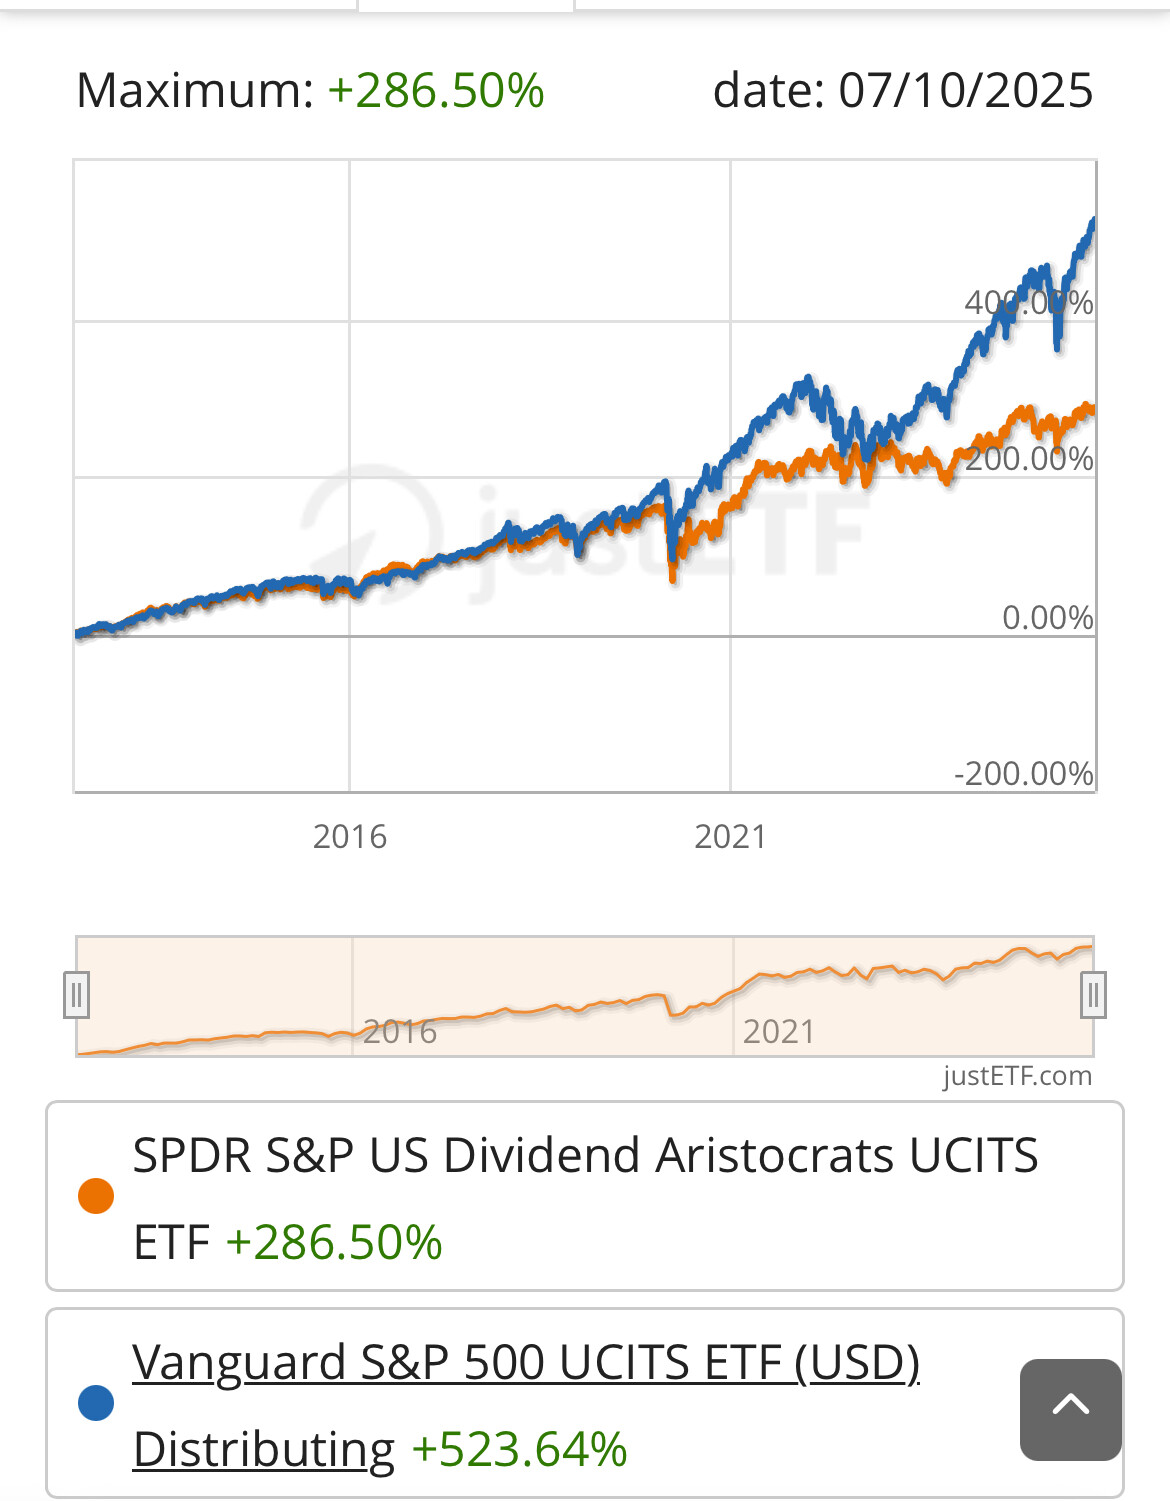
You are really on to something .. but looking at US for same thing
Looks like dividend matters sometimes except for the times they don’t
2 Likes
The orange line represents a lower growth and lower volatility option, with a fairly steady income. That might be exactly what you want in retirement.
2 Likes
I think the original chart was showing growth factor and not volatility
Can you compare a market of “Magnificent” companies whit a market with mostly “stable” slow growing companies?
Well when we can compare SPI & CHDVD, we can also compare dividend aristocrats vs S&P 500
Not sure why not?
I meant that you can’t compare the result of the first with the result of the latter. Even without seeing the second comparison, I’d have expected exactly what you’ve shown.
Right so dividend matters unless you are Mag 7 ![]()
Actually personally I like dividends. I don’t actively seek them but I think they are good way to get income from assets.
I was mainly comparing Swiss and US charts for dividend payers vs full market
I know but the fallacy is that you think it’s a similar game. Maybe you can try with sp500 exmag7, but mag7 is a new concept so I don’t know. Maybe it’s even harder than that.