where do you find the constituents of the index ?
On the internet. 
I think they do not publish it, but on their website you will find ETF that do. For example the SCHD ETF.
1 Like
I’m interested how you get the dividend yield and free cash flow programatically? I can’t find free cash flow in the EDGAR database as it is not an US GAAP metric and I also don’t seem to find CapEx to calculate it myself. Any pointers?
Actually you find everything in Edgar in the cash flow statement. The dividends paid you find in the financial cash flow.
In theory free cash flow is operating cash flow minus investing cash flow. But sometimes I use my own metrics, especially in case of financial stocks or acquisitions. Also I ignore cash parking which appears under investing cash flow sometimes.
1 Like
Thanks, seems I need to check it again, I somehow didn’t find it in the output from the API, but there were like a million items in this output xD
you may be interested in the following fields:
us-gaap_PaymentsToAcquirePropertyPlantAndEquipment
us-gaap_ProceedsFromSaleOfProductiveAssets
Often it is called “capital expenditures”, I think mainly when there is only spending and no sales or when the two are already put together. It is the same field name anyhow.
To make things easier you can just go FCF=OCF-capital expenditures. Not completely correct, but for our purposes enough.
I did never automate it, but that is the way I would go. You still have to find out what happened if the field is missing.
Addon: unfortunately some companies have more fields where this kind of investing cash flow is booked. There may be a field “software” etc. You probably must find out all the fields that should be used.
As I do this manually I always check for those. It is only once every 3 months for every holding…
1 Like
A few words about the most difficult part in investing: selling.
If you want to be invested 100% all the time there are two possibilities: you sell and then fill the gap with buys, pulling in a new position or adding to current positions. That is what I do in my dividend strategy.
The other possibility is whenever a new position is bought, without extra cash laying around, it pushes out the worst of the old positions. That is what I do in my momentum strategy.
Which one to use depends a bit on the number of stocks you find for your strategy. If it is more than you can hold, you should use “pull”, if it is less you use “push”.
Now for the details of my dividend strategy sells: every position I hold gets 3 states: buy, hold and sell.
Buy: a position stays on buy if all criteria for a buy are still fulfilled. But I only buy additional shares of positions that are worth less than the simple average of all positions and if of its sector still being under 20% of my portfolio. In my portfolio actually those companies are on buy: APAM, CNA, CSCO, GILD, GIS, HST, IBM, MET, O, PFG, T and VTRS.
Hold: a positions dividend is lower than 2% but adding shares buyback it goes over 2%. Or a position does not fulfill all criteria either on the last quarterly report or the last yearly report (but not both). Those positions as you may guess are kept, but there is no addition or sell. Positions on hold in my portfolio are ABBV, CAT, DD, EMR, F, JNJ, KMB, KVUE, LMT, MO, MRK, ONL and PRU.
Sell: If a position does not fulfill all criteria in the last quarterly report AND the last yearly report or the dividend plus the share buybacks are under 2% its state changes to sell. But that does not mean it is sold yet. I do a sorted momentum list where I add the difference from last high since last buy to actual price to the one year performance. If that number is positive or if the stock is in the better half of that list it is (still) not sold. There are currently two stocks in this situation: AVGO and CMI. TRI was there for quiet some time, but was sold immediately after it slipped to the lower half of my momentum list. I think it is not very important what criterion you use for the momentum list. The purpose is not to sell something just because it became expensive… it tends to get much more expensive.
Selling is always the most difficult thing to do. And it is true, the longer you can hold on to your stocks the bigger the gains. But then, almost every company in history died, did go bankrupt if it was not bought by other companies. You don’t want to experience this kind of loss. Therefor “hold as long as possible, but not longer!”.
7 Likes
Ok about the mechanics.
Then there are your “criteria”, how can one define their own with limited financial knowledge, then check on them in a reliable way. Can you give some details on the “matching the criteria” part, in terms of methodology / tools / time consumed?
I have limited financial knowledge, learned all from books, the internet and own experiences. For this strategy it is impossible to backtest it because you have a lot more companies to buy than you can hold. I did use logic, I want companies with a good cash flow and low risk of going bust and paying a nice dividend.
I did describe my complete criteria earlier. They are quiet simple, focusing on cash flow because of my current situation. They all can be found in the EDGAR database of the SEC.
The tools are simple: I use a spreadsheet where I put in all the needed data from EDGAR get some additional more actual data with the googlefinance function (like actual market cap etc.). There is one line in the table for yearly and one for quarterly numbers for each company. Then I check for my criteria with an if statement and just say “OK” or “NOK” in the last field. If both are on OK it is on “buy”, if only one is it is a “hold” and if both are “NOK” it is a sell.
Now, I do this manually. Mainly because I have time and am not lazy enough to be a Mathematician / Programmer. Even with standardized accounting fields, as in EDGAR, there are still differences in sectors and single companies which I may forget when programming because they do not appear often (or are missing sometimes).
Time consumed is not too high. Once a week I check for new quarterly or yearly reports and if found enter them in the spreadsheet. Every 3 months or so this is maybe one hour, in between a few minutes per week.
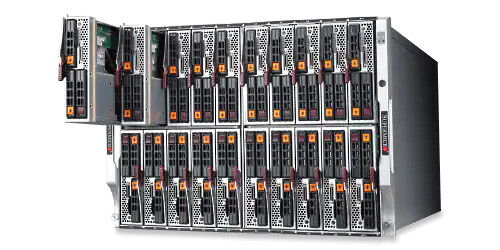
For my momentum strategy I sold some Supermicro today as every year. Still at a gain of more than 675% and after having taken out multiple times my initial investments.
Welcome to the 4th year with me and…go Supermicro!
2 Likes
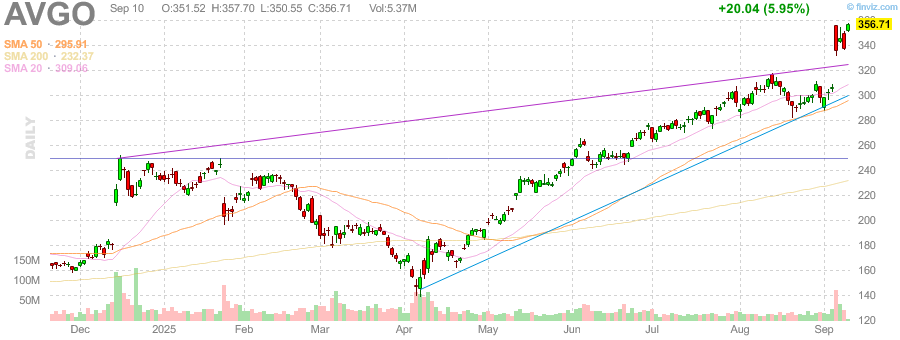
And for my dividend portfolio another market dividend from Broadcomm. The money I put into T, GIS, VTRS, HST and O. Basically all I still can buy… probably will need a new position soon.
Smells like a record carry premium this year, or at least 2nd place. The old record was 2023 with 11%. Actually it is at 8.4% YTD.
The carry premium is (dividends + market dividends - tax - debt interest) / portfolio value. Or the free cash flow of my portfolio if you want to call it that.
1 Like
I’m at 10% TWR YTD so probably lagging you a little bit (with regard to the dividend portfolio).[$]
Broadcom helped me as well … and it’s up another f-ing almost 10% today!
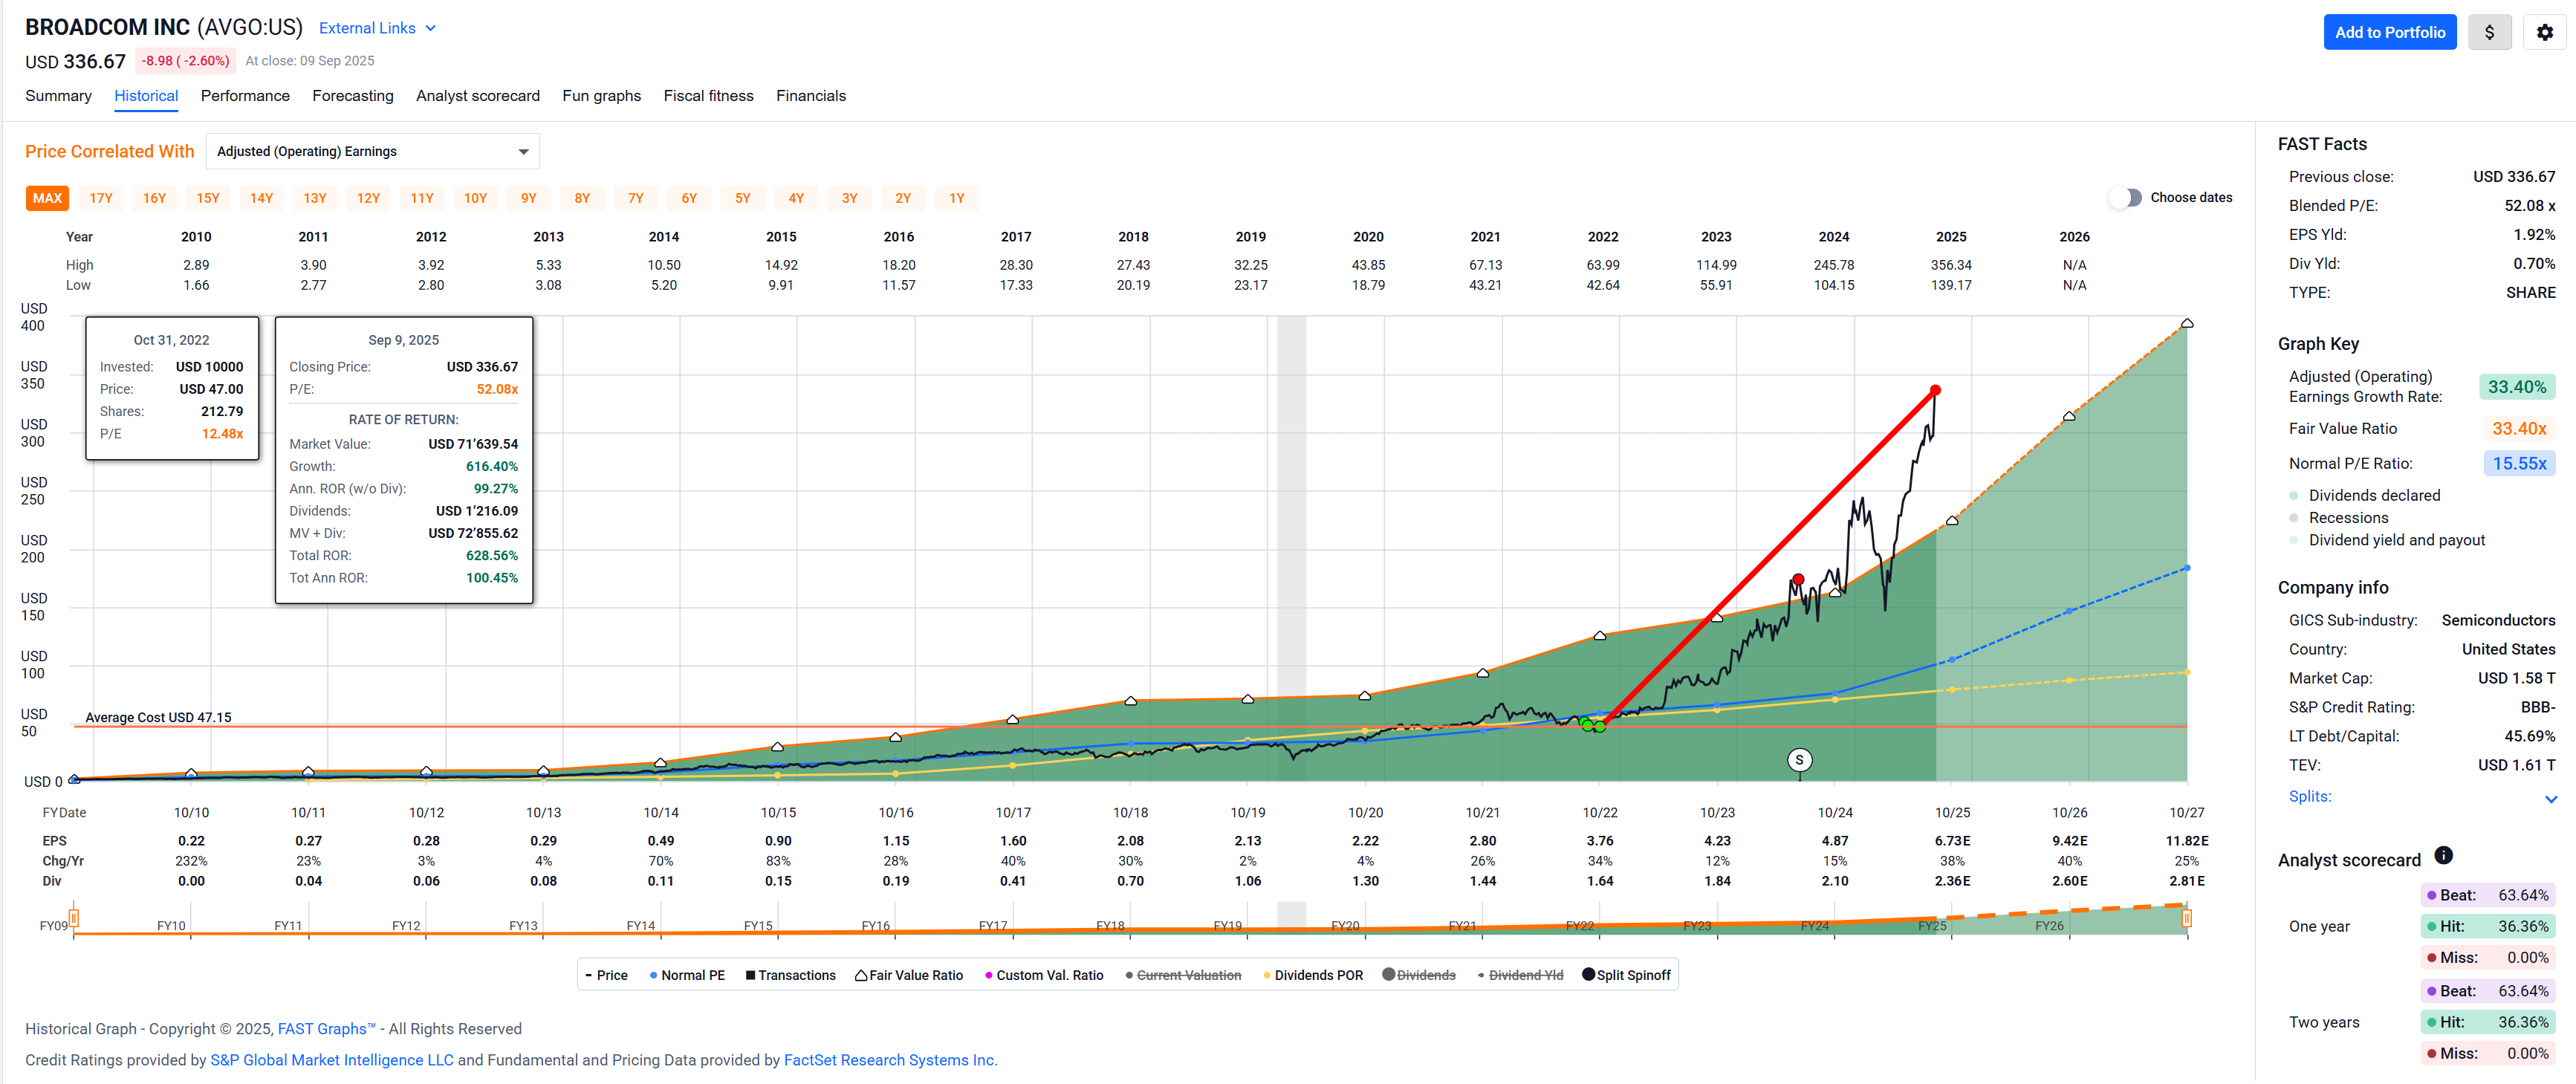
I keep agonizing about selling some more to put into higher dividend paying stocks.
As you’ve stated elsewhere, selling is the hardest part … AVGO is a 2.9% position in my portfolio right now, so not outsized, but it only contributes 0.45% of the dividends.
$ No debt interest but also not taking into account taxes as I won’t know my tax rate until I fill out my next tax return in 2026.
1 Like
Exactly Broadcom is not the best example for the market dividend part of my strategy. TWS tells me that the position is at plus 1276% (!). So, best here would have been never sell nothing. But then there are other stocks that brought in a lot of cash that way because of their cyclical nature.
Broadcom started out as dividend stock and converted to something else. Lucky for my momentum filter I did not sell a long time ago.
The not time weighted YTD return of the dividend strategy is at 12.17%, time-weighted (XIRR) since 2014 10.72% and since 2020 13.47%
If selling is the hardest part (as for most investors, including me) maybe start there with some automation / mechanization. It is way easier to define the selling rules before you have a position. The hard part is then to stick to those rules…
1 Like
I’m not sure whether you posted it already somewhere, but what’s the size of your dividend portfolio if I may ask?
No, I did not. It ist still Switzerland after all… (just kidding, tax reports are public AFAIK).
It is USD 1.323m in dividend strategy and thanks to the momentum performance 1.272m minus 309k debt in the momentum strategy. Don’t tell anybody… most of it came from the stock market.
3 Likes
Is Cuban Pete your real name, because tax office can’t find you.
So basically that’s that, with RE in Spain and ZH, no cash, no other legal source of income.
Hopefully a bit of this and that aside. Kidding. Am I?
I admire you.
1 Like
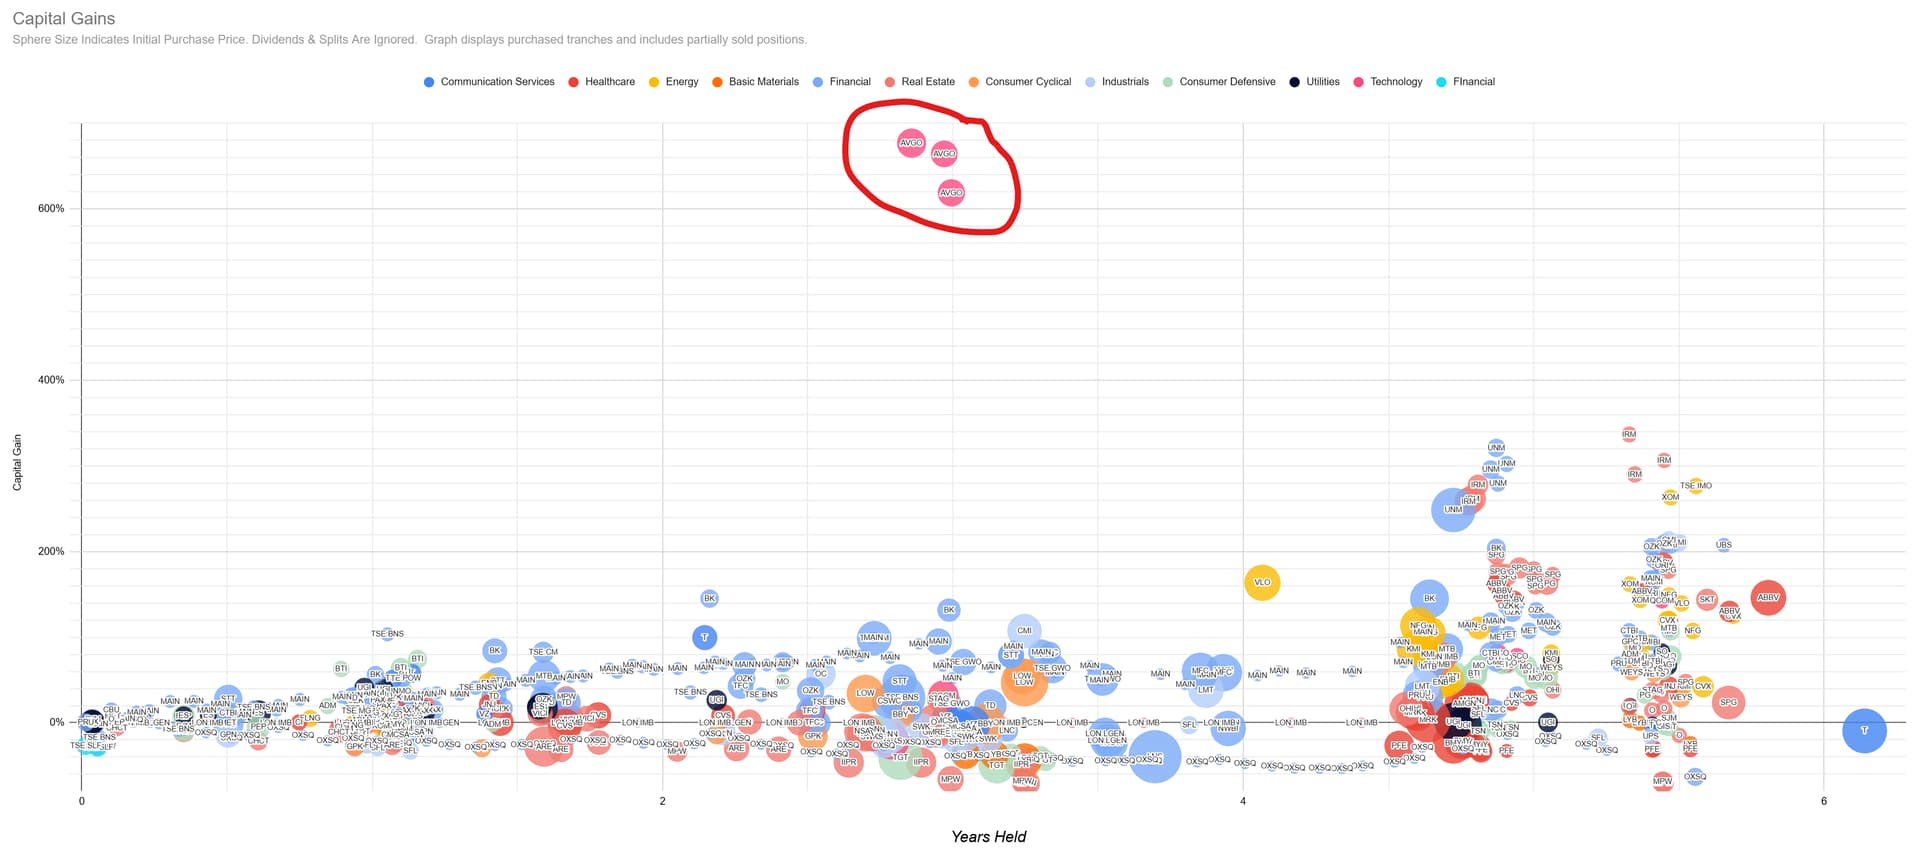
Yeah, same for my dividend growth portfolio: it’s a total outlier that started as a dividend growth play but became a capital gain thing like nothing else, really (at least for my portfolio).
I only have soft rules:
- dividend yield drops below 2%: company goes on (sell) watch list
- position size grows above 5%: company goes on (sell) watch list
- other attractive (according to a separate list of soft rules) companies move into buy territory: sell some of the companies matching the above criteria, buy some of the new “attractive” ones
I’m able to follow them, mostly. 
Whenever the tax man shows up, Cuban Pete puts on his green mask. He in fact included an accurate film documentary excerpt about a showdown between him and the tax office in his introductory post: Allow me to introduce myself: they call me cubanpete
5 Likes
I have hard rules and even that does not help against my stupidity. Did the “bookkeeping” and just found out there is some cash leftover. I sold a bit too much AVGO. Not much too much, probably a typing error in the calculator when I calculated the order size. I’m getting old…
When I was paragliding (like 35 years ago) I did use a checklist. I’m afraid I must start using one (again) when entering orders.

1 Like
Dividend strategy: OK, after my little error yesterday I bought the same companies again today to put that cash to work.
Momentum strategy: nice aftermarket action for ibex. That’s the company that put you an artificial idiot instead of a real one for customer support, sure you have encountered one of those chat/phone/message bots already.
So, they basically make hundreds of millions by just switching on a computer. That’s what AI is made for… and then they say you cannot make money with it.
Today +5.33%, aftermarket good numbers, again +23%.

Masterclass.