Mechanical investment strategies

I could not find a thread on mechanical investments, so I start this one.

Here is a simple definition: Mechanical investing - Investment strategies - Moneyterms: investment, finance and business explained.

The book https://www.google.ch/books/edition/What_Works_on_Wall_Street gives some ideas and testing results. However, they vary from edition to edition and may be kind of biased.

Most people here invest in ETF and that is OK. There are ETF that use mechanical investment strategies, some indices do too (I think the NASDAQ100?). But I always felt that I can do better by adjusting some of the rules. Most indices contain companies that I would not touch with gloves and just leaving those out should (and did for me) give better performance results.

I tried out a lot over the past decades and Internet tools help a big deal today.

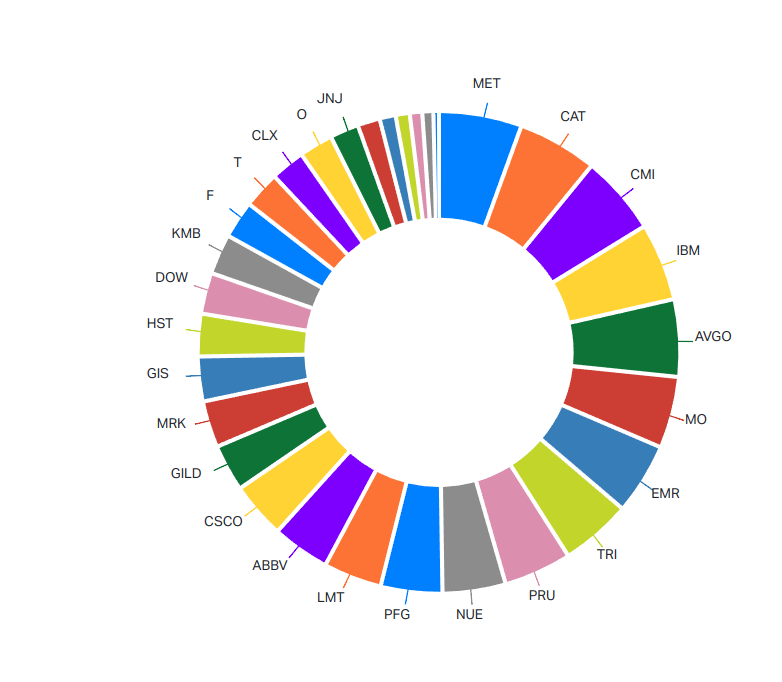
Since 11 years I do a mechanical dividend strategy with a target of low volatility and high cashflow. The XIRR performance (included 15% dividend tax) over this period was exactly 10%.

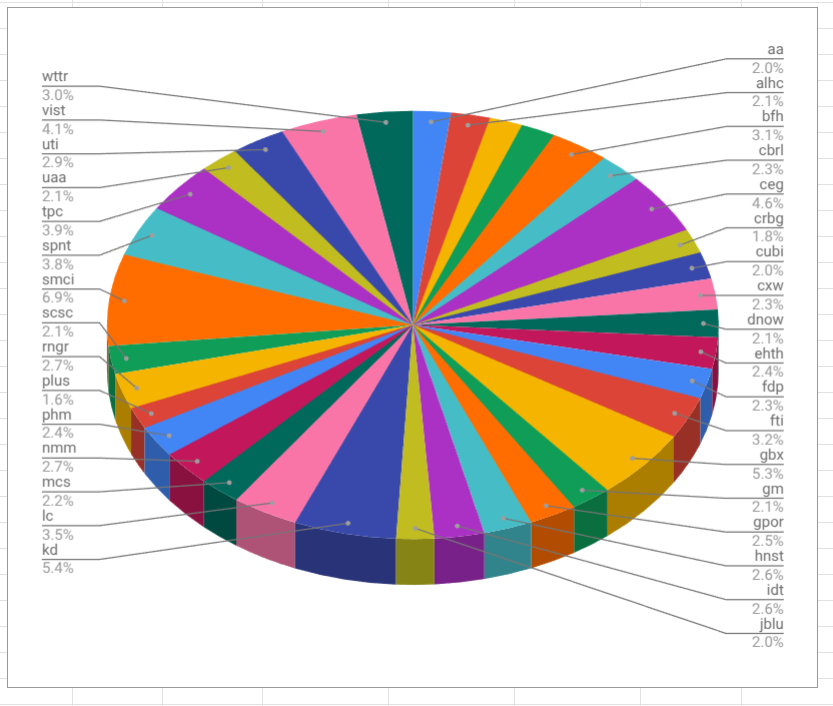
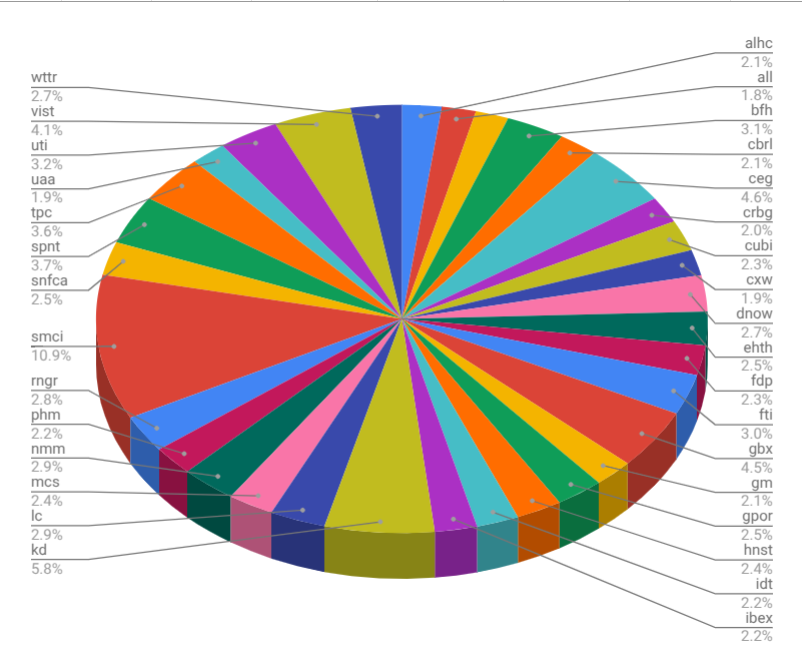
Since 5 years I do a growth-and-momentum strategy with a target of high performance with high risk. The first year was a loss of 2% but even with that loss the XIRR performance is 27.54%, meaning it made me tons of money.

The most important thing on mechanical strategies as to any strategy is to stick with 'em. You should define almost every possible detail, every outcome and it should always lead to exact instructions of the action you have to take. As detailed as possible.

I’m happy to answer all questions related to mechanical investment strategies. I probably won’t give away every detail of my growth-and-momentum strategy, did cost me a lot.

BTW: if you find an ETF that has all the mechanics you need
 go for it. Doing it yourself may be more profitable, but everybody, really everybody including me myself, makes mistakes. And those are expensive


Sounds great. Could you provide some details of instruments you chose and the kind of benchmarks you compare your strategy with? Which currency did you get those XIRR in? In which year did you achieve what XIRR i?

I have compiled returns per asset class in CHF since 2016 and it looks like your strategy could have been easily outperformed by just holding BTC (except 2018 and 2022). World ETFs is what Moustachians usually hold - they performed also handsomely in most of recent years.

1 Like

Hi. Both are mechanical stock only strategies. XIRR is the eXtended Internal Rate of Return per 12 months over the whole period in USD as calculated by the XIRR function in google calc. I use the S&P500, Dow, Nasdaq-100 and Russell2000 for the same period as Benchmark.

Some things to consider:

  • Indices are without dividends and of course the dividends strategy is about cashflow and therefor dividends.
  • At first I was surprised by the bad performance of the Russell2000. Since 2012 the XIRR was only 8.51%, last 5 years 5.42%.
  • XIRR is calculated like your bank account interest in reverse, considering all the amounts you put in or take out with the respective date.
  • There are heaps of strategies that would have beaten mine, not only bitcoin. After the fact.
  • 5 and 11 years are not very much, but it seems I am on the right way.

I try to present the performance numbers for each year and the XIRR over the whole period (sorry, my first table here):

Year S&P500 Dow Nasdaq Russell2000 dividend strategy growth-momentum strategy
2012 13.35% 7.23% 17.39% 13.2%
2013 29.38% 26.47% 31.1% 36.63%
2014 11.45% 7.55% 19.1% 4.31% 8.23%
2015 -0.73% -2.23% 7.87% -6.28% -5.7%
2016 9.59% 13.42% 5.89% 19.66% 17.29%
2017 19.42% 25.08% 31.52% 13.19% 11.46%
2018 -6.24% -5.63% -1.04% -12.24% -12.3%
2019 28.88% 22.34% 37.96% 23.74% 22.23%
2020 16.26% 7.25% 47.58% 18.41% 3.32% -2.02%
2021 26.89% 18.73% 26.6% 13.67% 36.14% 56.4%
2022 -19.44% -8.78% -32.97% -21.56% 6.95% 7.73%
2023 24.23% 13.7% 53.81% 15.11% 3.33% 64.4%
2024 23.31% 12.88% 24.88% 10.02% 17.2% 25.64%
Total XIRR per 01/13/2025 12.46% 9.96% 18.26% 8.52% 10.1% 27.34%

Performance is a bitch. Many people would have stopped the growth-momentum strategy after one year, losing 2% while the Nasdaq made 47%. I did dry-tests for many years and knew this could happen


1 Like

You aware that total return doesnt matter? What matters is excess return by the unit of risk taken. We don‘t know anything about the riskk taken, nor its distribution function (may be long tail)
 and he nce can sinply neither tell you whether you sat on aa holy grail or a piece of toxic waste.

Example of long tail risk? XIV

2 Likes

Probably the holy grail of toxic waste. :slight_smile:

Maybe some of the rules for my divi portfolio help: I want to be able to hold stocks as long as possible, but not longer. Some of those stocks are with me for 10 years now and did multiply it’s value.

I check quarter and year data from SEC’s Edgar database for some numbers. If quarter or year data are not OK for me I don’t invest any more there, set to “hold”. If quarter and year data are not OK I sell, but only if they are in the worse half of momentum. I don’t want to sell a stock just because it got a little expensive, those tend to get a lot more expensive sometimes
 :slight_smile:

Those rules are simple:

  • FCF payout ratio under 100%
  • EV/FCF <34
  • OCF/Debt >0.1
  • Dividend over 2%. This only leads to a sell if dividend + treasury stocks bought is less than 2%

FCF= Free CashFlow, OCF= Operating CashFlow, EV=Enterprise Value (market cap + debt minus cash).

The quarterly data is extrapolated to 12 months for those checks. So I need to do 4 checks per year on every investment. I want the company to pay a nice dividend (or at least buy their own stock), be reasonable priced and have a reasonable amount of debt. I focus on cashflow, not on earnings, because cashflow is what I am seeking for myself, this is my only source of income. The dividend should be covered by the free cashflow.

This is the actual dividend portfolio:
finviz link

Of those stocks currently TRI and AVGO would be on sell, but are too good performers, so they stay until that changes. DOW, NUE, DD, KLG, CLX, CAT, EMR and ATMU are on hold. The rest is on buy and the dividends are re-invested round robin in all positions that are worth less than 4% of the portfolio.

I did start with 4% per position and every time a position reaches 6% I sell down to 5%, I call this the market dividend. Market dividends and the reinvestment of dividends do a kind of buy low and sell high and that works very nice on cyclicals.

There are some diversification rules too, only 20% per sector, no new positions in sector with >20%. Initial position is 4% of portfolio value, which gives an initial size of 25 positions.

There is also a “crash recovery program” which I may explain later. Worked nice in the last few bear markets, but adds risk.

3 Likes

Sounds value-oriented and you seem to have fine-tuned your approach over the years. So you mainly look at past quarters and extrapolate? Do you also take the macro environment into consideration for possible future developments?

Provided you have compiled all relevant rules, you could program it and have a robot work for you, right?

No macro environment (like interest rate etc.) except for the crash-recovery mechanism. There I use the actual S&P500 difference to it’s last high. The definition changes to “Bear Market” when it is at 80% or less, which may trigger some additional rules which I will describe later.

And yes, you could program a robot to do it. But as I don’t work anymore (since 11 years when I started with this project) I have time and it is only a few minutes every quarter for every position. February tends to be the busiest month.

I could automate it easily, as I use a google sheet where I put in the data from Edgar and then it tells me if the criteria are still OK or not. But finance stocks are tricky, as their trading good is money you have to check the cashflow and decide what to include into the FCF and what not. So I prefer actually doing this by hand. Takeovers are a problem too, there the numbers have to be corrected.

2 Likes

As promised here the “crash recovery strategy”. It is basically a market timing and I really don’t like market timing. The point is to add risk when everybody else is taking out risk: in a bear market.

Now I am always invested 100%. The only way I can add is with a margin loan. At Interactive Brokers this is very easy and convenient and quiet cheap compared to other brokers.

One can just leave out the crash-recovery part and be fine.

I did use it the last 3 bear markets and it worked 2 times perfectly (good timing) and one time I had to suffer a lot until it worked out again (bad timing, entered too early). But the payout then was even higher. As the old saying goes: “The stock market is pain and gain, first the pain then the gain”. The crash recovery plan may be active for many years and you may suffer a lot during this time.

Here are the rules: Trigger is the S&P500 closing under 80% of its last high. I measure the lowest point in percent. That defines the leverage in the following way: for each 1% I take 1% of margin credit. If the lowest point is 70% I go to 130% margin, 30% on credit. The maximum is 150% when the S&P500 loses half of it’s value or more.

I do this when I “feel” (of course there are rules for that too) the market turns up again. There are tons of measurements one could use for that. First I check the 50 days average price. Once at least 250 of the 500 companies in the S&P500, the S&P500 itself and the Nasdaq100 and the Dow are all over the 50 days average the first requirement is fulfilled. I don’t check the Russell2000 for that, maybe that would have been a good idea the last time.

The second requirement is based on expected volatility. I check the VIX Future for contango. Once at least 3 months of the VIX Future are in contango, the second requirement is fulfilled. I buy on margin credit.

Then a three phase plan starts. The first phase is the time until either a new high in the S&P500 is reached or the credit is completely paid off by the dividends. Until then dividends are not invested and the “market dividend” concept is paused.

If the S&P500 reaches a new high before the debt is paid back, the barrier for the market dividend is set to 133% instead of 150% (5.33% of portfolio value instead of 6%) to pay back the credit faster.

While the credit is open I have a stress tolerance test active: whenever the credit reaches 300% I start selling until I am under 300% again. This is the emergency exit, didn’t happen until now, but you never know.

One may need "portfolio margin to execute this plan and have enough reserve margin. Portfolio margin at Interactive Broker gives you up to 800% margin, which is insane. As I start selling at 300% this is more than enough.

Once the credit is paid back the crash recovery phase is over.

OK guys, now you know all the rules of my dividend investment strategy, which is my pension plan and my only source of income.

2 Likes

Very interesting, thanks for sharing.

What do live off when you pay back your margin credit using all dividends?

I increase the debt.

As the dividend yield is higher than the margin cost that is good business. This can enlarge the time I need to pay back the credit of course.

I do this always, not only when in crash recovery mode. I don’t sell just because I need money, that is a bad reason for a sell. The credit is paid back with dividends, market dividends or when my system tells me to sell something.

Actually I am not in crash recovery mode and have a little margin debt because I needed money in December. It will be paid back with this months dividends.

Now that the complete ruleset for the dividend strategy are described in this thread, some details and remarks:

  • The stock selection is not completely automated, only the exclusion of stocks is automated by the rules. There is always a lot of stocks that fulfill the requirements, mainly to be able to be invested 100% all of the time.
  • Stocks enter in “pull mode”, meaning a new stock is bought when more money is around (due to a sell or dividends/market dividends) than can be invested in additional buys. Additional buys only occur in positions that are less than 4% of the portfolio value and that are still in “buy” state.
  • When starting one needs 25 positions. One could start with an index like the U.S. Dividend 100 index or just use a screener like finviz. Then just apply the rules to check if a position can be opened. Remember the limit of 5 positions per sector.
  • The portfolio value for this purpose is always calculated “net”, meaning subtract any negative cash from margin loans.
  • As you imagine some of the rules are fine-tuned over time. I do not change any rule without careful thinking and testing. The most important change in 11 years was the time for a “hold” state. At the beginning it was 2 years and that did cost me a lot of money. Today if the yearly and quarterly data say “sell” and the stock is in the lower half of performance/momentum I sell immediately.

OK, that was it for the moment, I can answer any detail questions for this dividend strategy.

After it was clear for me that I can survive with this strategy until AHV I still had a little money left. So I decided to put it into a high risk high reward strategy, a growth-momentum strategy.

Completely mechanical, even the stock picking. I will provide some details, but not the complete rules because it is very high risk
 and I invested a lot of time. Somebody mentioned that the good performance does not say anything about a strategy, it could be toxic waste because of the risk profile. I agree.

What started as a game with money I could afford to lose ended being a very strong money maker. The performance difference to the dividend strategy is that high that I think in a few years it will overtake that portfolio. Or it may fall down like a stone.

The dividend portfolio contains some bigcaps where one can put in really big amounts. The growth-momentum strategy has its limits, I think I will reach position size limits soon. Then I will need to change the position sizes what will hurt performance of course. In other words: the dividend strategy scales, the growth-momentum strategy doesn’t.

Here the wheel of fortune, the weight table of the stocks in my actual dividend strategy portfolio per January 2025:

Those are the ones that are too small to print out the name, mostly spin-offs:

2 Likes

OK, now you find here all my rules for investing in dividend stocks. I do live from those investments since 2014 when I stopped working for other people.

Now, the second strategy I use has way more risk appetite. In contrary to the dividend strategy where one always finds enough companies that fulfill the criteria, this strategy has the stock picking automated too. I run screens and some test programs on all U.S. traded stocks and ADR every day, mostly automated of course.

I started automating little things first. All actions I found disturbing because they hurt performance I started to automate. That does not help necessarily to get better results, but it avoids the “other queue is shorter” problem. Doing the same thing in the same situation is better than choosing every time, because you may end up always at the longer/slower queue.

An important part in every strategy is when to sell. The dividend strategy uses a “pull” version, where stocks that do not fulfill certain criteria are sold, then a new company is pulled in. That is possible because there are always a lot of companies that fulfill all of my criteria.

But the growth-momentum strategy is different. Sometimes I cannot find a single stock to include for 3 months or longer. So I use a “push” strategy: whenever I find something new and don’t have the money to buy it, I sell a position. I sort my stocks with several criteria and sell the worst. Always. That way I can keep every investment as long as possible
 but not longer.

Selling is always hard. But buying or selling can not occur at the best moment, never, except for pure luck. For that to happen constantly you would need to know the future
 and luckily for us all nobody knows the future.

Once you forget the idea to sell at the top and buy at the bottom you may continue to find some for you personally important criteria to sell (or buy) a stock. Write it down, that helps. Because no strategy can work if you don’t adhere to it.

2 Likes

At the moment my growth-momentum portfolio contains 35 stocks. Sometimes when I don’t find a new investment but have money left I buy a second position of an already contained stock.

Here is the “wheel of fortune”:

I use leverage in this strategy, will say more later when explaining the money management of the strategy. Leverage is not fix but follows strict rules. It does however rise the risk and of course the performance.

As I said before, I did switch part for part of my investing to mechanical actions over time. This ensures that I always do the same in the same situation. When there is a lot of action it helps to stay calm and do what historically was the best to do in that situation.

Money management is a very important part of any investment strategy. It answers questions like how much to invest in a single position, how much initial margin, how much maximal margin, how much to add to positions, how much to sell from positions. It does however not answer what stocks to buy.

In my high risk growth-momentum strategy I use a minimum of entry price or actual price plus cash as the base. Unrealized gains are not included, but unrealized losses are. One position then is a fix percentage of that number, actually I use 6%. I allow a margin of 150% plus the difference of the actual S&P500 to the last all-time high. Meaning after stocks go down I can buy more, when they went up less.

Then I calculate the “unbalance” from the base value that does not include unrealized gains and from the actual value that includes them. The formula is just margin multiplied with that number plus cash minus actual value. That gives me two numbers, the money I can use to buy stocks or have to sell stocks if it is negative.

If one number is negative and the other positive I just sell for the same amount I buy. If both are negative I sell immediately. If both are positive I don’t sell when I buy the next position.

After one year of holding I sell a fix percentage of every position.

After a windfall profit of 500% I sell a fix percentage of every position. I did a table with percentage numbers to sell 20% and still have the position growing a little, it starts like “500, 1000, 1500, 2000, 2600, 3300” and so on. I’m sure there is a formula for that, but I did never reach to more than 2000% gain in any position. :slight_smile:

The money management reflects my personal situation, I need to take out money from time to time. In the savings phase of your life you may want other rules.

You may have seen that I never actually hold a positive cash saldo. One of my mottos is “cash is trash”, it does not produce anything and has a state-guarantee to lose value. But of course I need money to live, I spend EUR, CHF, USD and sometimes some smaller currencies. At least of the three big ones I have reserve cash for a year and therefor hold debt in at least that amount. That way I have no problem with inflation, the value of my money goes down (or up in case of deflation) exactly the same amount as the value of my debt.