If you’re ever in need of a money sink, let me know … ![]()
Thanks for the offer, but that position is already occupied by my wife. ![]()
And on goes the action in my momentum strategy:
I got out of jail nicely, sold Core Civic with a gain of 64.8%.
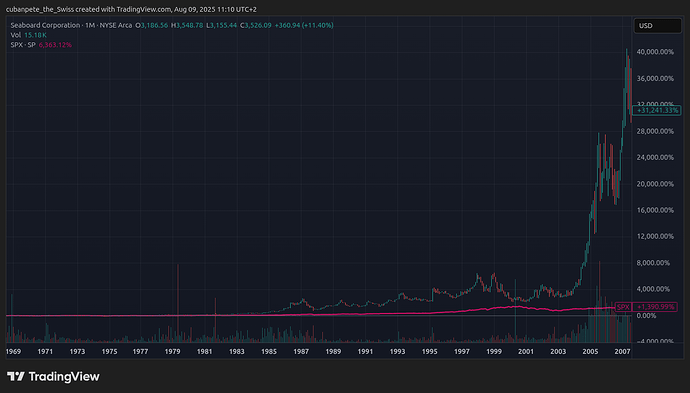
Had to make space for the most expensive stock I ever owned: Seaboard. This conglomerate with 14’000 employees literally puts the chain in food chain. Ships, alcohol in Brasil and power plants in the Caribbean, pork, turkeys, bio diesel and other plant products and the best: Futures trading as a legal insider with almost no size limit in Chicago. From $40 to over $4’000 without a split…
Last time it was sub $40 was 30th Aug 1984 ![]()
Today the IBM Dinosaur Kyndryl left my momentum world and gave me around 45% on a double position as a goodbye present. Thank you lady, next please!
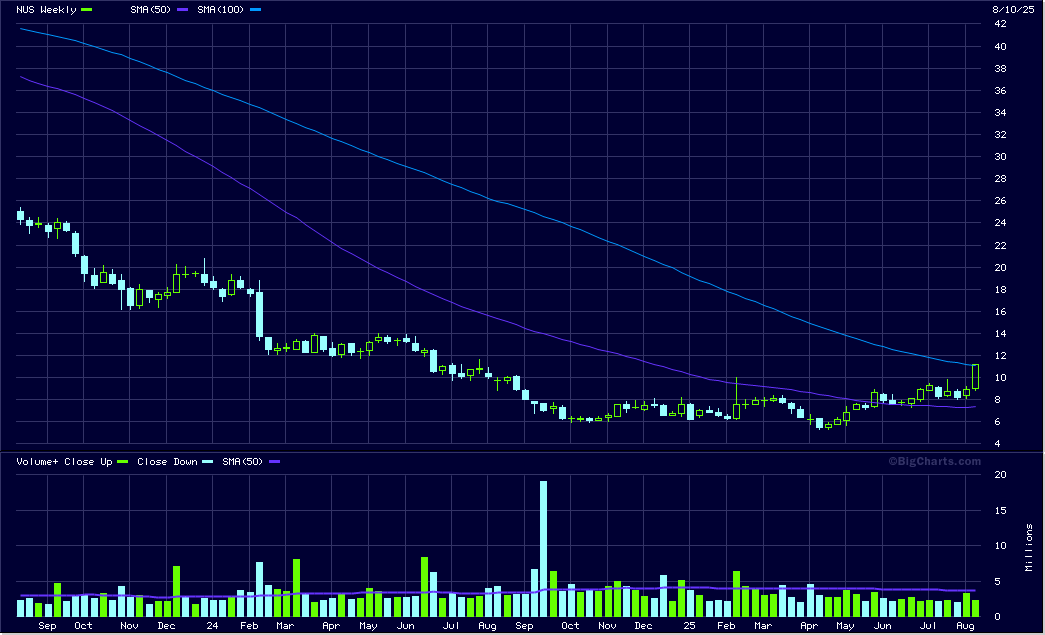
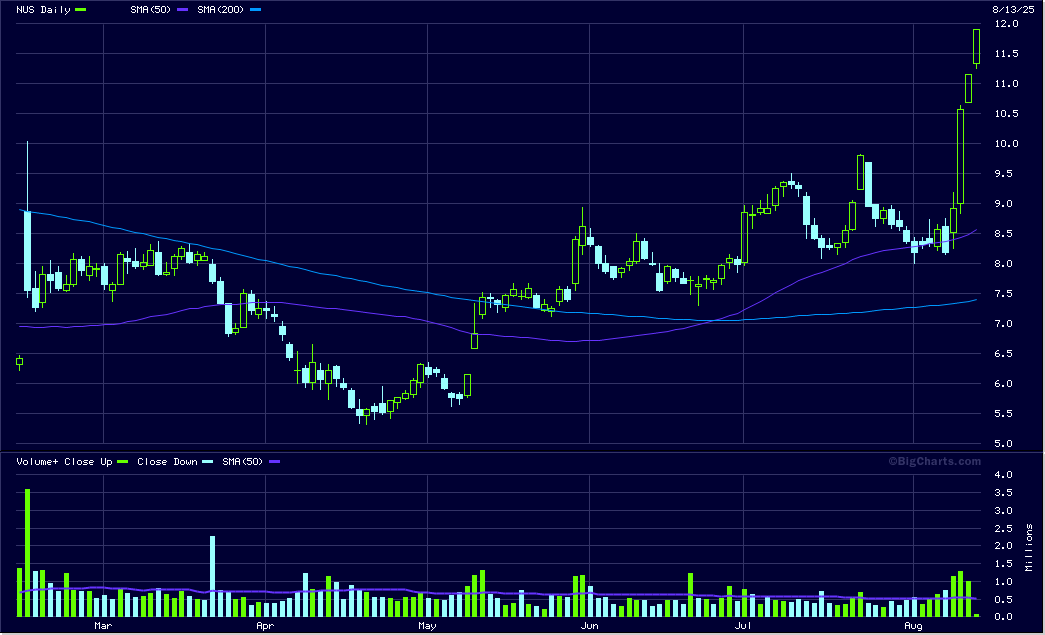
It had to make space for NuSkin. I hope this company will run as good as my last expedition to the sector, the honest company. Could be a recovery story, probably on international level.
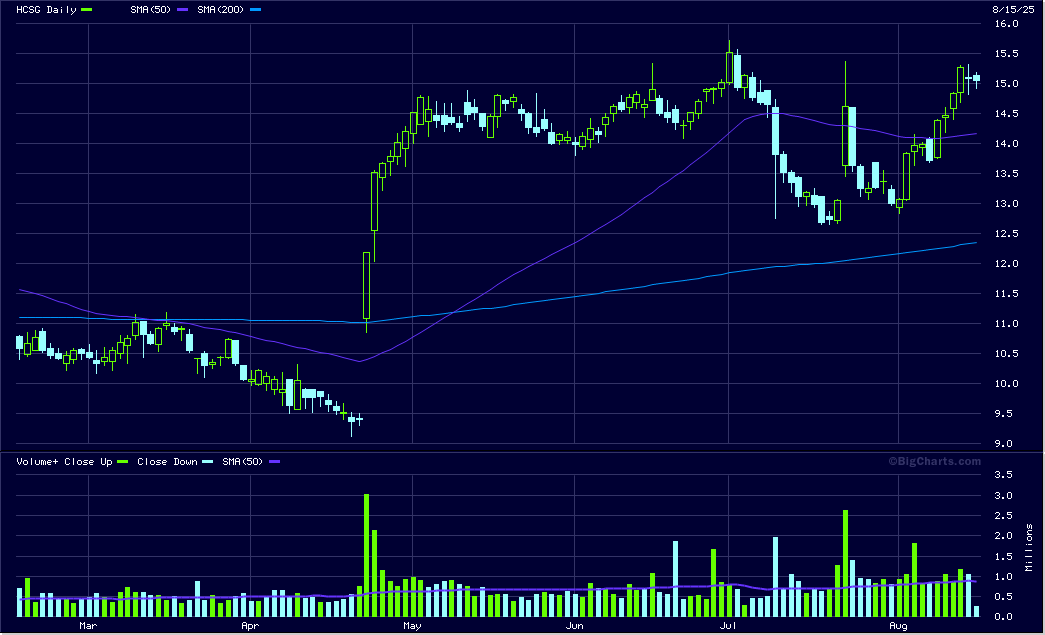
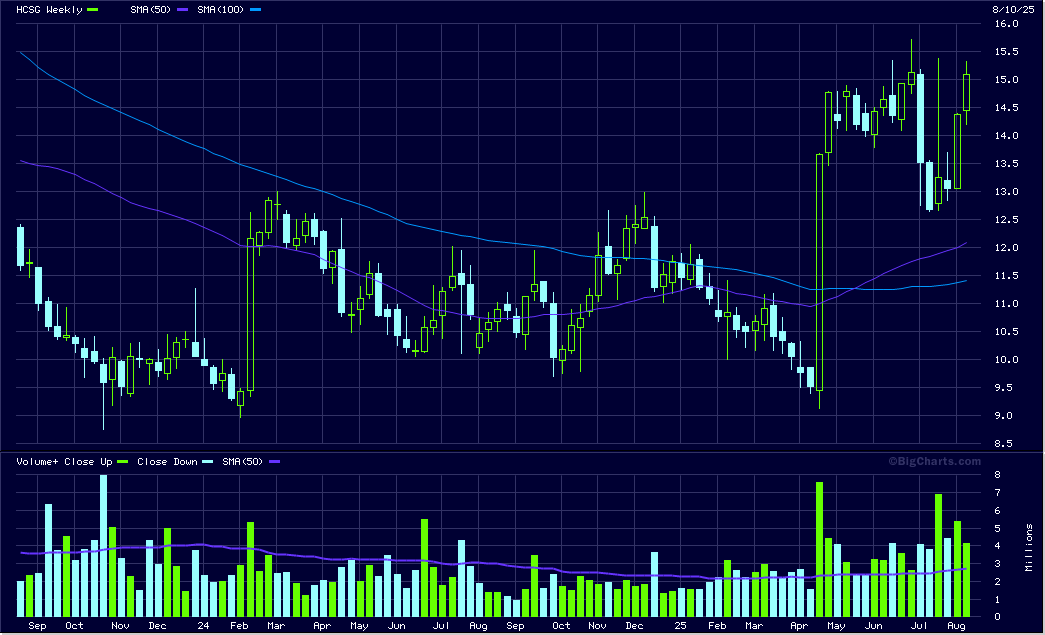
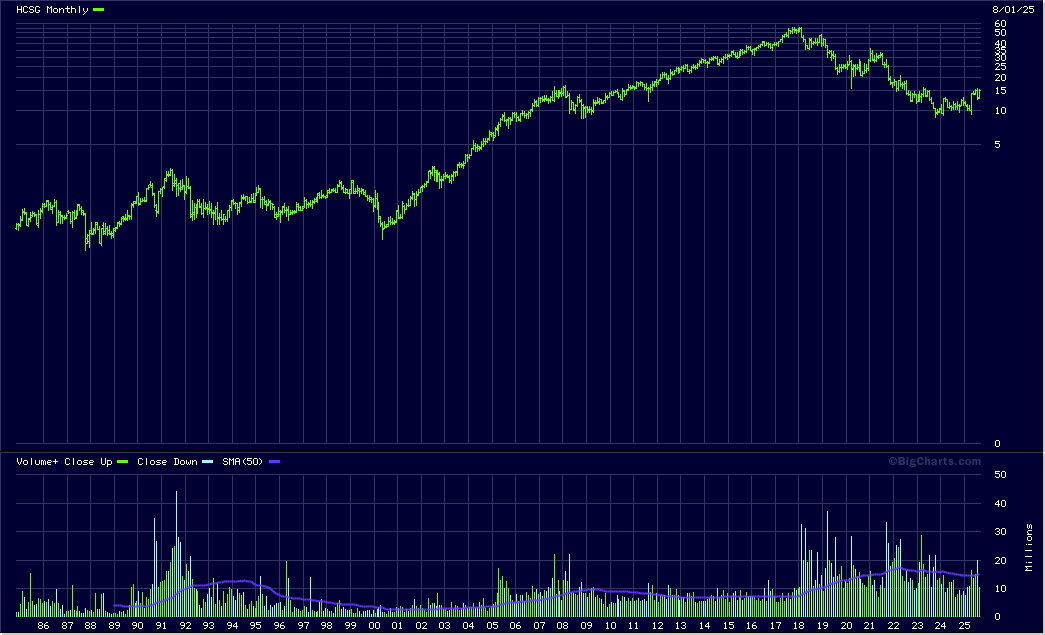
For my momentum strategy I sold Security National today with a loss of 29%. Had to make space for Healthcare Services Group (HCSG).
Momentum Strategy:
And I sold another veteran today: Serious Point had to go. A double position with 102.33% of gain.
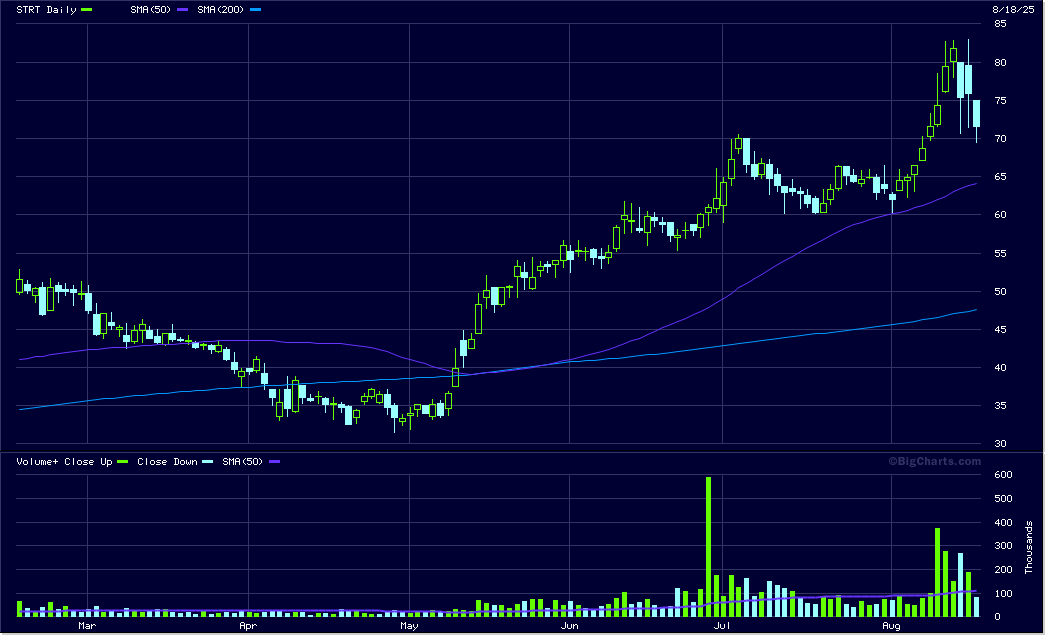
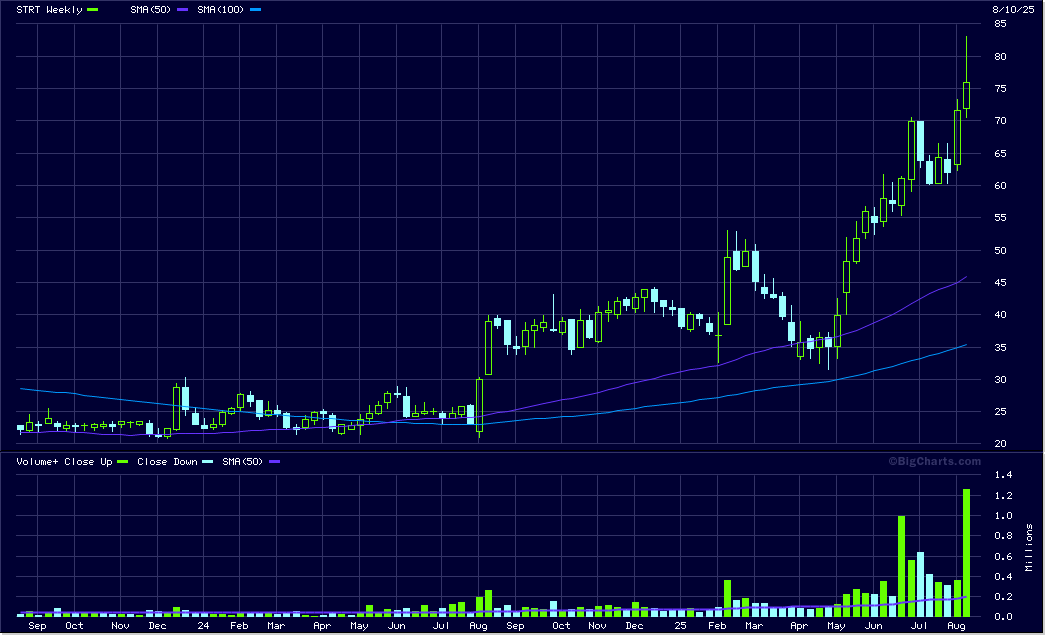
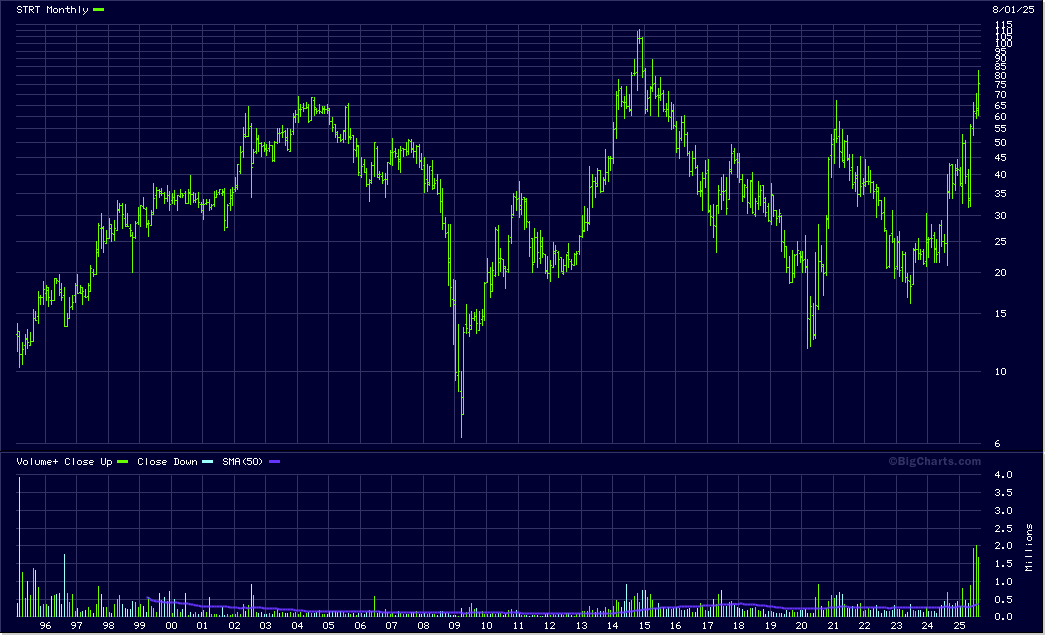
I bought the Briggs & Stratton Spin-Off Strattec, at a very bad price, today. I hope at least the 70 holds…
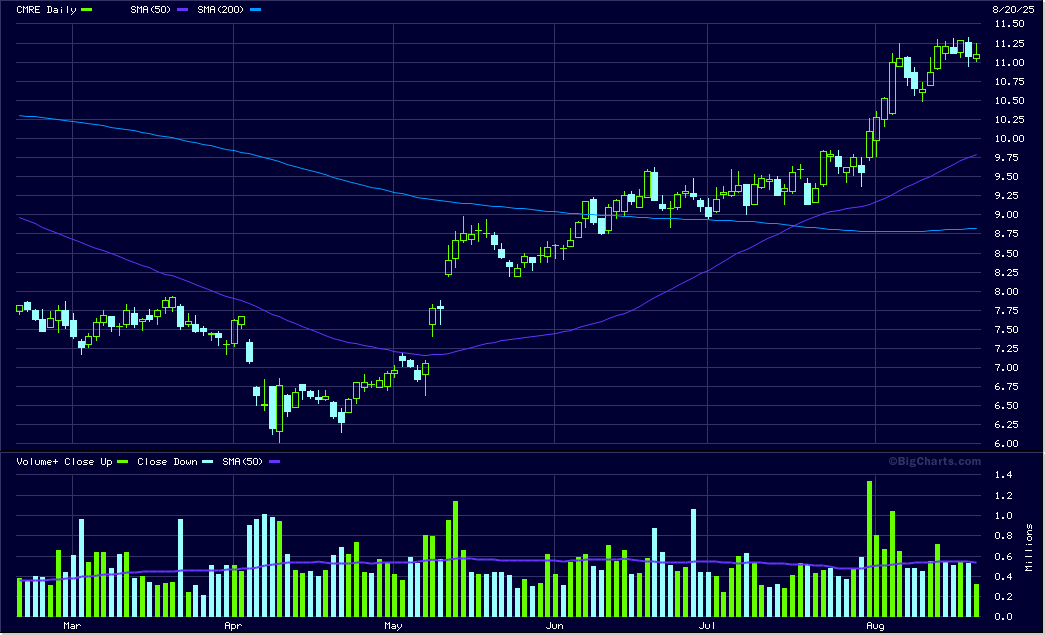
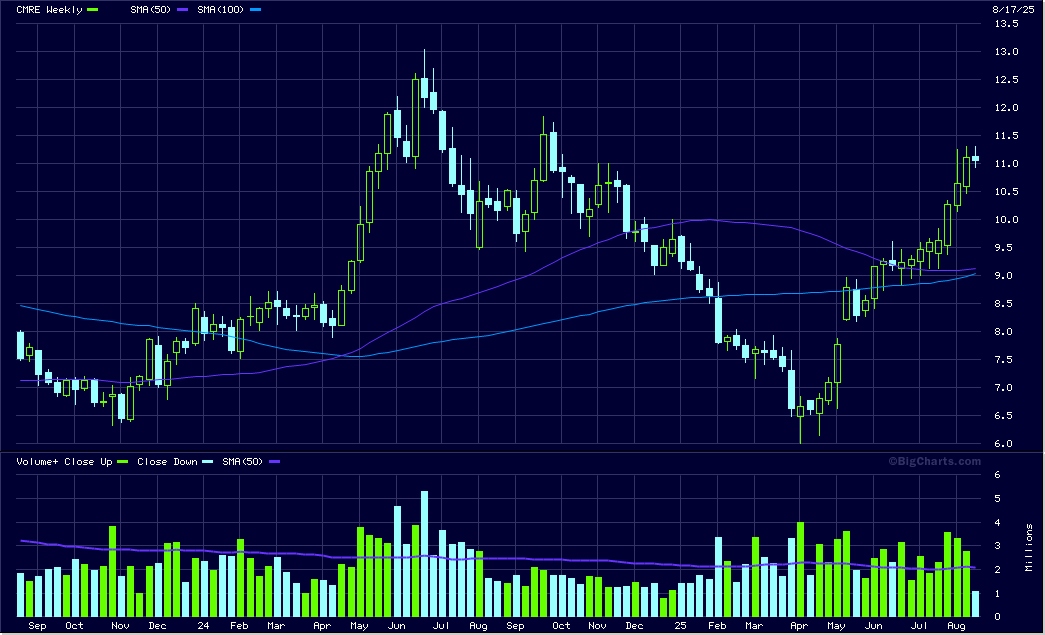
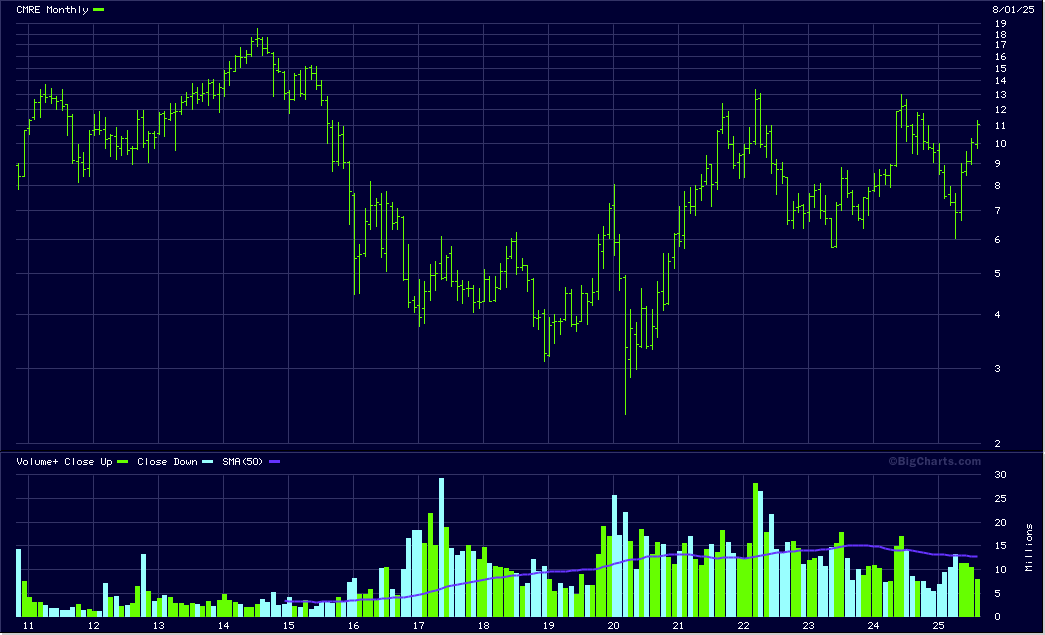
For my momentum portfolio I bought Costamare Inc. today. Had some spare cash laying around so I did not have to sell anything.
Today I sold IDT with a gain of 87.7%.
Had to make space for Kimball Electronics.
Unfortunately bigcharts does not work any longer, I suppose marketwatch just shut it off. Will have to find another provider…
Charts are just for fun for me, no need to but nice to look at. ![]()
Bigcharts is gone. Again a veteran that leaves without a suitable successor. The internet is the best proof that we are going fast in direction of Idiocracy.
Yesterday I tried out around 20 pages for charts, none has the combination I like:
- All parameters in URL, so I can add a search that gives me a chart of IBM by entering “c ibm”.
- Possibility to link to image.
- Chart is updated every time the image is accessed.
That was too cool and did work for more than 2 decades.
In the search now there is a text “not found, please don’t short Marketwatch”. If somebody wants to short it, the owner is Dow Jones which is owned by Newscorp, stock symbol NWS or NWSA. ![]()
In Finviz you can look at a chartbook with several parameters, here links to both of my strategies:
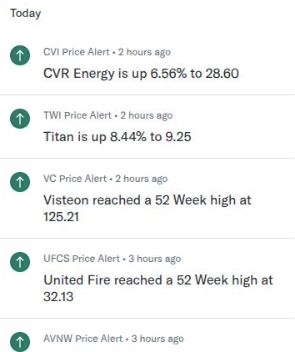
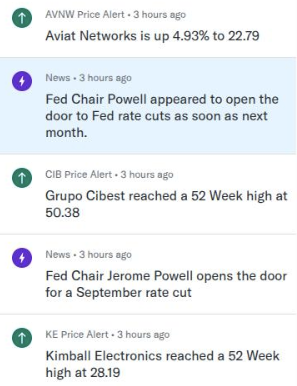
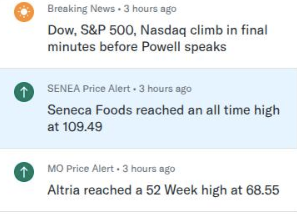
I start to see why this August was by far my busiest month in many years. Some of my news flow in yahoo finance today:
But then my experience says that new highs are sold. Just enjoy while it happens…
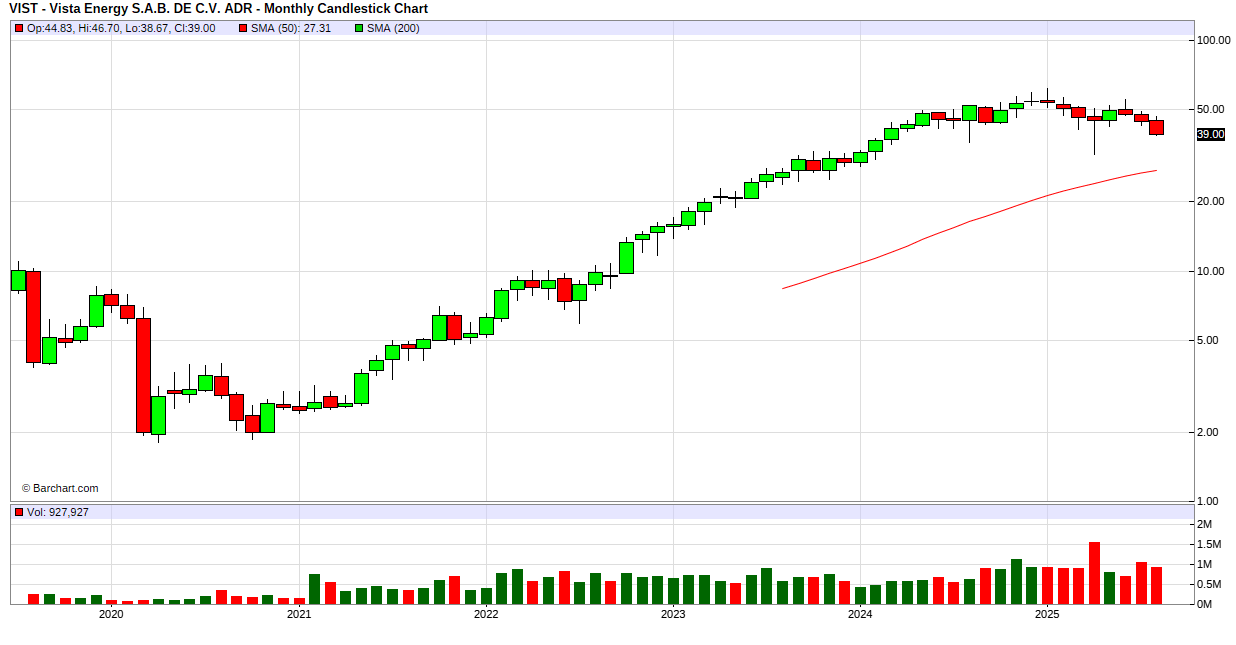
It was a nice warm August day exactly 4 years ago and my system told me to do something I hate: buy a Mexican penny stock, a gas and oil explorer with operations in Mexico and Argentina: Vista Oil and Gas.
Pennystock, Mexico where the police once tried to put drugs under my car so I would smuggle it without me knowing, the country where at shootings there is always police… at both sites of the shooting. And Argentina where private companies were “nationalized” (stolen) whenever the president needed money for her next cosmetic surgery. And a penny stock… come on capt’n!
A strategy only works if you adhere to it and I did what I had to do: bought quiet some shares.
In Mexico chainsaws are still used like in horror movies, but a chainsaw seems to have saved Argentina. My stock went up 100%, 200%, 500% and finally 1000%.
I took out already multiple times my initial investment and today the stock enters its 5th year with me. No idea how long it can stay, whenever the capt’n tells me I will sell it without hesitation.
Today I sold some part like I do every 12 months.
Almost forgot the picture:
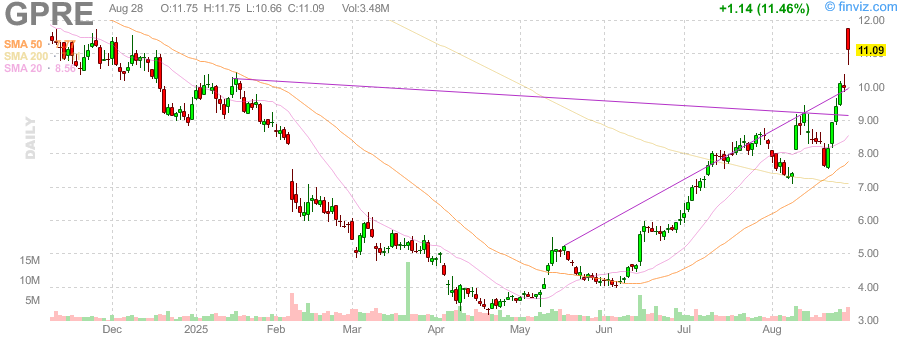
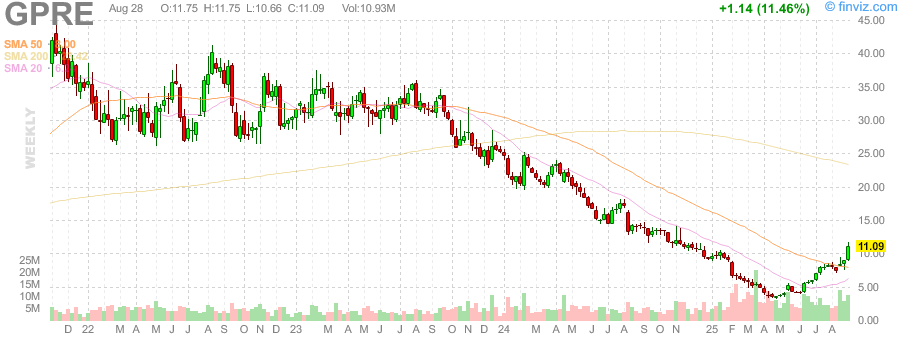
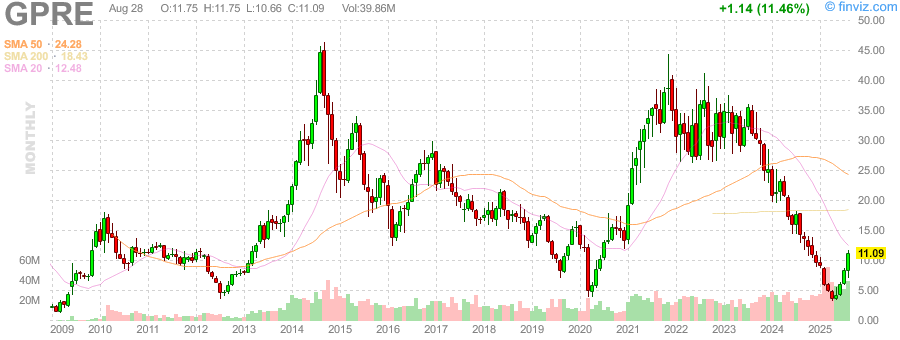
For my momentum strategy today I bought some green plains (GPRE). Seems they don’t go bankrupt after all and the chart looks nice.
Technip (FTI) had to make space and went out with a nice gain of 346%.
And the stock market August is over. A very busy month, here my report:
Dividend portfolio: finviz
Dividends: T,GIS,ABBV,O,CAT,KVUE and APAM
Completely sold: KLG and TRI
Bought new: CNA
Bought additional positions: GIS,PFG,VTRS,GILD and HST.
Actual margin: 100.28% (almost no margin)
Carry premium: 6.41%
Performance YTD: 11.08%, XIRR since 2014 10.66%, since 2020 13.37%
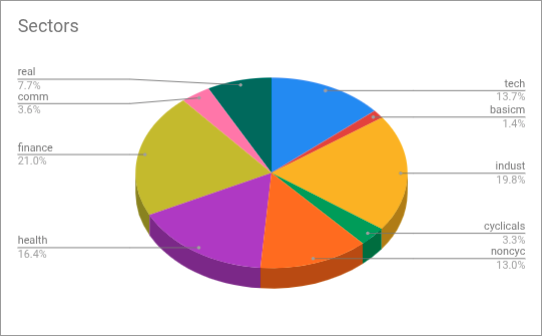
Sectors:
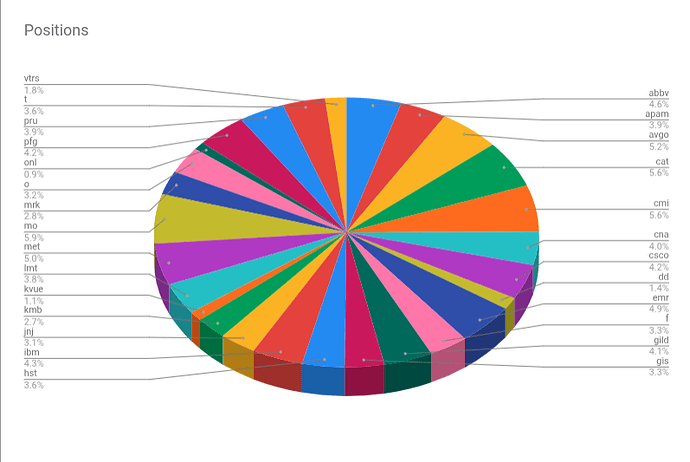
Positions:
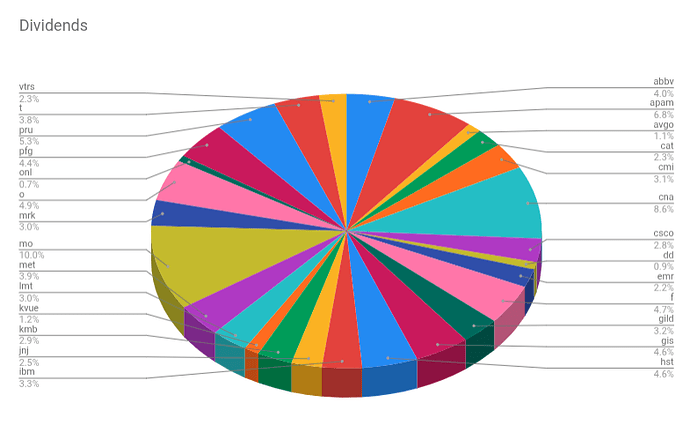
Dividends:
And my momentum strategy:
Finviz
Margin multiplier: 130.7%
Performance YTD: 12.25%, XIRR since 2020 26.81%
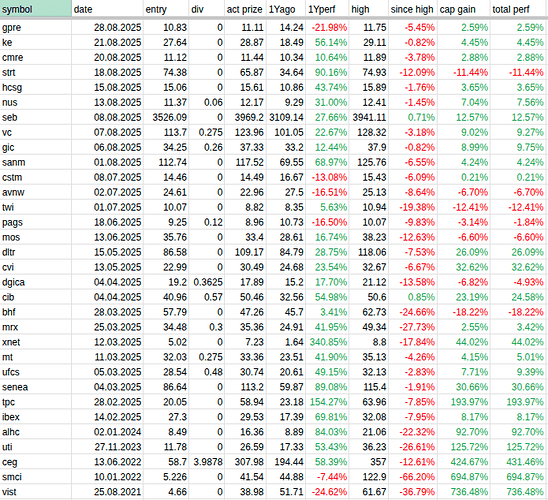
Table of tables:
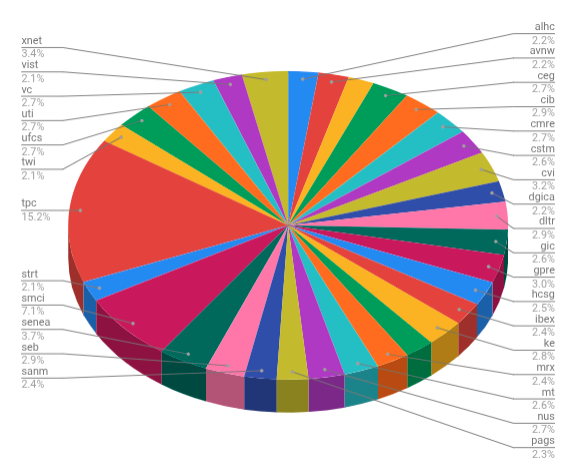
Positions:
As you can see I use the XIRR Formula to calculate performance. This formula works like interest in an account, including dates and amounts of all transactions and compound interest (interest of interest).
I remember having seen some time ago a prospectus where a fund used a simple average for performance. Had some discussions in this forum too where the two were confused with.
So, just for fun, I did calculate the simple average of 5 years and 8 months of my momentum strategy with the following formula: ((actual value + money taken out) / money payed in - 1) / number of months * 12.
The result is 46.57% per year. Quiet some difference to the XIRR of 26.81%. The longer the time frame the bigger the difference. A simple average makes no sense in my opinion, but of course it sounds good. ![]()
Addendum: the simple average for the dividend strategy after 11 years and 8 months is 22.61% vs. XIRR of 10.66%. Dividend investors often use this kind of math to calculate dividend yield on investment…

