Iirc it was detailed for me (when I was holding bnd).
The dividend report was showing actual withholding, not the standard 15% (which is why it shows up late, since they need to get the data for each fund about how each dividend is qualified).
Iirc it was detailed for me (when I was holding bnd).
The dividend report was showing actual withholding, not the standard 15% (which is why it shows up late, since they need to get the data for each fund about how each dividend is qualified).
Maybe I found something more. AlphaSimplex has a managed futures fund in the US by the ticker ASFYX. Portfoliovisualizer has data starting in 2010 for this one. Here a comparison with AQMIX (another managed futures fund) by AQR: click
Both are constituents of the SG Trend Index and both have UCITS variants in Europe.
Whilst AQR hides their UCITS funds behind a login, Virtus (which bought AlphaSimplex last year) displays their fund in the open: Virtus GF AlphaSimplex Managed Futures Fund
Their accumulating R shares have a minimum investment of 5000 USD. At he moment the maximum ongoing charge is 1.35% and there is no performance fee. Some shareclasses are already on IBKR but not this one. The UCITS fund is newly merged, maybe they still need some time.
AQR uses performance fees, if I remember correctly, but I can’t find a document stating it. Other websites claim so though. AQMIX also had a rather horrible performance last decade.
The fees are a bit high, on the other hand there was still performance after fees.
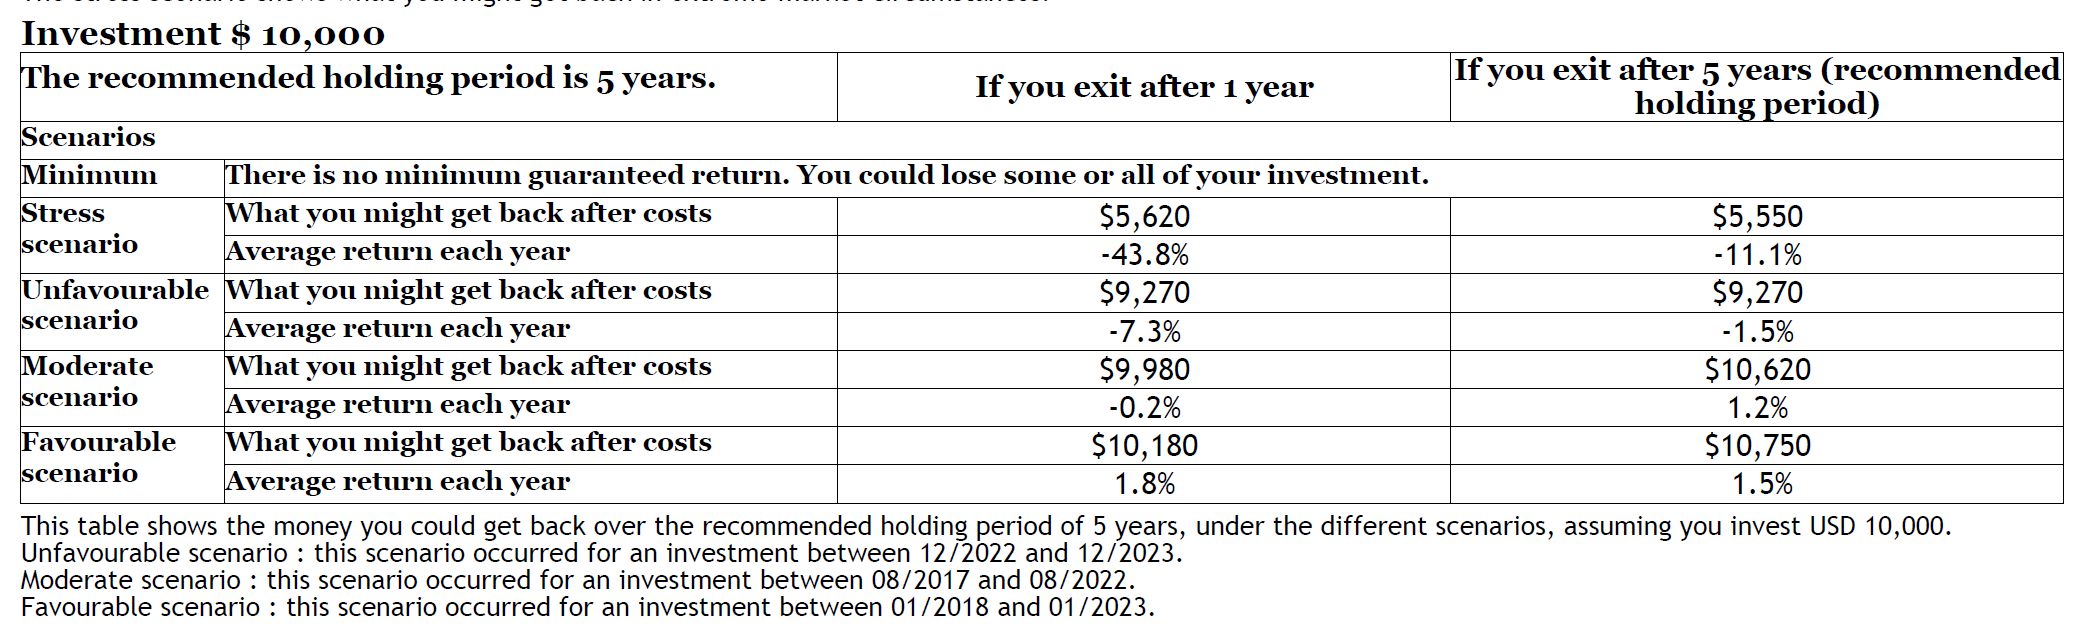
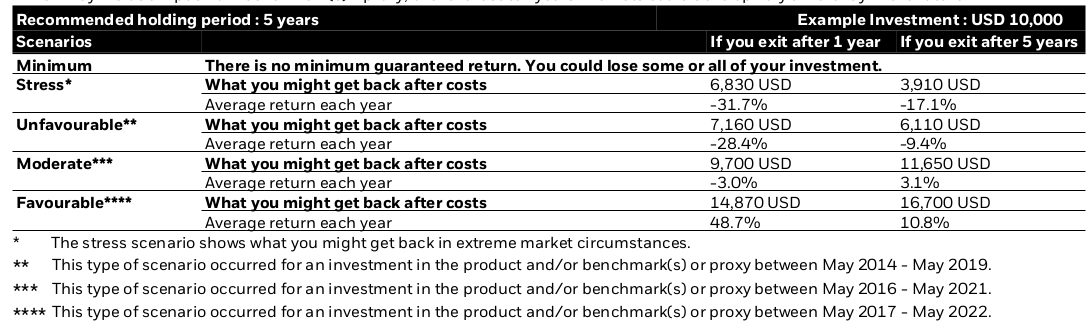
I’m also currently thinking on putting 10% in that fund. What stumped me a bit though was this part in the KID:
Best case scenario they calculate 1.5% return after cost. Is this just some nonsense calculation they have to do for the KID?
I tried to find the KID of the Alpha simplex fund, but couldn’t manage to do, they dont list it under regulatory documents.
Calculation methodology: KIDs for PRIIPs: Performance Scenarios | Full Service Financial Reporting Suite | ESG Reporting | Fund Factsheet | anevis solutions
Just seems very weird to me in this case.
The DBI ucits fund, performed more or less 1:1 like the US counterpart DBMF in the last 1 year (earlier comparison not really possible as the ucits fund is barely over 1 year old). And DBMF had a 10% CAGR since inception in 2019. Of course way too short of a timeframe to judge any longterm performance and MF also ran very well in 2022. But the favourable scenario should reflect that no?
That’s my guess so far.
And this DBI fund, Helix found out about, is the only one interesting to me so far in the ucits world. It seems to be just a slightly more expensive DBMF clone, without withholding tax problems and hopefully less taxable gains.
I also saw this ETF which uses SPX options and BOXX as a form of tail-risk hedging: CAOS - Alpha Architect ETFs
Anyone use this?
I recently added RSBT, return stacked bonds & managed futures. Still pretty new fund and no idea which kind of taxable distributions it will have. Big advantage though is that they only distribute once a year at the end.
My plan for this year is sell right before that day and then see what happens.
Great fund imo. I recommended that one to a friend that uses it.
Depending on how much I lever up in the future I would also incorporate it, with borrowed money.
Mind you, it‘s really crash protection/insurance in the end and it will probably at maximum keep up with inflation over the long term and may underperform inflation. Of course, if a crash happens it will pay off big time.
The options it uses are really deep out-of-the-money though. So for it to move substantially the market needs to drop quite big, quite fast. A slow bear market will make you lose a bit of money on it. See their presentation on the fund, gives you a good overview on it.
A small allocation, say 3%, already goes a long way.
It will however likely lower your total expected return of your portfolio though, if you would alternatively have put the money in higher return assets.
I think the constituents of “SG Trend Index” and “SG CTA Index” are worth a look.
I already hold deep OOM SPX puts in my portfolio as some tail risk protection. But this would certainly be less hassle and probably more efficient.
I dont like that they hold lots of single stock options. This just sounds like advanced stock picking to me
They also fucked up in their fund FIG recently, which is ironically managed by Mike Green. They were short lots of single stock calls of CVNA, which jumped 34%. The fund made an instant -10%.
CTA is a decent fund, with decent tax treatment here in CH, but this makes me want to avoid it.
Cambria will also soon release a pure trend etf: “Cambria Chesapeake Pure Trend ETF”. May be interesting as well.
Taxes are just such a headache with these all and the uncertainty around it.
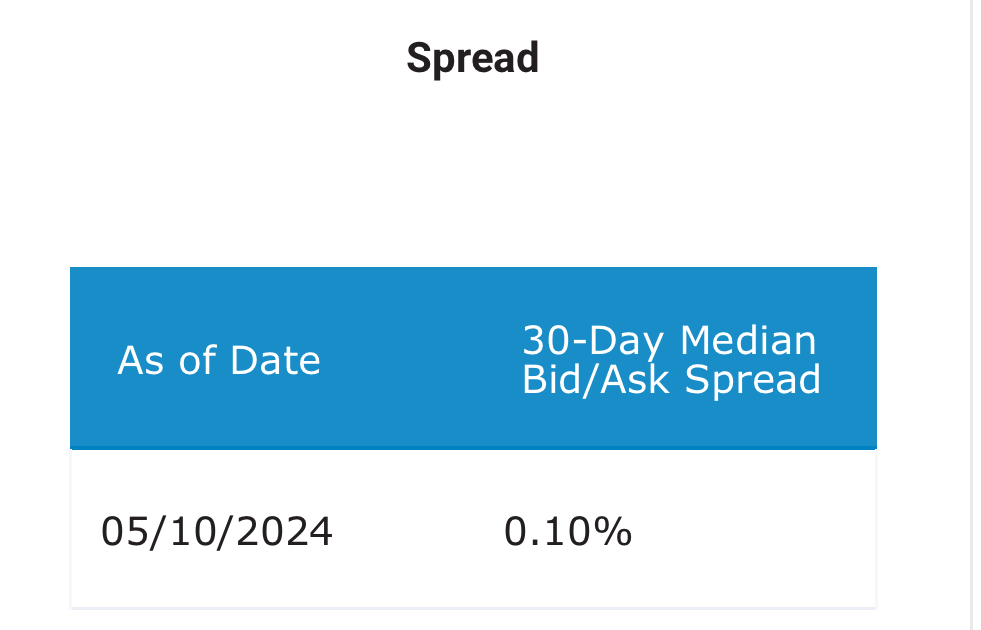
Looks interesting. Spead is massive though. I fear this instrument is too sophisticated for me.
Spread is super low actually
Did you make the mistake of looking right now?
Stock market in the US is currently closed and the spread you see in IB very high therefore. It opens 15:30 our time, so starting like 16:00 spread should be low.
Thank you so much!
I took some time to analyze the constituents of the SG Trend Index a bit. Finding any data was very much not as easy as hitting up justetf.com.
The index started in 2000, and I first wanted to know, which are the most recent and frequent constituents.
To prevent ranking long dead funds I discounted membership with a factor 0.9 per year. So if it is 2024. and the fund was a constituent in 2022, it gets 0.81 (0.9 * 0.9) added to its total score.
Also the names of the funds/strategies sometimes change. I choose to not to add different names together.
The top 10 is:
| Rank | Score | Recent year | Total years | Name |
|---|---|---|---|---|
| 1 | 8.51 | 2024 | 19 | Transtrend (DTP/Enhanced Risk - USD) |
| 2 | 8.33 | 2024 | 17 | Lynx Asset Management AB (Lynx Program Bermuda D) |
| 3 | 7.12 | 2022 | 20 | Aspect Capital (Diversified) |
| 4 | 6.13 | 2024 | 9 | AlphaSimplex Group (ASG Managed Futures) |
| 5 | 5.70 | 2024 | 8 | Graham Capital Management (Tactical Trend A) |
| 6 | 5.61 | 2024 | 9 | AQR Capital Management (Managed Futures) |
| 7 | 5.09 | 2020 | 19 | Campbell & Company (Campbell Managed Futures) |
| 8 | 4.88 | 2024 | 7 | Systematica Investments (BlueTrend) |
| 9 | 2.97 | 2016 | 12 | Graham Capital Management (K4D-15V) |
| 10 | 2.79 | 2022 | 4 | ISAM LLP (Systematic Trend) |
| 11 | 2.79 | 2022 | 4 | Man Investments (Man AHL Alpha) |
| 12 | 2.66 | 2015 | 11 | Winton Capital Management (Diversified Macro) |
| 13 | 2.26 | 2020 | 4 | GSA Capital Partners (GSA Trend Fund) |
| 14 | 1.99 | 2015 | 10 | Millburn Ridgefield Corporation (Diversified) |
| 15 | 1.90 | 2024 | 2 | Aspect Capital (Core Diversified) |
| 16 | 1.90 | 2024 | 2 | ISAM LLP (Vector) |
| 17 | 1.90 | 2024 | 2 | Man Group plc (Man AHL Alpha) |
| 18 | 1.90 | 2024 | 2 | PIMCO LLC (PIMCO Trends Managed Futures) |
| 19 | 1.76 | 2016 | 5 | Man Investments (Man AHL Diversified) |
| 20 | 1.71 | 2023 | 2 | Winton Capital Management (Winton Trend) |
| 21 | 1.57 | 2010 | 11 | Chesapeake Capital (Diversified) |
| 22 | 1.34 | 2009 | 10 | Sunrise Capital Partners (Expanded Diversified) |
| 23 | 1.01 | 2018 | 2 | Man Investments (AHL Alpha) |
| 24 | 1.00 | 2013 | 4 | Altis Partners (GFP Composite) |
| 25 | 0.95 | 2007 | 8 | Henry, John W. & Company (SAP) |
| 26 | 0.82 | 2016 | 2 | SEB Asset Management (SEB Asset Selection) |
| 27 | 0.76 | 2008 | 5 | Graham Capital Management (Diversified) |
| 28 | 0.73 | 2021 | 1 | GSA Capital Partners (Trend) |
| 29 | 0.66 | 2014 | 2 | Brevan Howard (Systematic Trading Fund Ltd Class B USD) |
| 30 | 0.59 | 2019 | 1 | BlueTrend Fund Ltd Class A |
| 31 | 0.50 | 2004 | 5 | Dunn Capital Management (WMA) |
| 32 | 0.46 | 2005 | 4 | Rotella Capital Management (High Yield) |
| 33 | 0.35 | 2014 | 1 | Eagle Trading Systems (Global) |
| 34 | 0.31 | 2013 | 1 | ISAM (Systematic Trend) |
| 35 | 0.25 | 2011 | 1 | Tudor (Tensor Fund Ltd.) |
| 36 | 0.21 | 2009 | 1 | Graham Capital Management (Discretionary – 6V) |
| 37 | 0.21 | 2009 | 1 | Transtrend (DTP/Enhanced Risk / USD) |
| 38 | 0.19 | 2008 | 1 | Campbell & Company (Global Diversified Large) |
| 39 | 0.19 | 2008 | 1 | Transtrend (DTP/Enhanced Risk – USD) |
| 40 | 0.17 | 2001 | 2 | Eclipse Capital Management (Global Monetary) |
| 41 | 0.17 | 2001 | 2 | Henry, John W. & Company (Financials & Metals) |
| 42 | 0.17 | 2007 | 1 | Graham Capital Management (Absolute Return) |
| 43 | 0.17 | 2007 | 1 | Nestor Partners (Private Client) |
| 44 | 0.11 | 2003 | 1 | Dunn Capital Management (TOPS) |
| 45 | 0.11 | 2003 | 1 | Graham Capital Management (K4D-10V) |
| 46 | 0.09 | 2001 | 1 | Barep Gestion (Barep Epsilon Euro) |
| 47 | 0.08 | 2000 | 1 | Henry, John W. & Company (Original) |
| 48 | 0.08 | 2000 | 1 | Hyman Beck & Company (Global) |
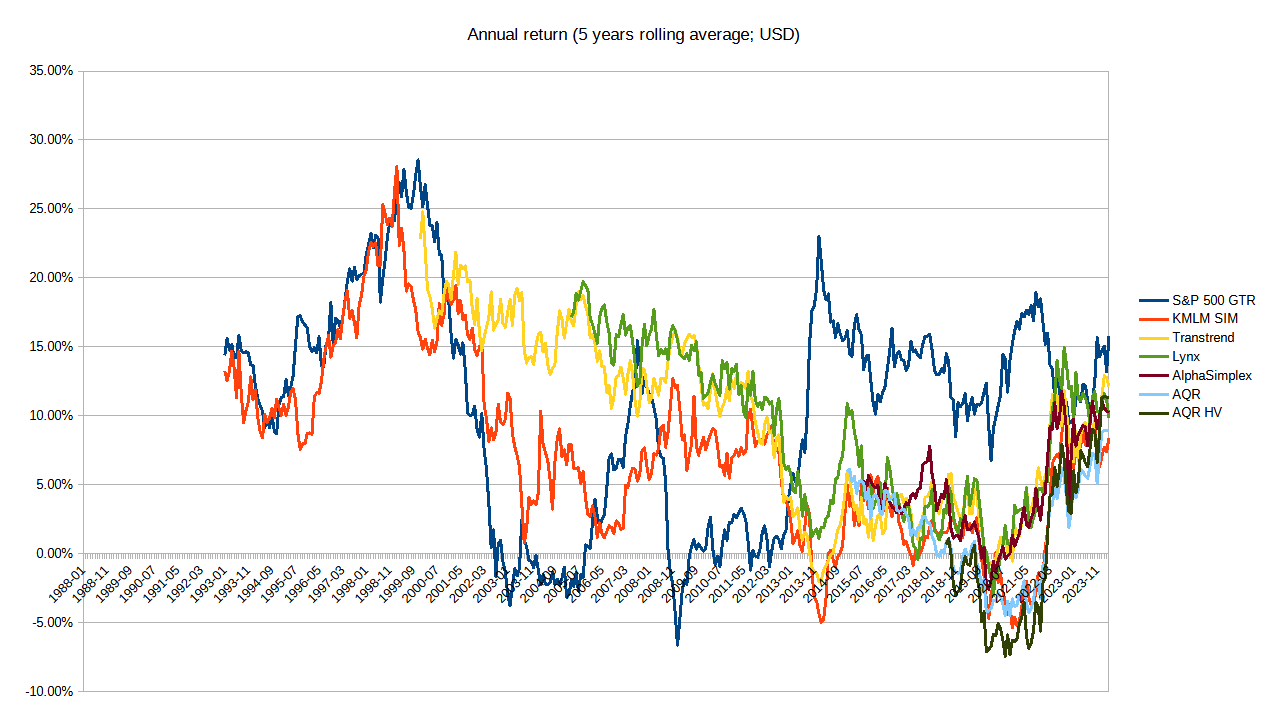
Of the top 9 (gave up at #9) I could only find monthly data for 4. The data must exist, as shown by the screener on rcmalternatives.com (lots of funds, cool screener). Anyway, the graphs:
| Legend | Source | Kind | Link | Alteration | Type |
|---|---|---|---|---|---|
| S&P 500 GTR | S&P | Index | yahoo finance | None | Gross |
| KMLM SIM | Kraneshares | Simulation | kraneshares | 0.9% ER | Net |
| Transtrend | Transtrend | Simulation | transtrend | None | Net |
| Lynx | Linxhedge | Simulation | linxhedge | None | Net |
| AlphaSimplex | Nasdaq | Product | yahoo finance | None | Net |
| AQR | Nasdaq | Product | yahoo finance | None | Net |
| AQR HV | Nasdaq | Product | yahoo finance | None | Net |
Fees are best-effort on my side.
| Legend | Full Name | Class | Currency | ISIN | Ticker | Min. Invest | Management Fee | Performance Fee |
|---|---|---|---|---|---|---|---|---|
| KMLM SIM | KFA Mount Lucas Managed Futures Index Strategy ETF | ETF | USD | US5007676522 | KMLM | N/A | 0.90% | none |
| Transtrend | Transtrend Fund Alliance – OmniTrend | N/A | USD | LU0210663620 | N/A | 1’000’000 | 1.00% | 16.00% |
| Lynx | Lynx UCITS Fund | I | USD | IE00BGBVCN02 | N/A | 250’000 | 1.00% | 18.00% |
| AlphaSimplex | Virtus AlphaSimplex Managed Futures Strategy Fund | I | USD | US92835M4226 | ASFYX | 100’000 | 1.20% | none |
| AQR | AQR Managed Futures Strategy Fund | I | USD | US00203H8593 | AQMIX | 5’000’000 | 1.05% | ? |
| AQR HV | AQR Managed Futures Strategy HV Fund | I | USD | US00203H8593 | QMHIX | 5’000’000 | 1.45% | ? |
There is likely heavy survivorship bias. We are talking about the biggest managed futures trend-following funds, that stayed around the longest, that did so until most recently. And for over half of them I have trouble finding data. I can’t reconstruct it, but I think a the bigger Aspect Capital and Graham Capital funds got axed recently.
There are 2 interesting splits of 5 year rolling returns for managed futures:
The Transtrend and Lynx data is a simulation of net returns by their fund company. They did offer their program during this time. So, I hold it possible that they did not torture the numbers too much.This would mean that even after high fees (including performance fees) they kept up with stocks.
The products those returns describe have high initial investment minimums. For many I found some alternatives, but they come with higher fees.
On the other hand, managed futures ETF seem to be booming. For example:
In general I found finding information hard (what products exists, what are the returns, could I buy them?). The information structure is just not competitive with UCITS ETF on justetf.com. How would an independent asset manager go about that (assuming they are not optimizing for hidden charges… hm, or even then)?
The best book about trend following (TF) is from Michael Covel and clears up many myths and questions around TF: https://www.amazon.de/-/en/Michael-W-Covel/dp/1119371872/
In general I found finding information hard (what products exists, what are the returns, could I buy them?). The information structure is just not competitive with UCITS ETF on justetf.com.
UCITS requires you to disclose your holdings on a daily basis. Firms don’t want to do that to protect their IP. Further, a UCITS structure limits your ability to implement a managed futures strategy due to VaR and other constraints. Many of the offshore vehicles (Cayman, Guernsey, etc) run strategies with 2x the volatility target of a UCITS (20-25% vol vs half).
How would an independent asset manager go about that (assuming they are not optimizing for hidden charges… hm, or even then)?
There are websites where you can find longer and archived track records. For example, you can register for free at https://www.iasg.com and look up track records of managers which report to IASG. If you have access to a Bloomberg terminal, you can find most funds returns there.
I’m invested into multiple offshore structures of TF funds. One of the oldest firms in the industry, DUNN, has a nice portfolio builder tool on their website: Portfolio Builder - Dunn Capital
Their European representative, who lives in Switzerland, runs a great podcast series about managed futures: https://www.toptradersunplugged.com
Not sure if any of above is helpful. I’m barely scratching the surface.
There are no dividend payments. No income or capital gains tax by Caymans authorities applied to subscriptions and redemptions for investors in a Cayman fund. Zug tax authorities didn’t count as income so far.
As a byproduct I found this nice interview with Andrew Beer, the guy behind DBMF ETF. He talks about:

Transcript on rcmalternatives.com.