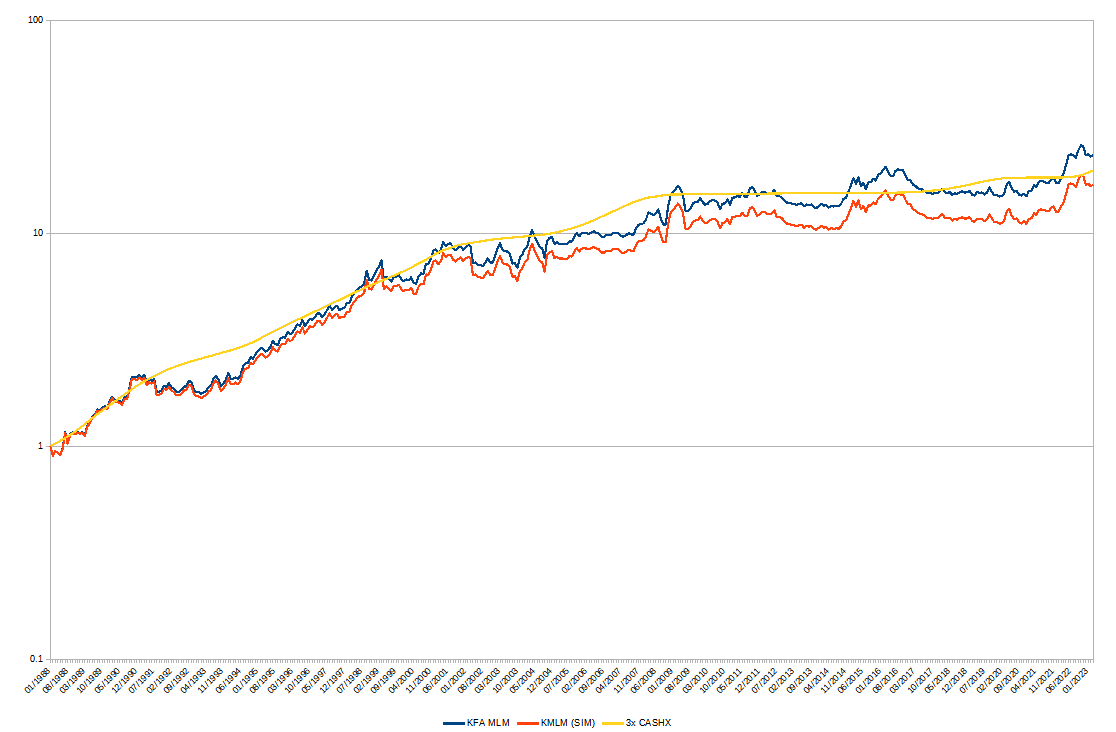
I took the monthly index data of KFA MLM (index replicated by KMLM) from their website. I subtracted their TER of 0.92% spread evenly over the year. They actually replicate this index for customers since 1993. The index is rules based (and the rules don’t look overly complicated). Both reduce the influence of retroactively choosing a strategy that fits the past best.
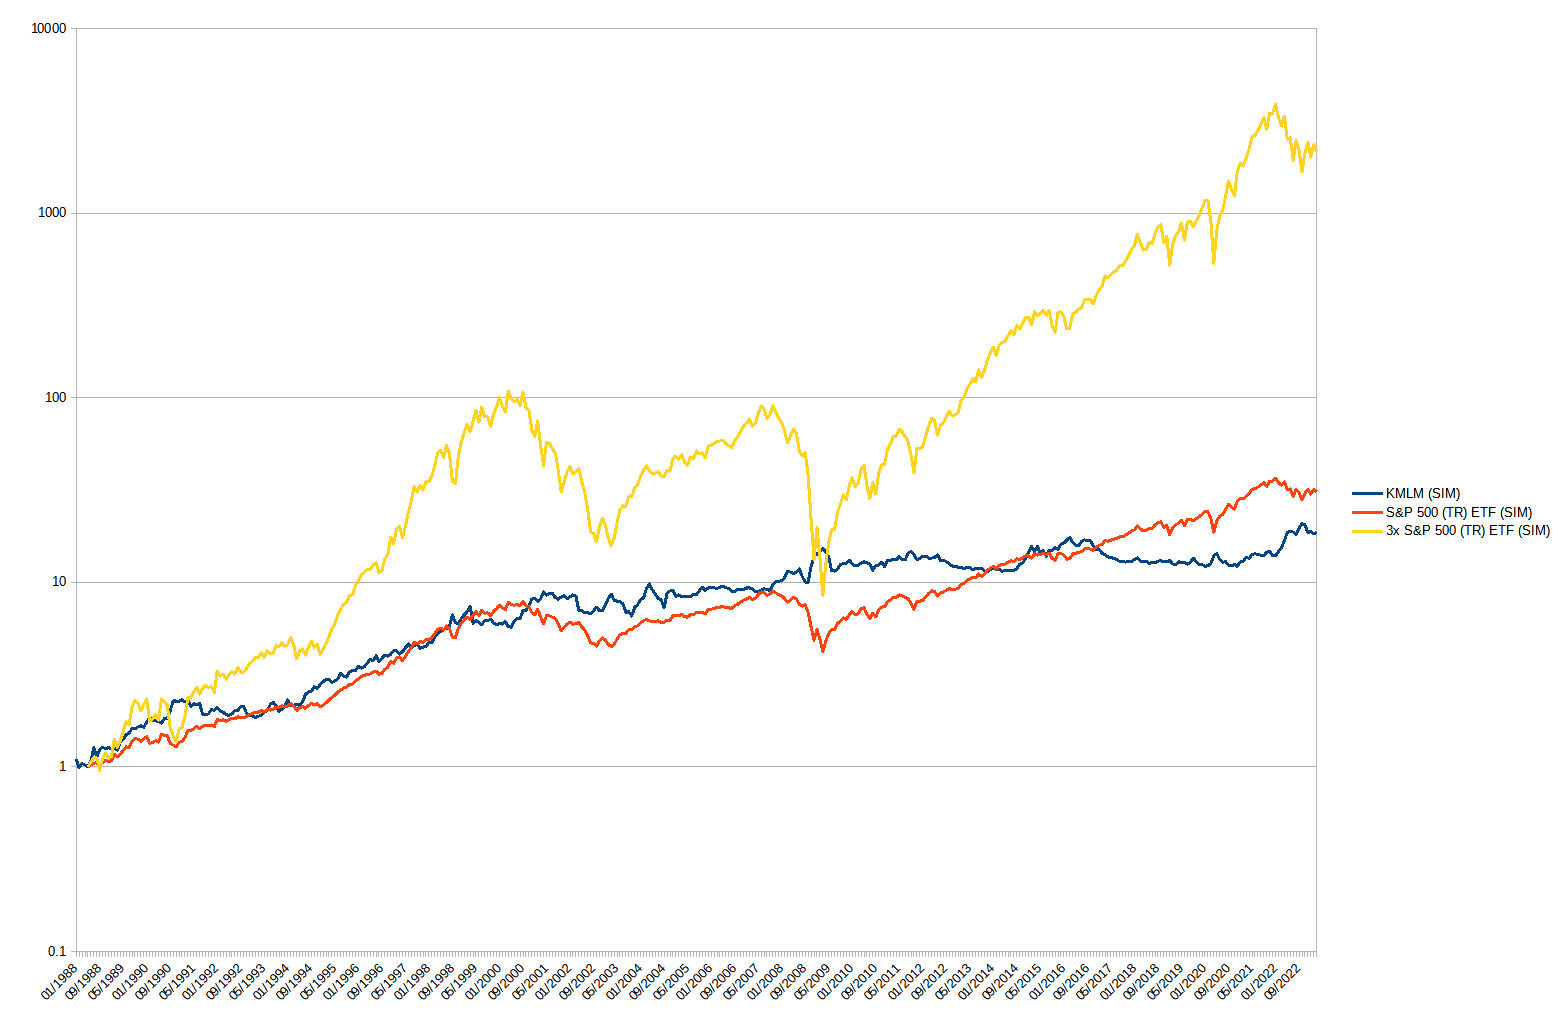
The S&P 500 Total return data I got from Yahoo. I made some assumptions for expenses. The 1x has a TER of 0.1% per annum. The 3x has a TER of 1% and borrows the CASHX from portfoliovisualizer plus 0.5% added swap premium two times (for the 2x in excess). This is roughly how UPRO works (Reddit). There should be another small error because I took the monthly total return. So for the daily 3x I calculated the daily return as the geometric average of an average month:
Who knows. What we do know is that there’s always a trade-off to everything in investing (aka no free lunches except diversification, probably). That includes trend-following.
Something that I can’t explain is how stocks and KMLM (SIM) both rise till 2000. After that they are still anti-correlated, but KMLM (SIM) is really flat. 2010-2020 had a similar stock rally.
According to them, they profit from absorbing risk the market wants to hedge against. What made those 2 periods differ so much?
Or is it that trend following managed futures have been overrun by capital since, depressing the returns? And we are the dumb rubes buying future returns at past performance?
The expected return on a short future should by arbitrage be the risk-free rate (plus the cost of handling the underlying asset, minus any yields (e.g., interest)). KFA MLM is leveraged 3x, but they have long and short positions.
Their T-Bill collateral should explain 1x.
The other 2x can’t really be explained by “Periods of volatility create opportunities for profit, as investors assume risk that hedgers wish to avoid.”. That would mean the time before 2000 was much more volatile than after. But I can’t see that: Some commodity charts
Maybe it has to do with the fact that 3/4 of the futures are forex and bonds? If we buy long futures, we should get the yields minus the risk-free rate. But neither the yields on bonds(EDIT: not true, see below) nor on money market are double of CASHX. The exchange rates to USD also didn’t move enough.
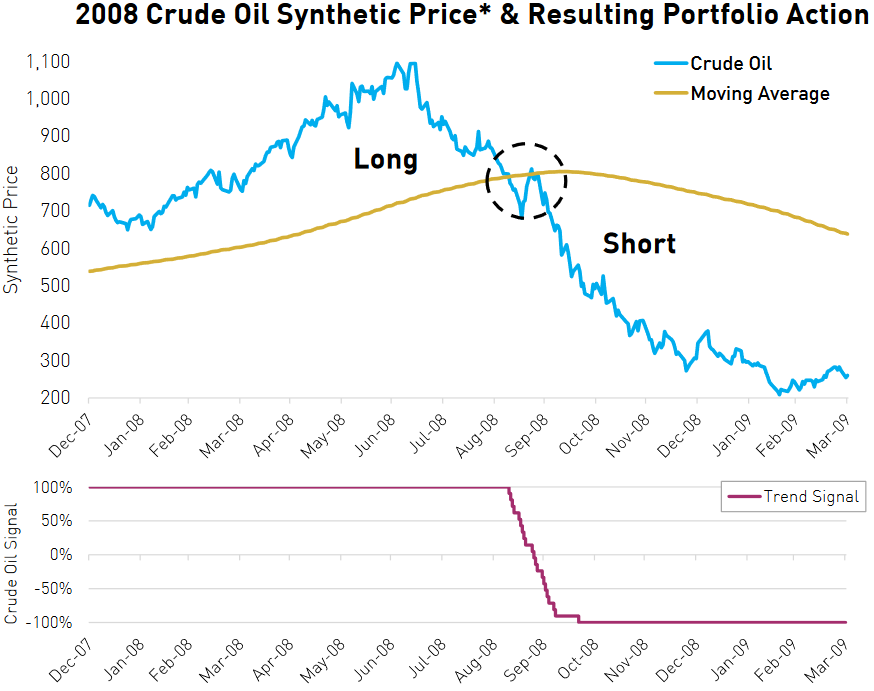
If understood correctly, they do weight their asset classes (commodities, bonds, forex) by some measure of risk parity. But within a basket everything is equally weighted. They can only go long or short. But they do so with trend-following against a moving average:
So the risk parity will not be able to positively influence picking long or short. Therefore this should only explain some volatility reduction and maybe a slight performance increase.
I went over the numbers once more and found my explanation. It could benefit from critically picking it apart. Thank you.
Bonds
I was wrong about the return on bonds. Their total return was double that of cash during the period from 1992 - 2023 (data from Portfoliovisualizer). Let’s calculate a rough factor by averaging the bond returns and dividing through cash returns. Like this:
factor = \frac{average(bond1, bond2)}{cash}
1992 - 2023
Asset
CAGR
Stdev
10-year Treasury
4.79%
7.29%
Global Bonds (Unhedged)
4.87%
7.52%
Cash
2.35%
0.59%
Factor
2.06
If we cut that up into 3 time frames:
1992 - 2000
Asset
CAGR
Stdev
10-year Treasury
6.62%
6.87%
Global Bonds (Unhedged)
7.37%
7.82%
Cash
4.58%
0.26%
Factor
1.53
2000 - 2008
Asset
CAGR
Stdev
10-year Treasury
7.14%
7.29%
Global Bonds (Unhedged)
8.25%
7.52%
Cash
3.26%
0.59%
Factor
2.36
2008 - 2023
Asset
CAGR
Stdev
10-year Treasury
2.66%
7.40%
Global Bonds (Unhedged)
1.90%
7.63%
Cash
0.75%
0.32%
Factor
3.04
Expected return
So let’s assume we only choose long and short according to expected return and don’t care to much about volatility. Also let’s assume handling cost of the underlying is negligible (would increase return of short commodities).
Commodities futures need to pay the risk free rate. The bonds need to pay that too, but had double the return of the risk free rate. Currencies need to pay it, but also return it.
Then our asset classes should return the following:
Asset
Position
Return
Weight
Leverage
Total
Commodities
short
1x
25.0%
3x
0.75x
Global Fixed Income
long
1x
42.5%
3x
1.275x
Currencies
-
0x
32.5%
3x
0x
Total
2x
Together with our collateral of 1x we get the expected 3x.
KFA MLM
The actual index follows another strategy. The above would probably have horrible volatility. Still it stands to reason that their elaborate strategy manages to reduce volatility. But in the end they don’t really manage to beat the fundamentals. That’s what I would expect from a strategy.
It would be interesting to know if the currencies actually contribute to the return (different from my assumption).
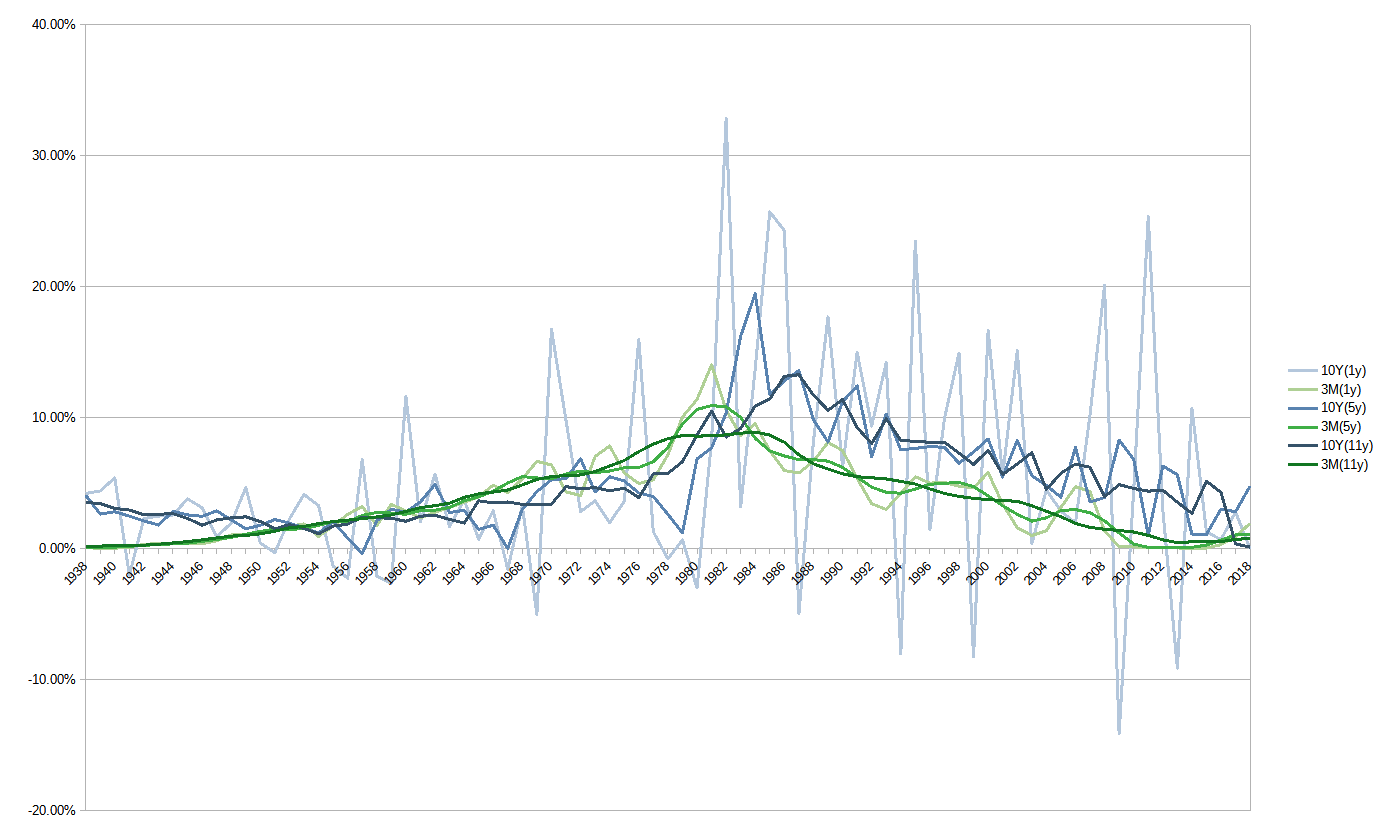
The coming market era might not be so kind to bonds. The worst case would be if they return the risk free rate. There would be no return on futures. If they perform significantly worse, going short will yield nicely. As all of this is coupled to the risk free rate, I would expect better returns, if interest keeps rising.
Some long-term data on 10-Y Treasury Bonds and 3-M Treasury Bills. Shown are the total return yields. Geometric averages centered on each year (looking forward and backward equally) over 1, 5 & 11 years.
Trend following / moving averages strategies seem to have a very good effect on reducing volatility for a rather small reduction in return (=> more leverage possible => more return).
If you speak German or can use a translation engine: Compare to ZahlGrafs Exzellente Abenteuer. In the last part of the series they also compare such strategies against vanilla portfolios. Still, more DD on my part is needed, before I believe it.
Concerning KMLM: I’m talking out of my ass. I found some data and read up on some concepts. They seem to give an explanation, but I just took the first explanation that fit the data. I’m by no means an accomplished hedge fund manager. But if my hypothesis is true, KMLM will not perform, because interest rates are going to rise and they are under-invested in commodities and over-invested in things that have no return. They did not manage to beat the fundamentals in 30 years. They will not in the future.
Do they have to beat the fundamentals, or do you think an uncorrelated stream of returns would be beneficial to your portfolio Sharpe in it’s own right?
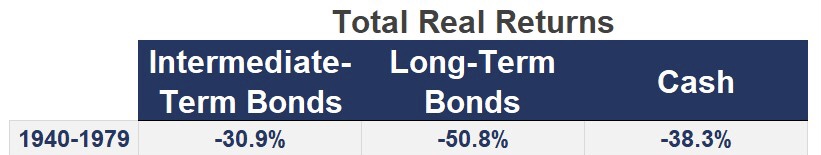
I’m not comparing trend to equity, but to bonds, because I need to lower portfolio risk before FIRE (lower my equity beta to reduce sequence risk in retirement). Bonds can have like 40 years of negative real returns. Can trend too?
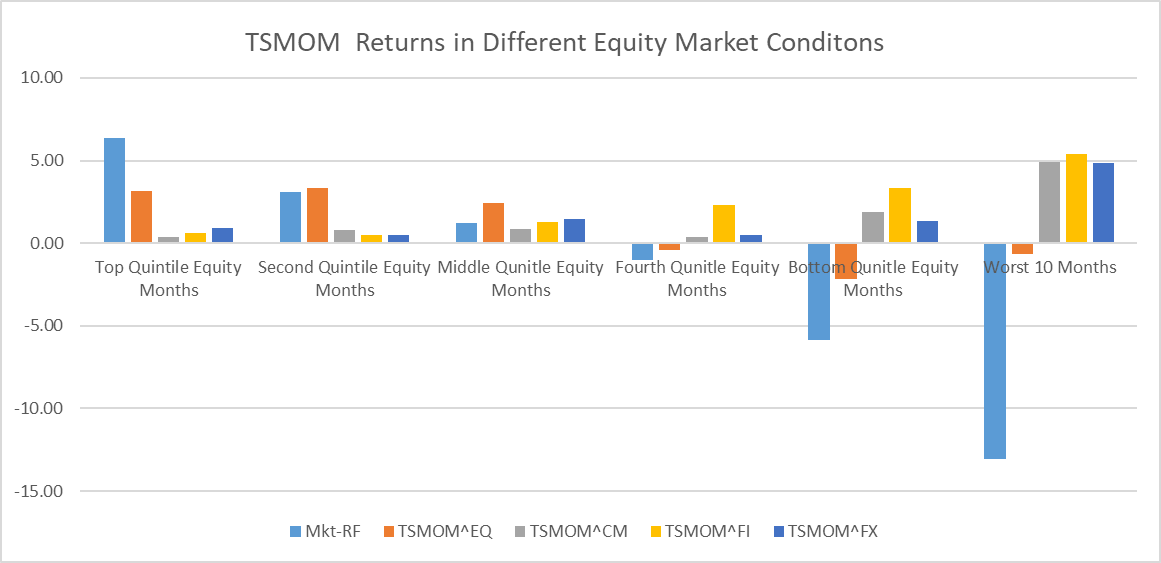
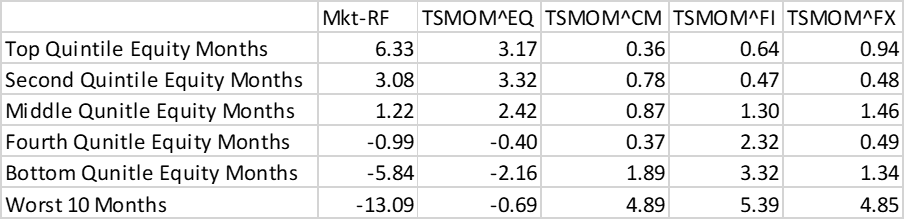
BTW, here’s some further food for thought. Let me know what you think of it if you got some time. It’s written by a trend shop, so beware TSMOM’s the buzzword, you might want to run a regression
Sure, but sharp doesn’t only have a divisor. If it dilutes the returns of the portfolio, because it doesn’t have any, your Sharp will not necessarily improve.
If the underlying premium disappears for an extended period, will trend still be able to deliver? Different doesn’t imply good.
Your paper says it has always delivered (with an annual 18% excess return before cost for a (monthly?) volatility of 10% since 1880). I will probably dig in deeper once I get some more time. If you find some more complete data, I’m interested. Their provided TSMOM data is only from 1985 and has only the mixed performance per asset class.
Also, thank you for finding this paper. I’m still interested to know, how and why did you find this information? I think there is so much useful knowledge out there, and it is so easy to not even notice that it exists. Maybe I can build some knowledge about finding things that I don’t know exist.
Excellent, looking forward to your thoughts on this. As to your question: I don’t work in finance, just very much interested in the field (also due to my early retirement plans). So I spend a lot of time (probably too much) reading financial research and other publications, listening to interesting podcasts etc. Everything publicly available online, no secret sources
That’s the thing. It’s all out there, free, possibly even condensed and well-written. But you will walk past it, even look right at, totally ignorant of what it is.
One shining example is this post on real estate by @oslasho. I read past it in April. A bit less taxes, how good could it be? In May I remembered (or reread?) the post and started digging. Lo and behold, the taxes are down to about 10% total on earnings (= cantonal tax + 1/2 federal tax, for legal entities). It is paid by the fund and losses are deducted. You pay nothing. No income tax on dividends, no wealth tax on shares, nothing.
But there is so much noise. Could be spam, things you already know, things that are useful for other people, things that are not enough useful, useful things that lack too much information or are too difficult for you. You can not follow up on all of them. And I wonder if this could be improved.
This forum still has an ok-ish signal per time invested for me.
How do you find the papers? I don’t assume you browse a database of papers for interesting sounding titles. So I guess the podcasts reference them then?
I recently found things by reading of potentially interesting words and concepts here, followed by digging with the search engine till I understand.
Maybe there even is good abstracted knowledge about this activity somewhere? Should be useful for an age where you don’t have information because it is buried by the flood, instead of it just not existing.
@Dr.PI Sorry, this is off-topic. Could you split our 2.5 posts into something like “Navigating the information flood”. I now have a concept, might start digging later. Others might have contributions, too.
I think we should not forget that bonds have had a historically unprecedented bull run of ~40years since the 80ies. So it comes at no surprise that trend returns can largely be explained by bond returns in backtests to the 90ies, since trend has been long bonds for that period.
Now what happens if this situation inverts, e.g. a 40 year bear market for bonds, hurting 60/40 investors big time? Trend, an opportunistic strategy, will move from long to short bonds and capture the returns.
Also, lets not forget that trend does not only consist of US treasuries, but diversified bonds, thereby reducing single-asset risk. And more importantly, apart from bonds it also holds very diverse commodities and currencies, with different trends to capture. So it’s not like just levering up a single asset.
This makes it far less path-dependent. Which is incredibly important for mitigating sequence risk in retirement. Bonds suck for 20 years? No problem, trend goes short. Bonds AND commodities suck for 20 years? No problem, trend goes short both. And then there’s also currencies in the mix. To me, that seems far superior to holding bonds & commodities long only.
There definitely seems to be a risk parity element to trend. But, in comparison to classic risk parity strategies, trend adds a second dimension by being able to go short assets. This could lead to more diversification compared to long-only risk parity strategies.
Indeed, expected returns are very hard to tell, if not impossible. We just don’t have enough data. But same holds true for equity.
I cite Robert Novy-Marx:
"When I talk to investment advisors, I love to ask them, “What is the equity premium?” I get a range of answers, but almost everyone thinks it’s somewhere between 4 and 7% and 6% is what I hear most. Then when you ask people where they come to that number, they say, “Well, you look at the last 100 years and it’s been 6%.”
That’s true. If you look at 100 years of data, you see a 6% equity premia, but if you get that mean equity premia by running the regression, it also gives you a confidence bound on your estimate. It turns out that the estimated equity premium that you get by looking at the past data is 6% plus or minus the standard deviation of like two and a quarter percent.
So, if you just are a frequentist probablist, you do the frequentist statistics, you’re basically saying you’re 95% sure that the true equity premium is between 1.5 and 10.5 percent. You just have no idea. With 100 years of data, we can’t come close to agreeing on what the equity premium is."
In my proper words: In finance, nobody knows nothing, and anyone who tells you otherwise is BSing. It’s not an exact science. Markets and prices are social constructs, purely man-made, do not adhere to natural laws like physics. So imo, the best and only bet we got is diversification.
Can anyone tell me if the capital gains distributions from funds like KMLM are subject to US witholdings taxes? And if so, are we able to claim them back?
Because they are considered capital gains mostly and are not taxed by Switzerland, I could imagine that we cant claim them back with DA-1?
Mit dem Lesen und der Teilnahme an diesem Forum bestätigst du, dass du die Forum-Richtlinien gelesen hast und damit einverstanden bist sowie den Haftungsausschluss auf http://www.mustachianpost.com/de/ akzeptierst.