Typically, the FIRE community is very much focussed on the USA, with a lot of FI-methodology being created there and with long-term backtesting data mostly available for the Dow Jones or S&P500 indexes.
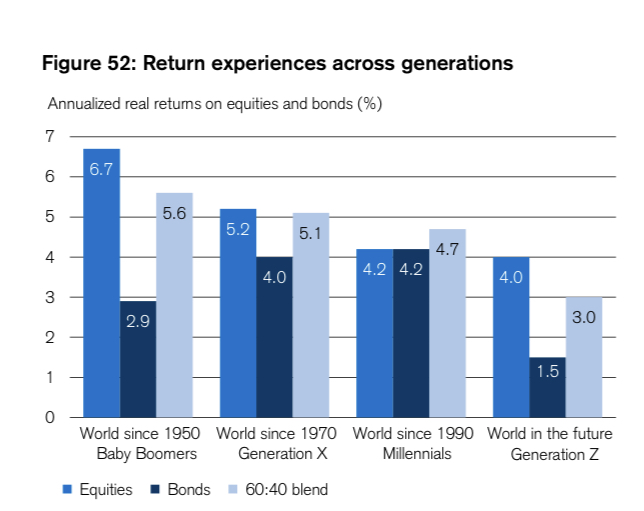
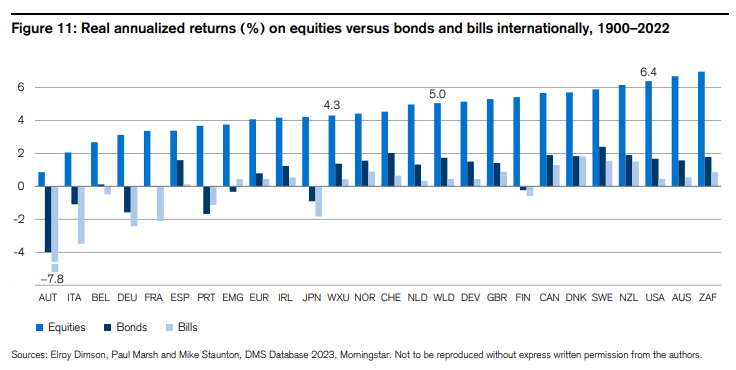
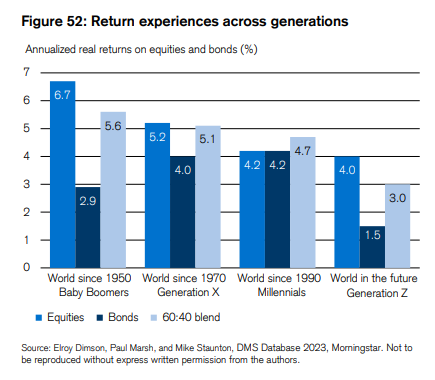
Using long-term data, recent bear-markets such as the 2000 internet bubble burst, 2008/9 crisis or Covid hardly show up, putting our own short memories in perspective. And it shows that for the last 123 years, a real annualized return of 5% was possible when investing in world equities. In short, nothing new for FIRE people, but rather a deep-dive into country-specific markets, for those who like to add a little something to their All-World ETF.
Excellent! Many thanks for the source. I was trying to calculate this kind of data by myself, but didn’t have enough time to do it yet. Inflation adjusted 5% return of global equity market is even at the higher limit of my guestimated 4-5%.
This gives such a different picture to the “World since ~1990” - How much do you expect from your investments? - #5 by rolandinho - “30 (to 35) glorious years”, difference is that it’s from 1985, and only US and Europe. World equities with 1990 as a starting point has a big Japan weight (almost 50%), and we all know what happened to that next.
Sure, it is very easy to outperform the global world index. You just overweight countries that are going to outperform and underweight countries that are going to underperform.
If you are putting your money in the market in 1900? Sure!
No one knows going forward. The US have experienced exceptional growth because investors worldwide have wanted to put their money into their companies (for various reasons). The US can continue to outperform, or other countries can rise and get more of the share that the US have had up to now.
I’m sure you’re being sarcastic but just for the other people reading, that company can happen to be Enron: all the trappings of doing good, but cooking the books under the surface, and nobody noticing. When it goes underwater, it takes all of your bet with it.
You’d be really unlucky in picking an Enron of all companies.
I’m not that sarcastic after all. Just saying that beating an index isn’t that hard, if you (concentratedly) deviate enough from it. It goes without saying that this also carries a substantial tail risk.
I’m not fooling myself, most DCF models use a discount rate of 10-15% when evaluating a business. If you want at all to invest in a company, it has to beat the market by at least a few percent, no? Otherwise why bother. I hope that much is logical.
Why do you adjust for inflation? You assume that real estate is going to appreciate with inflation? The land probably will, but the building will depreciate down to zero over the long term, so it’s a mix. That real estate index is probably comparing the transactional prices of ever newer houses or sth.
Discount rates are used to valuate businesses, yes, but this is not what you earn because some companies fail to produce estimated earnings or even go bankrupt. Historically you earn more like I said, 4-5% real, inflation adjusted yield on a global stocks portfolio. And I am talking about the real yield because the nominal yield can be also 1 000 000 000 000 000 000 % in Zimbabwe dollars.
And this is not an off topic, as you want to compare RE yield with stocks yield. Granted, CHF devaluation and Swiss inflation is probably the lowest from all currencies and countries.
There are lot of variations of this, but according to Big Ern. “The average compound return adjusted for inflation from 1922 to 2022 was 7.2%.”
Ps. commented reading topic from top, but I see some others put also similar numbers from 7% almost 8% in different time frames and etc.
Some time ago I used to see articles stating that there are from 60 to 70k free apartments (Size of Bern?) in Switzerland. Of course majority are in sub-urban areas.
Yes, there is big immigration and now we have some refugees from Ukraine etc. Demand is high.
But, I think I asked this before - when would Pension Funds will decide to swap RE to other assets? Maybe never?
PPS. my PF fund gave me last year 7% despite incurring loss on investments. That’s interesting business model.
But I don’t want to invest in a company. Risks of an investment in a single stock are well known and recently we had some textbook illustrations. My goal is to invest in the stock market and to beat inflation by those few percents that you have mentioned. Namely, 4-5 according to the historical data.
On a related note, I see that the underlying data is available for a measly USD 6’000.
I’m making an Excel sheet for our retirement analysis which includes Swiss taxes, AHV, etc. To keep the simulation part as simple and thus understandable as possible, I intend to use historical real returns and just have it do a rolling analysis over time windows and some geographies (as we don’t know which history could be representative for us going forward).
So… I’m looking for long time series of real annual total equity returns for a couple of geographies, like world, US, UK, Germany, Switzerland - as in the report. I have found the Jordà-Schularick-Taylor Macrohistory Database, which has nominal total equity and bond returns, as well as countries’ CPI (which I guess I could use as a proxy for inflation). If anyone knows a better resource that goes back at least until the second world war, that’d be helpful.
You can find the figures since 1925 for Switzerland in the above mentioned Pictet study (see oslasho’s post). They have both nominal and real figures per annum for equities and bonds.
I have built something similar and ended up with a Jupyter Notebook (& lots of spaghetti code). Excel became unwieldy at some point. So far I used the data that Big ERN kindly provided in his toolbox as input:
Mit dem Lesen und der Teilnahme an diesem Forum bestätigst du, dass du die Forum-Richtlinien gelesen hast und damit einverstanden bist sowie den Haftungsausschluss auf http://www.mustachianpost.com/de/ akzeptierst.