Hello,
I read many various mid- / long-term calculations from mustachians on various blogs or forums and noticed that it’s not uncommon to see people expecting a good 5-6% yearly rate of return from their investments.
Doesn’t that sound a bit optimistic? What would be a reasonable return rate?
What’s the time horizon? 5-6% might be ok, but over very long time period, on shorter time periods there’s a fairly large sequence of return risk, you can do monte carlo simulation there are a bunch of them online (e.g. https://www.portfoliovisualizer.com/monte-carlo-simulation)
6% kind of / unofficially applies in USD terms mostly, IMO. So in CHF terms the ROI will probably be lower corresponding to exchange rate gain CHF:USD in the same time you are analysing.
So VT will go up 6% p.a. (incl full dividend re-invested) but VWRL would only go up (6% - CHF appreciation).
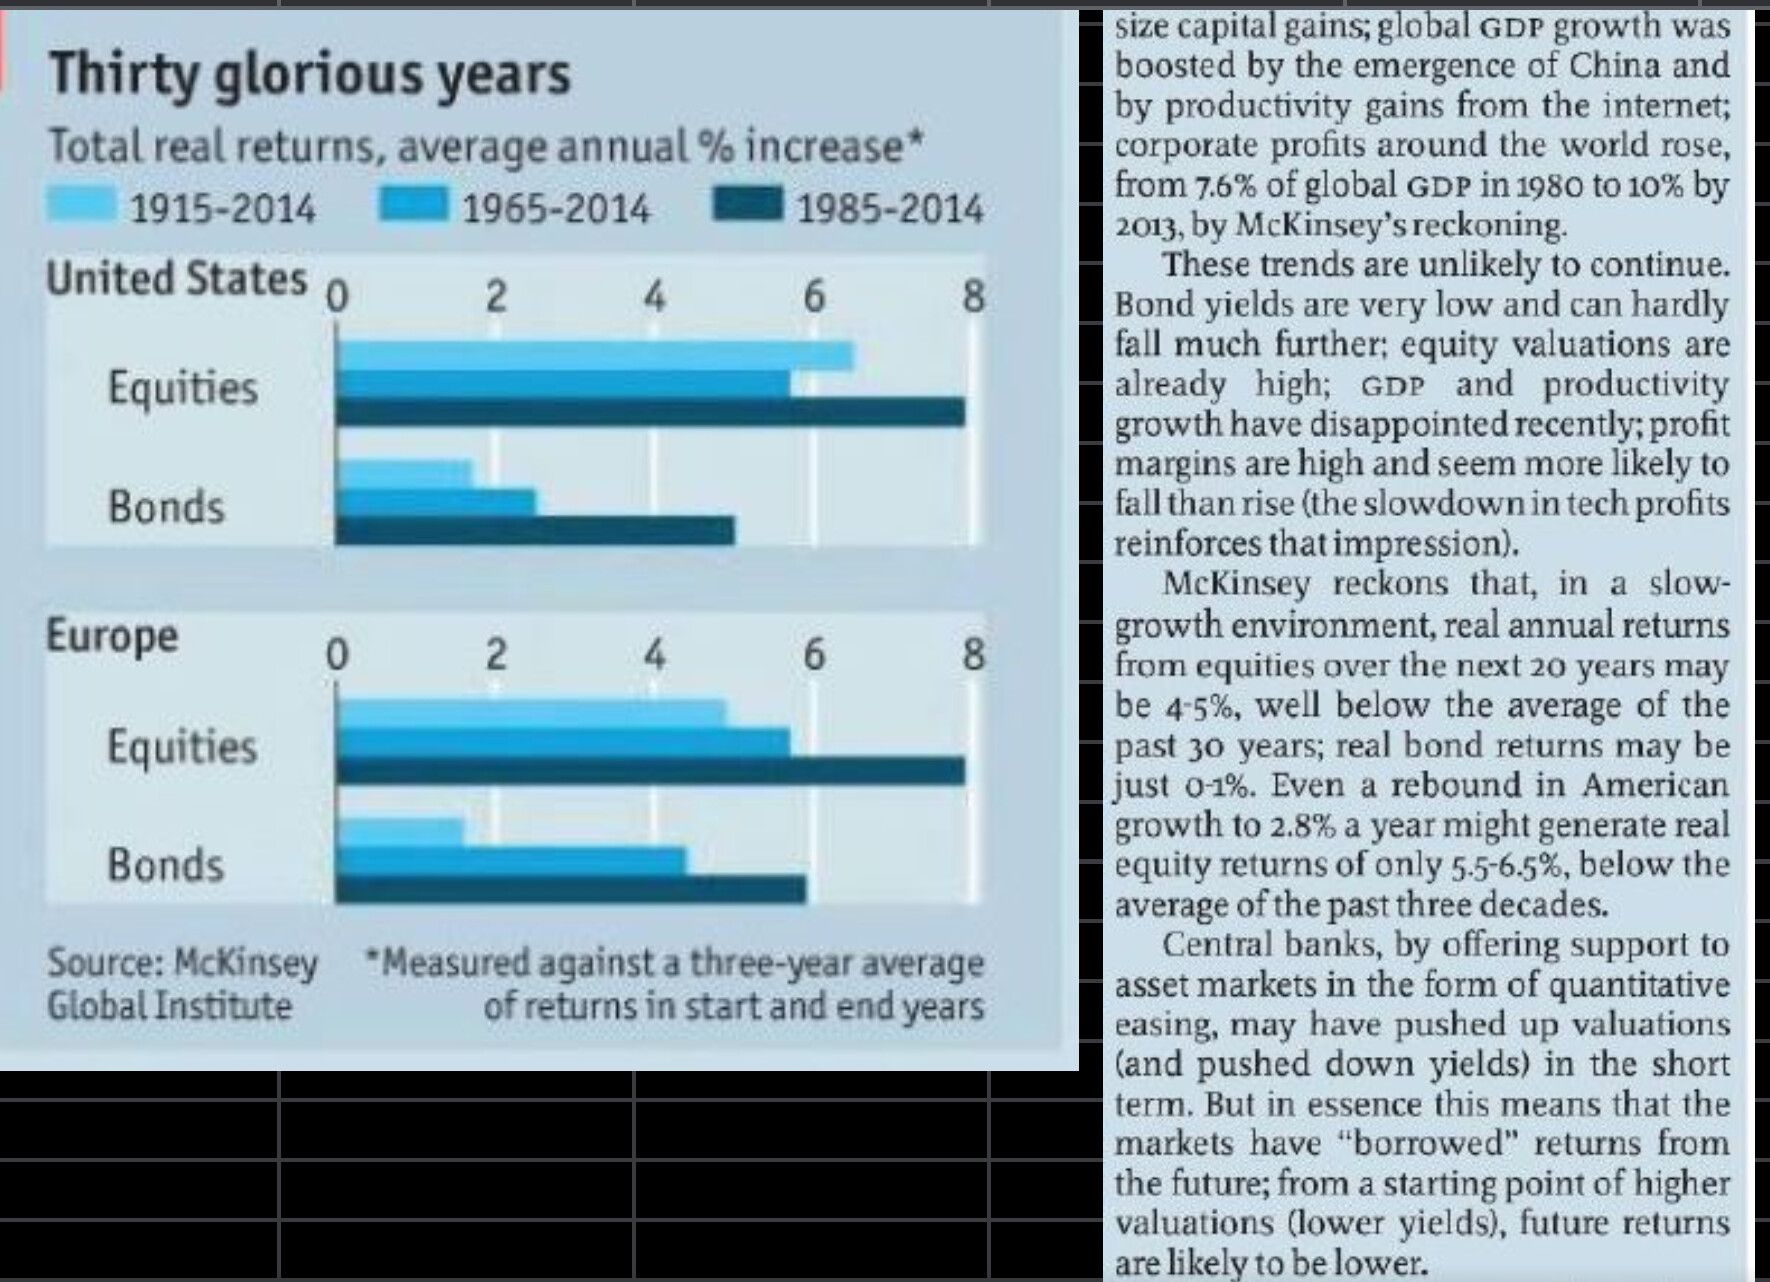
I like this “post-it” size summary. It’s from the Economist 2015, so not quite current.
Today I would say “1985-2019 - 35 glorious years”.
As always past not equal future.
I’m basing my expectation for stocks on a 30+ years investment horizon but am more conservative with my expectations of cash and bonds. My expected nominal CAGR are:
Swiss stocks: 10% (very light graphical analysis of past performance, nothing I’d rely on too much but I wanted a number to graph my progress so… here it was) ;
Cash: 0.30% ;
Bonds: 1% ;
Precious metals: 0%
Real Estate: 4% (there again, a pretty rough estimate as someone without the skills to optimize these kinds of investments).
These are numbers I’m using for myself, nothing to rely too much on. I’m optimistic on long term stocks returns but that has to do with the way I’m investing (individual swiss stocks with price-weighted allocations and/or hard entry/exit prices).
I have the following historical returns of s&p in my head: 10% nominal USD and 7% real, 3% USD inflation.
It varies a lot depending on the starting and ending point, that’s why it’s good to visualize it with a trailing return CAGR. For example this chart shows, what your average return would be each year if you invested for 20 years. As you can see, it varies a lot, and 20 years is not a short time.
I need to google for some DCA CAGR, not lump sum. Maybe it looks more smooth.
By reading and partipating to this forum, you confirm you have read and agree with the disclaimer presented on http://www.mustachianpost.com/
En lisant et participant à ce forum, tu confirmes avoir lu et être d'accord avec l'avis de dégagement de responsabilité présenté sur http://www.mustachianpost.com/fr/
Durch das Lesen und die Teilnahme an diesem Forum bestätigst du, dass du den auf http://www.mustachianpost.com/de/ dargestellten Haftungsausschluss gelesen hast und damit einverstanden bist.