VT & die ![]()
2 Likes
3 Likes
I’d hazard a guess that most people understand the impact of inflation as they can see it in their supermarket bill, but not inflation-adjusted returns.
2 Likes
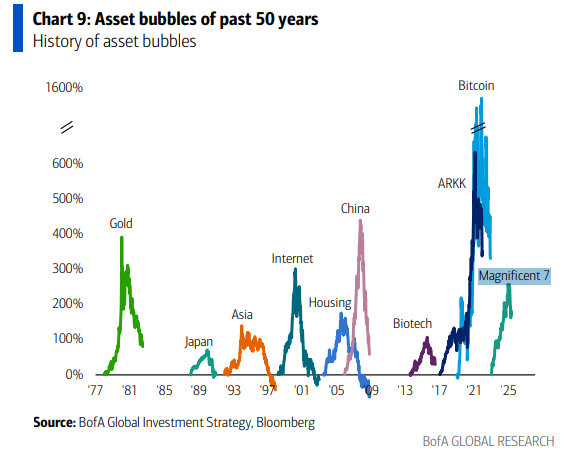
It’s kind of amazing how short lived these bubbles are after all in the grand scheme of things.
Yet when you’re in it and living through it and are observing the asset bubble and you just know it’s a bubble – let’s pick ARKK or Ark Invest – I find myself head-shakingly asking myself how is this lasting this long and why the heck is it still again going up, why do people believe this crazy lady fleecing investors via fees and why isn’t this thing valued zero already … I mean even after the ARK fund investors lost cumulatively double digit billions of USD, she still appears on major – well, maybe I should put this word in quotes – “major” financial news shows like CNBC or Bloomberg.[1]
[1] Spoiler answer to myself: because they are not financial news shows, they're financial clown entertainment shows.
Goofy, grow up, man!
3 Likes
What surprises me is that they show Bitcoin as finished, although it is now above the level of 2021.
4 Likes
It would be interesting to know how they classified the bubbles they’re displaying. I couldn’t find the original source fo the image but my Search-fu might be weak today.
Where does it originally come from?
1 Like
Here’s a secondary source: The biggest market bubbles since 1977 | Trustnet
Via Chat-GPT, couldn’t find / access the original report, either, after having spent an exhaustive 2 minutes on searchin … ![]()
(The publishing date of around late 2023 might also explain the Bitcoin conundrum of the bubble not yet finished … well, as of now ![]() )
)
How are the bubbles defined? I think it’s important to establish a level footing.
What makes gold a bubble in the 70s and not today, or ever considering it’s a speculative asset?
Also why do some go to sub zero and some stay positive?
If you have a source it could spare more questions.
1 Like
No idea, but it looks quite correct. I could trace it to this
Goofy’s definition: I know it when I see it - Wikipedia
![]()
Maybe slightly more seriously: you know years after, after the crash has truly hit bedrock bottom, and after everyone claims it was obvious to see that it was a bubble and moves on from it?
Fairly valued, overvalued, then undervalued? Like MBS.[1]
Really dunno, man, I’m just a dawg on the Interwebs.
Hardest to comment on for me as I know on this forum I’ll likely … ahem, create new … let me rephrase: there’s probably a number of people here who believe gold is significantly different from Bitcoin. I would even agree with them. But I’ll still come down on Warren Buffett’s summary view on gold[2] and don’t plan to own it actively.
[1] Mortgage Backed Securities, once fairly valued, once overvalued, once undervalued.
Now, IMHO, fairly or slightly undervalued.
[2] Which I think is that he dislikes gold as an investment because it doesn’t produce income or grow in value through productivity. He prefers businesses and stocks that generate cash flow. Gold, to him, is a speculative asset people hope others will pay more for later.
1 Like

These are all total return indices ?
Yes, Total Gross Return in CHF to be precise
Clear
Gold maintains Gold standard ![]()
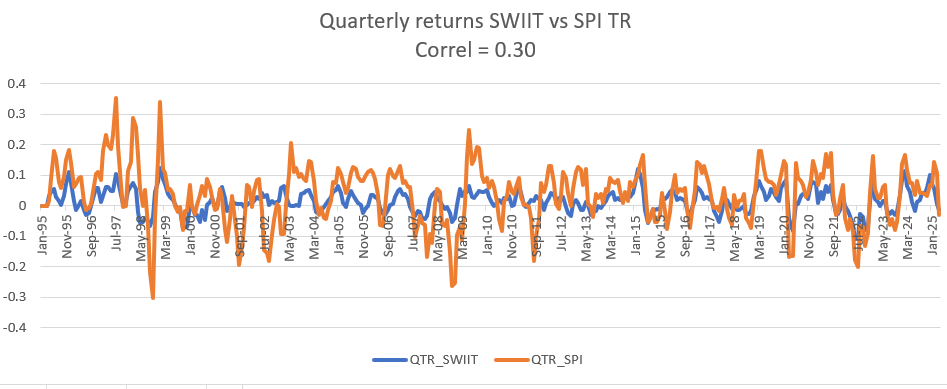
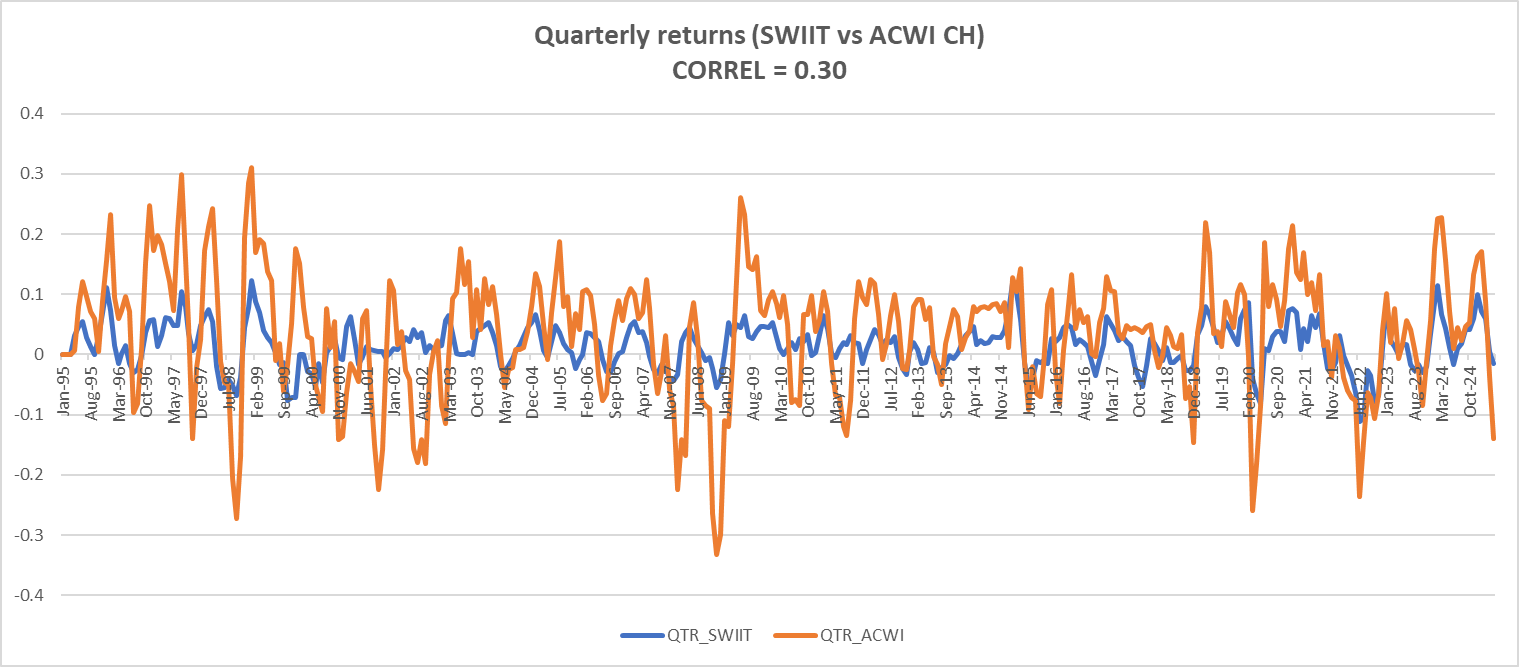
How is correlation between two tickers calculated?
ChatGPT says to use the CORREL function in Excel, but that gives me a correlation of 0.96 between SPI and Swiss real estate (SWIIT) for the time period of 1995 to today. This seems very high to me.
Then I found this article (in German) that compared correlation of end of Oct. '17 to end of Oct. '22 and they show a lower correlation.
What am I doing wrong?
I think you need to first convert the price data to returns data over a particular time period.
Let’s say monthly or quarterly returns for both assets. This would give you a series
And then you need to calculate correlation of the returns series.
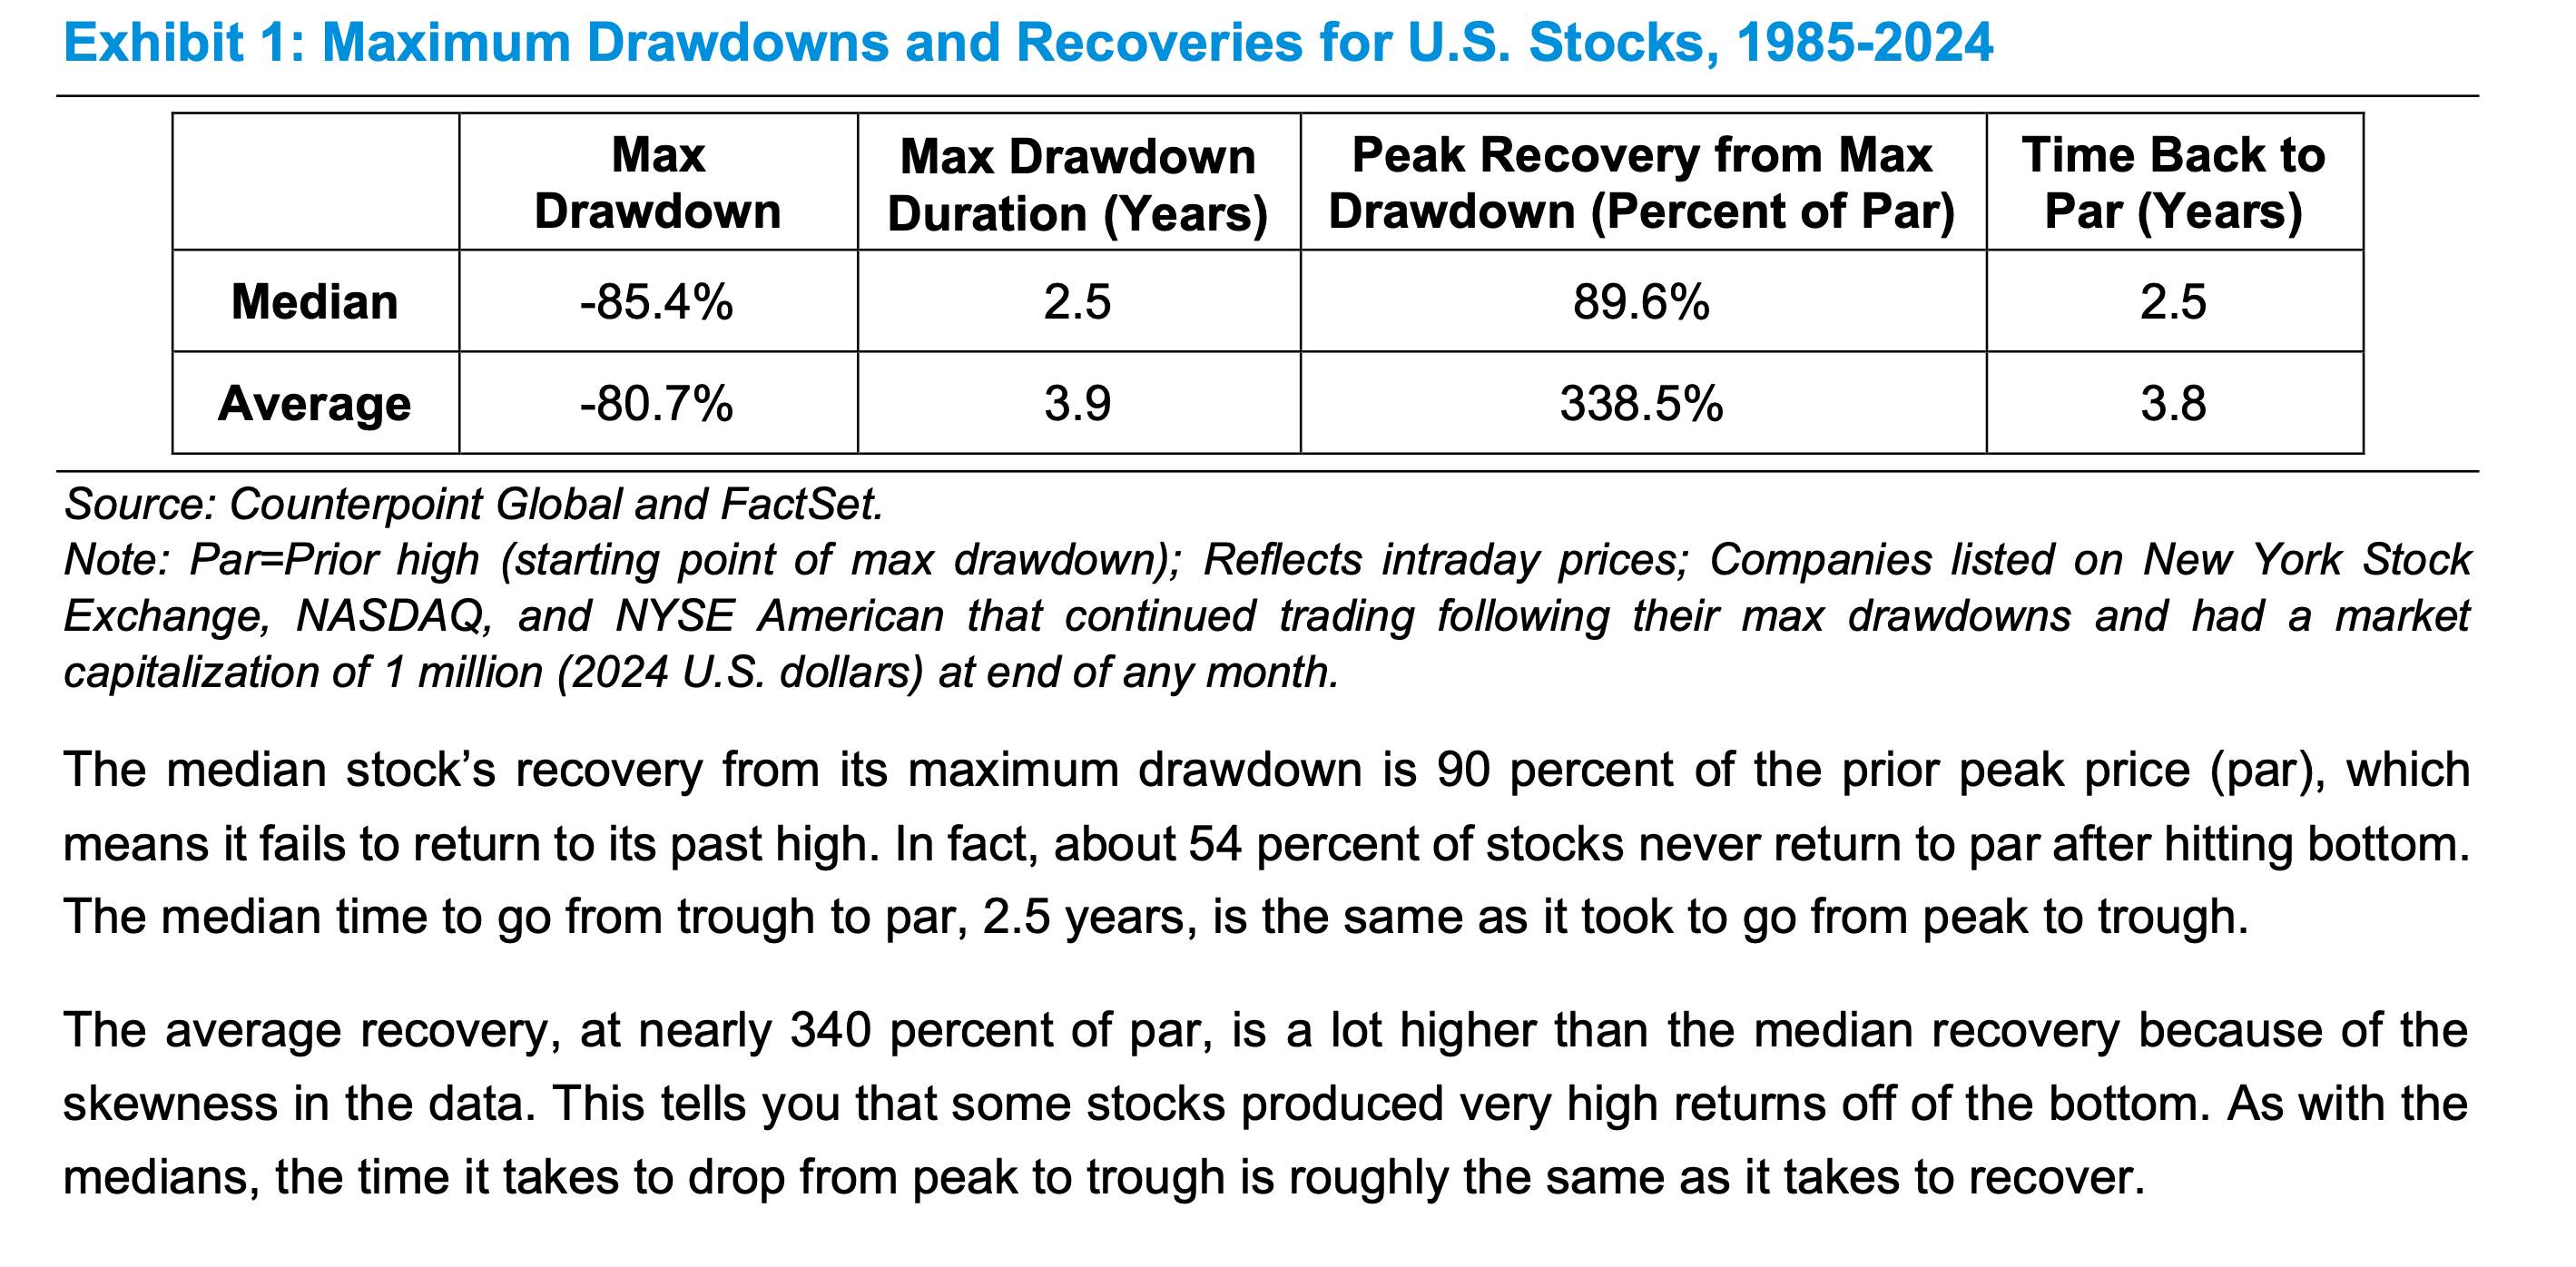
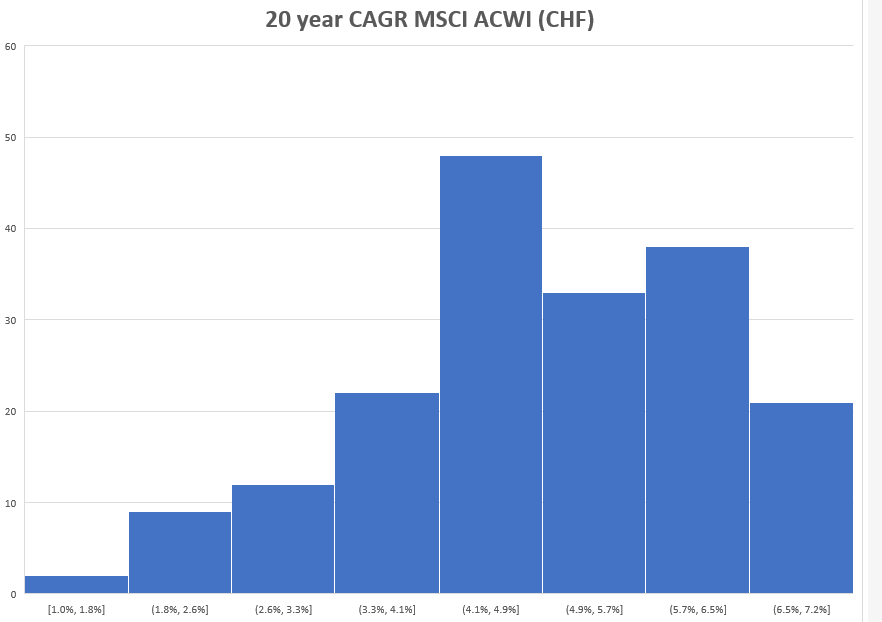
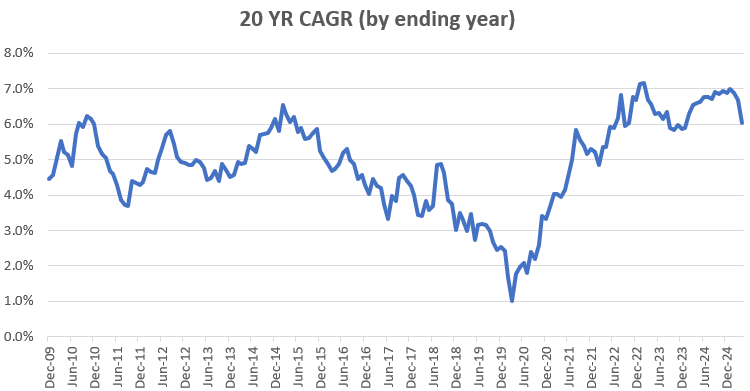
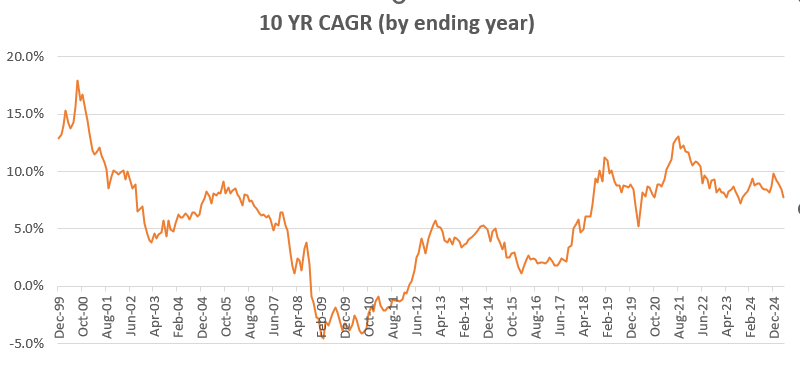
I was trying to estimate what returns people expect from MSCI ACWI and how much it depends on when they started investing. Not sure what you assume as expected return, but I typically used 5% for equities but I think it’s actually a bit lower. Maybe close to 4% after accounting for costs, dividend tax etc
Following is some data
- Numbers are PRE-TAX and assuming ZERO TER%. So you need to deduct income tax, wealth tax and TER%
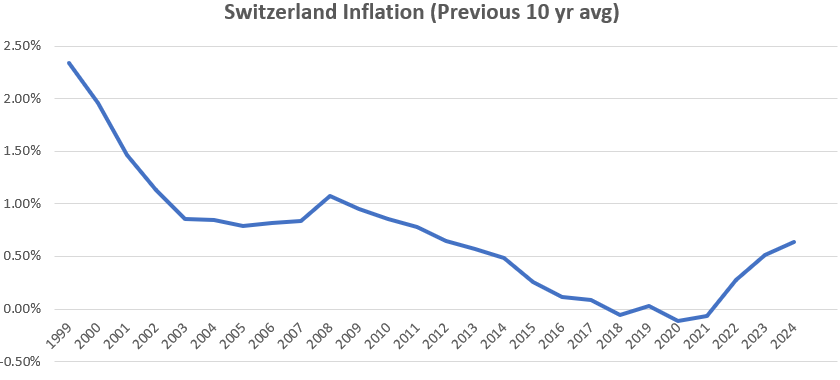
- Number are Nominal. So you also need to deduct the inflation to get to REAL returns
- Blue is positive, Orange is negative return
- I calculated it using MSCI ACWI data from CURVO in USD & then applying CHF/USD monthly exchange rate. I am assuming CURVO data is total return index and not just price index
- For example if investor invested 100 CHF in Jan 1990, what would be the value 10 year later and then what if they invested 100 CHF in Feb 1990, and so on..
- I used Histogram to understand the frequency of returns.
- The average is 5.7% for 10 yr period (305 observations) & 4.9% for 20 yr period (185 observations)
2 Likes