OK, so not comparing prices but percentage difference to previous value? Are you certain that is the right way to do it?
I think so. Because otherwise everything will have high correlation because price charts normally go up for most assets. And your objective is to understand if during a certain period they move in different directions or not.
Watch this
1 Like
The index however assumed worst possible withhding tax. That will offset TER and a bit more even.
In general about 4-5% real return is realistic.
True
For a 2% dividend yield
- WHT advantage would be about 0.30% (assuming Treaty rate of 15% vs 30% WHT in Index)
- Income tax disadvantage on 2% dividend is going to be 0.60% (assuming 30% marginal tax rate)
- TER lets say 0.1%
- So post tax net return would be about 0.4% lower than the charts
1 Like
Valuable stuff, cheers @Abs_max
1 Like
Thanks, just calculated correlation of SPI and SWIIT from 1995 to today according to the video you linked and got a correlation of 0.3.
What I as a non-mathemagician don’t get is why the formula for the return is LN(today/yesterday) and not (today/yesterday)-1.
Actually i didnt use the LN function because i was not sure what it was. But I simply used the change from one quarter to another.
So now that you have established that SPI & SWIIT have low correlation but also a positive one, does SWIIT fit in your portfolio?
For the period of the last 10 years, correlation has increased to 0.45, but still. (Gold has -0.02 for 1987 to today and 0.00 for the last 10 years BTW).
I will most likely start to add some SWIIT SWIIT real estate to my portfolio.
1 Like
7 posts were merged into an existing topic: Buying gold Vs staying with CHF
(Source)
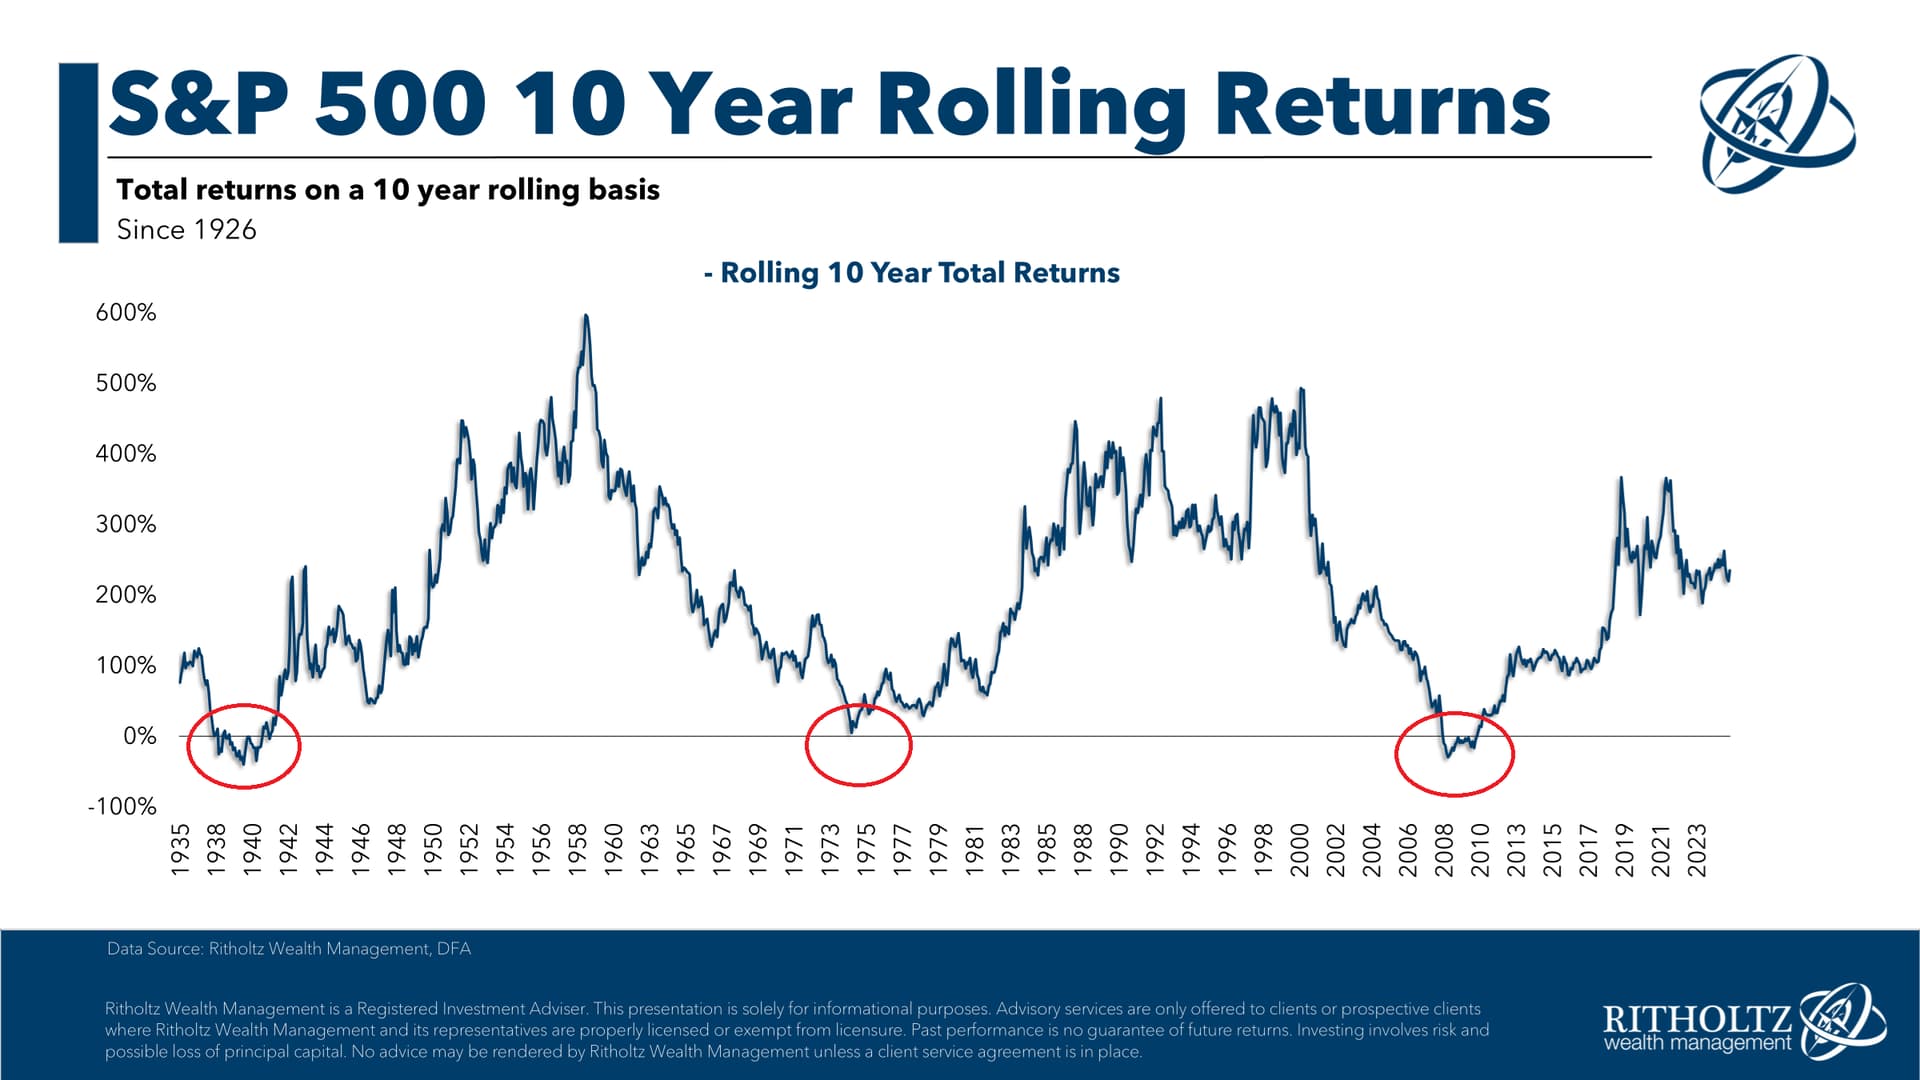
OK. So we should be on our way back down now.
1 Like
4 Likes