I believe that making a plan and bands/rebalancing targets takes away the guesswork/luck.
My own targets are -10/20/30% of the ATH for dropping 30/30/40% of any liquidity, if it goes lower (which is actually pretty rare) then so be it.
The priority to be honest is not selling a single share at a downturn, then the larger the portfolio gets the less meaningful any buying the dip becomes.
Personally my threshold is a portfolio of 250k, holding 25k of liquidity begins being silly (for me), meaning when my portfolio crosses 250k I won’t be bothering stressing about any dip buying, just buying regularly.
Two simple points to help you get a better night’s sleep:
Delete all trading applications on your PC or smartphone. Only use the WebUI to trade once a month. If you are investing for the long term, there is no need to look at the numbers at all (with a set and forget strategy like VT/VWRL/WEBG etc).
Only read credible news sources (or only your local news paper if you want to be really restrictive)
Just to make it clear, you are out of the stock market - holding cash (or something similar) - till the market drops 10/20/30%?
How do you decide when to stop investing? Too many years of high returns? Valuations?
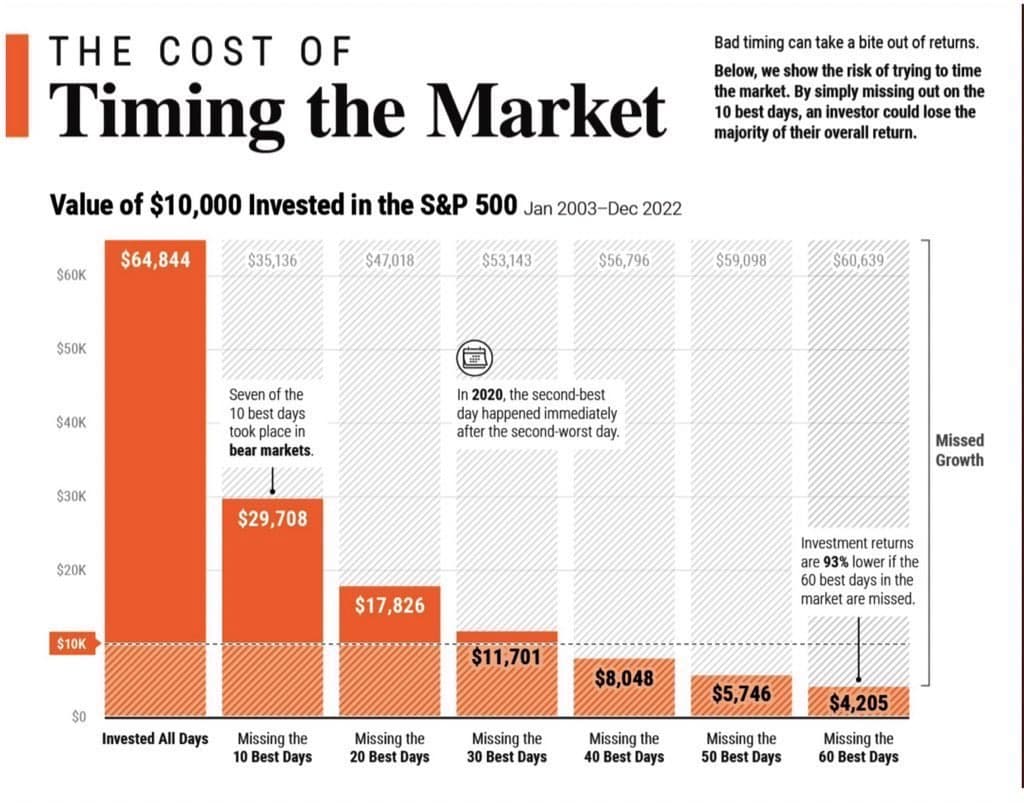
The message is clear and super useful, but the concept is a little bit misleading
Missing 10-60 best days without missing a single of the 10-60 worst days of the same period? I think the chances for these scenarios to happen are practically zero.
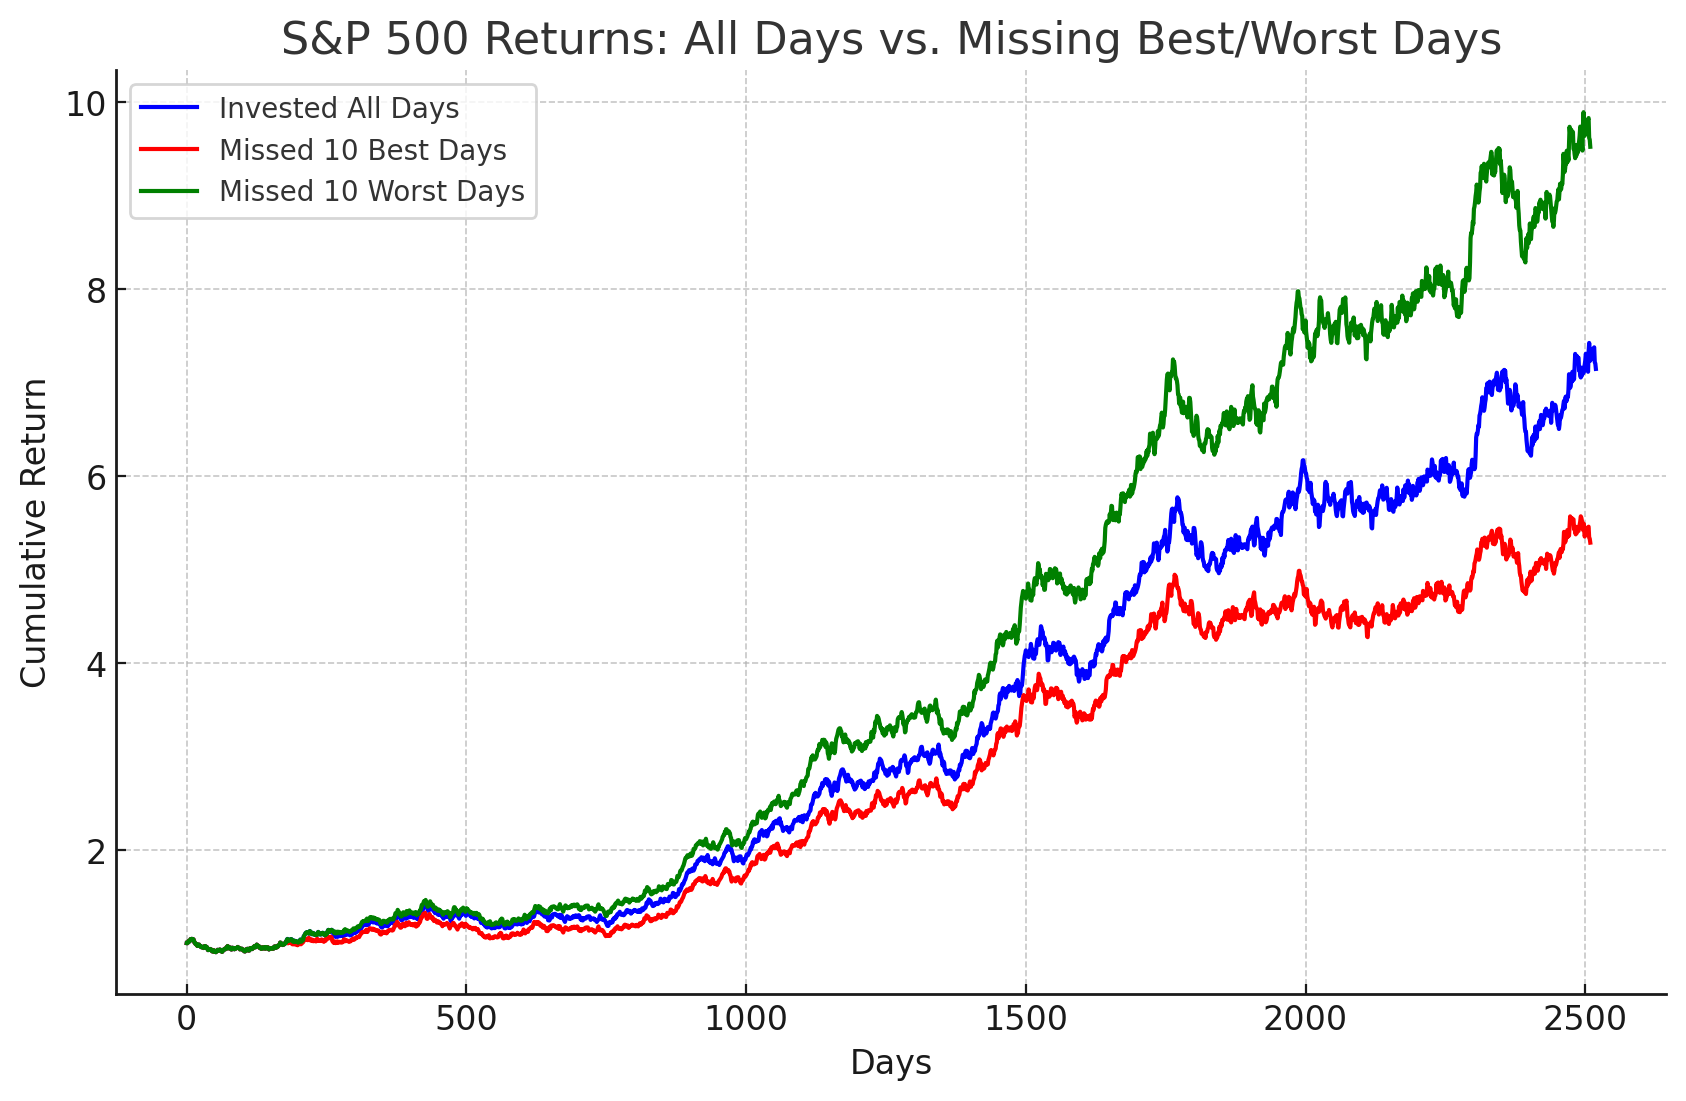
Out of curiosity, is there chart where - by using your super powers - you manage to miss the 10,20-60 worst days (and got all the rest - bad and good)?
Q: give me a chart where you’re invested at all days in the S&P 500, one where you’re not invested on the 10 best days (but invested on all other days) and one where you’re not invested on the 10 worst days (but invested on all other days)
A: Here’s a chart showing the impact of missing the 10 best and 10 worst days on S&P 500 returns. You can see that missing the best days significantly lowers returns, while missing the worst days boosts performance. Let me know if you want to refine the data or analysis!
No not at all, I am just talking about extra liquidity I was building for 8 months (now into gold for a month) which if we see 10/20/30% drops I’ll put into my usual stock buying. Not planning to ever be out of the market.
The more I’ve looked at this chart the more unrealistic it seems, as you and others pointed out. The message is clear: don’t try to time. The how is…“don’t try to time because in reality jumping in and out at the precisely right moment is practically impossible”. The chart is irrelevant to anyone never intending to exit the market.
Maybe I’ve missed some satire signal, but isn’t this chart a total bullshit? It implies you could 7x your investment over 2500 trading days (which is ~10 years). You need to compound at 22% annually or so to get that.
Initially it was realising I went so pedal to the metal in 2023-2024 that I had a paltry emergency fund that would cut it very fine if I lost my job and before benefits. Then gradually, after building the emergency fund to where I wanted it to be, we came to ~November where I felt volatility was coming (for real this time!) so I kept on saving cash. As you know from our convos I was looking for something to do with this cash for a while, and I settled for gold, part due to FOMO, part due to studying its impact in long-term portfolio building, partly because I simply disliked holding cash (so I chose to pay for a metal I can’t even fondle being stored in a Zurich vault!).
I have set targets for both deploying the liquidity (the -10/20/30% drops and restarting putting new money in: 1 year after stopping (ie this July). It’ll just be VWRL, not 3A for reasons we’ve discussed in detail!
Even the chart from JP Morgan is a bit fishy. Why analyze only 19 years when there are over 100 years of S&P 500 data? Why start in Jan 2003? I wonder what the chart would look like with the full data?
What would be more interesting is a chart that shows attempted market timing where you time perfectly the buy and sell (this one already exists) and then charts for each day you are wrong on the buy and the sell.
That way you can see how accurate you need to be for this to pay off and also whether it is better to be too early or too late on the buy or sell.
It’s actually 20 years of data and I think they picked this time frame because they had to pick something which is familiar to most people in current times.
No one in real world invests for 100 years , so it doesn’t represent investment horizon of a real person.
I am sure such a chart will also play out similarly if we take 50 years of data because the reality is on average market moved 9-10% per annum so if you miss the days which moved 10-15% in a day, it would definitely make a dent in your returns.
Perfect buying and selling timing would result in astronomical gains. Assuming you mean that investor always sold at tops and then rebought at bottoms and did this for every move up and every move down
This is what traders dream off and mostly never achieve
I am not so sure of “astronomical” gains unless we include massive leverage/derivatives. Maybe 2-3% more CAGR at best without them? This is a number I pulled out of my backside and would compound a ton over time, but still not astronomical.
I will try to do some math later . But conceptually perfect timing buy-sell means following
On days market is moving up you were invested
On negative days you were in Money market fund
This means you only experience positive change in your portfolio and no negative changes. If you just look at 2025 daily changes , you will start to get a picture of how this would play out.
By reading and partipating to this forum, you confirm you have read and agree with the disclaimer presented on http://www.mustachianpost.com/
En lisant et participant à ce forum, tu confirmes avoir lu et être d'accord avec l'avis de dégagement de responsabilité présenté sur http://www.mustachianpost.com/fr/
Durch das Lesen und die Teilnahme an diesem Forum bestätigst du, dass du den auf http://www.mustachianpost.com/de/ dargestellten Haftungsausschluss gelesen hast und damit einverstanden bist.