Now this is just taking the mick:

I trim my position in NCSM (yes, that NCSM) today and it goes up 11% afterwards. They didn’t even have the decency to wait until the next trading day before making me rage!
Now this is just taking the mick:
I trim my position in NCSM (yes, that NCSM) today and it goes up 11% afterwards. They didn’t even have the decency to wait until the next trading day before making me rage!
I’m starting a newsletter, where I will be detailing my upcoming sells. Sign up now for a limited time discount.
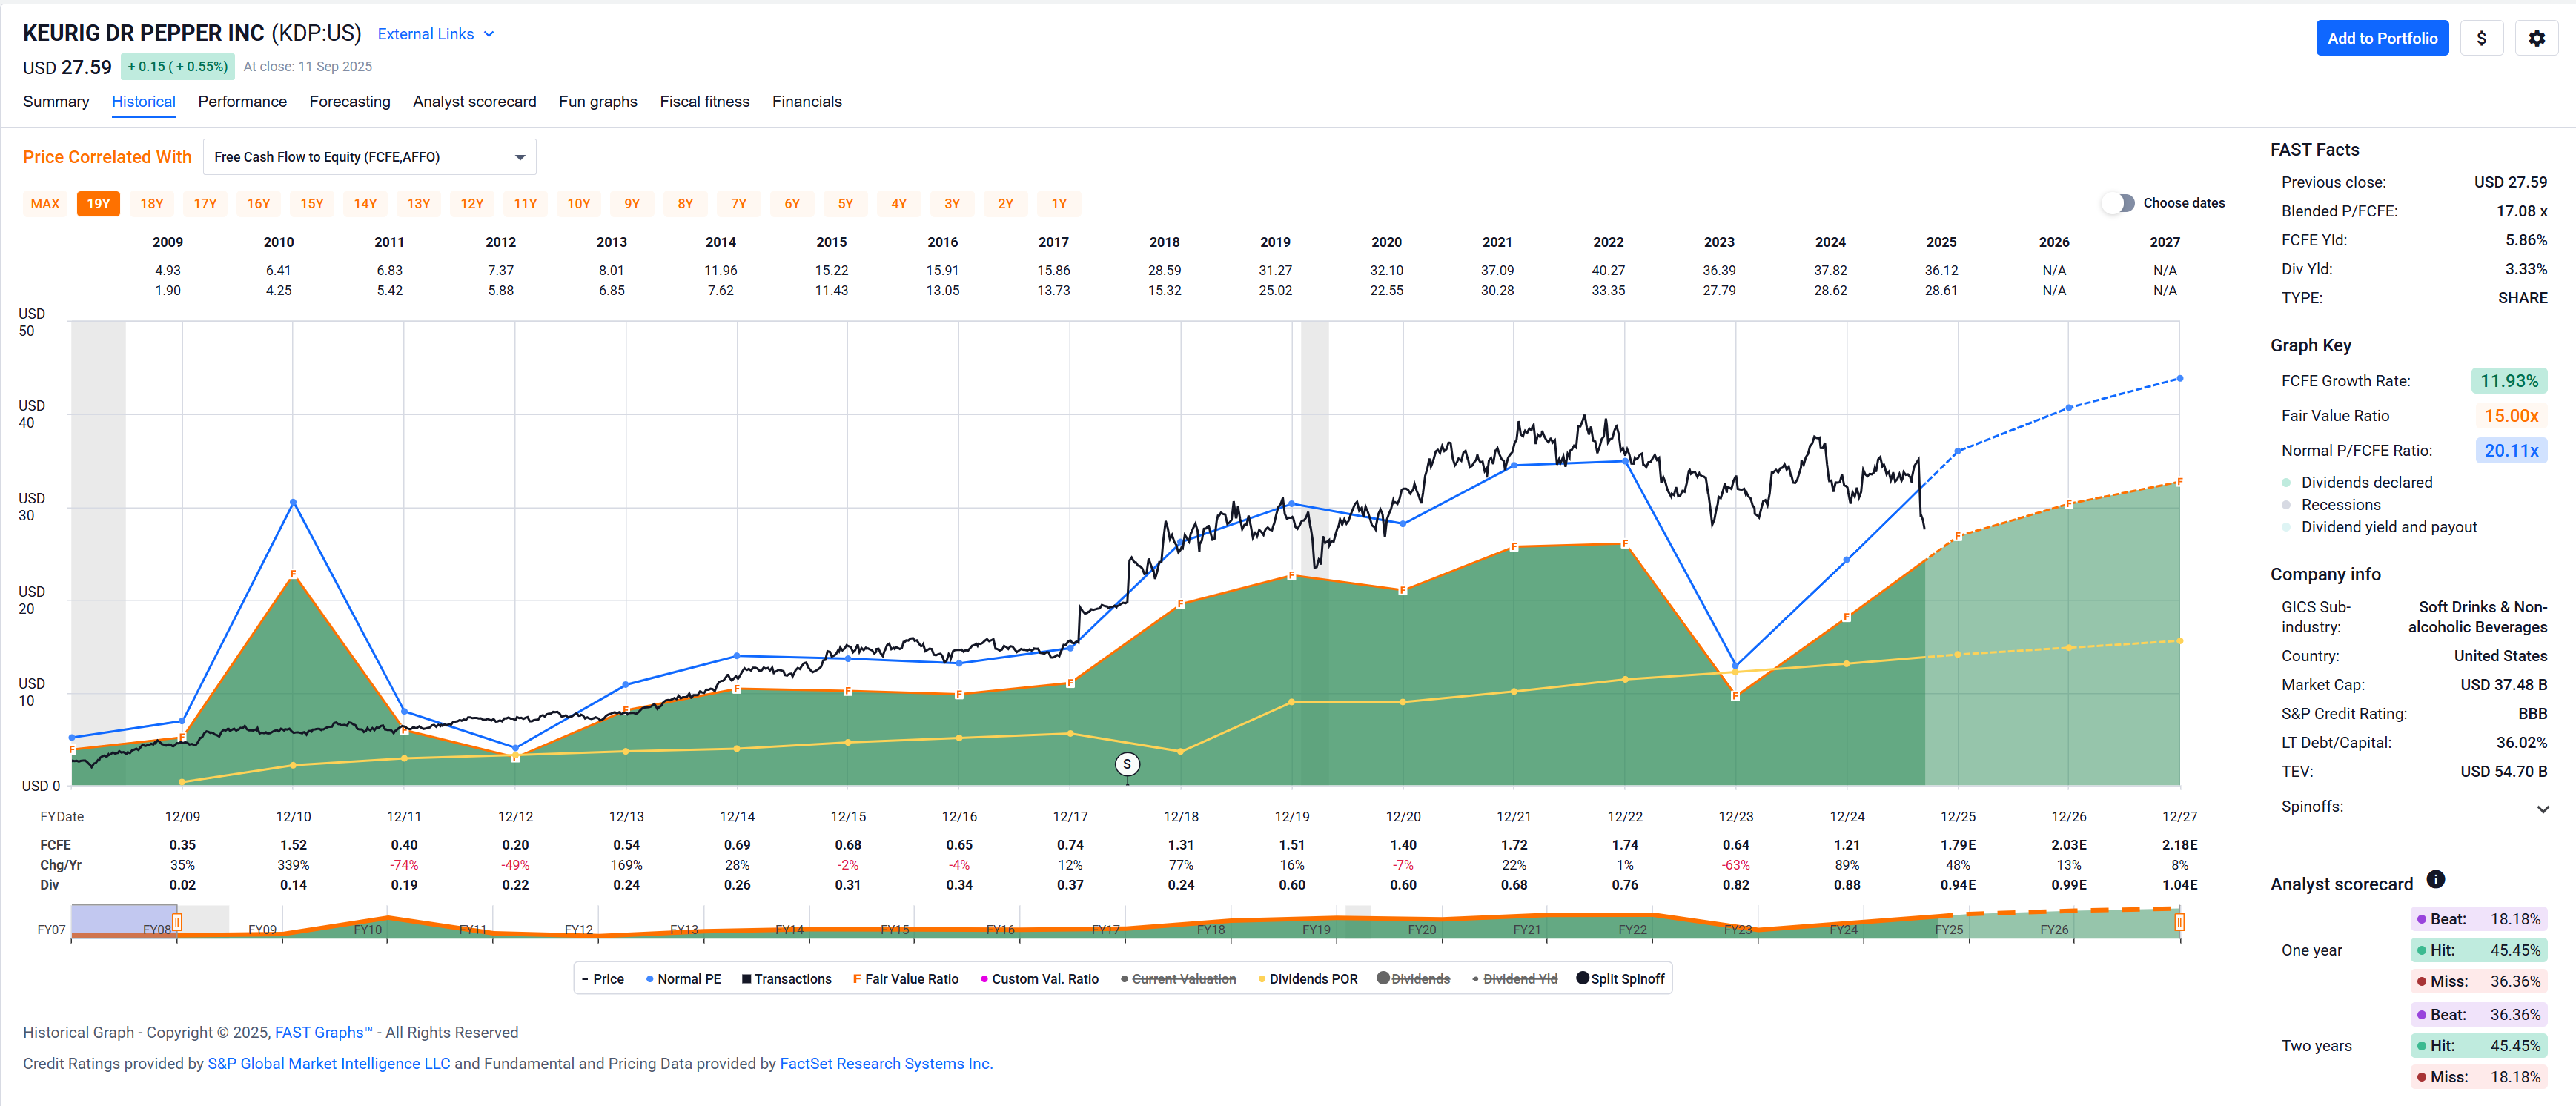
Came across a WSJ article discussing Coke and Pepsi and as a result looked up Keurig Dr. Pepper.
How do you like Dr. Pepper (the company)?
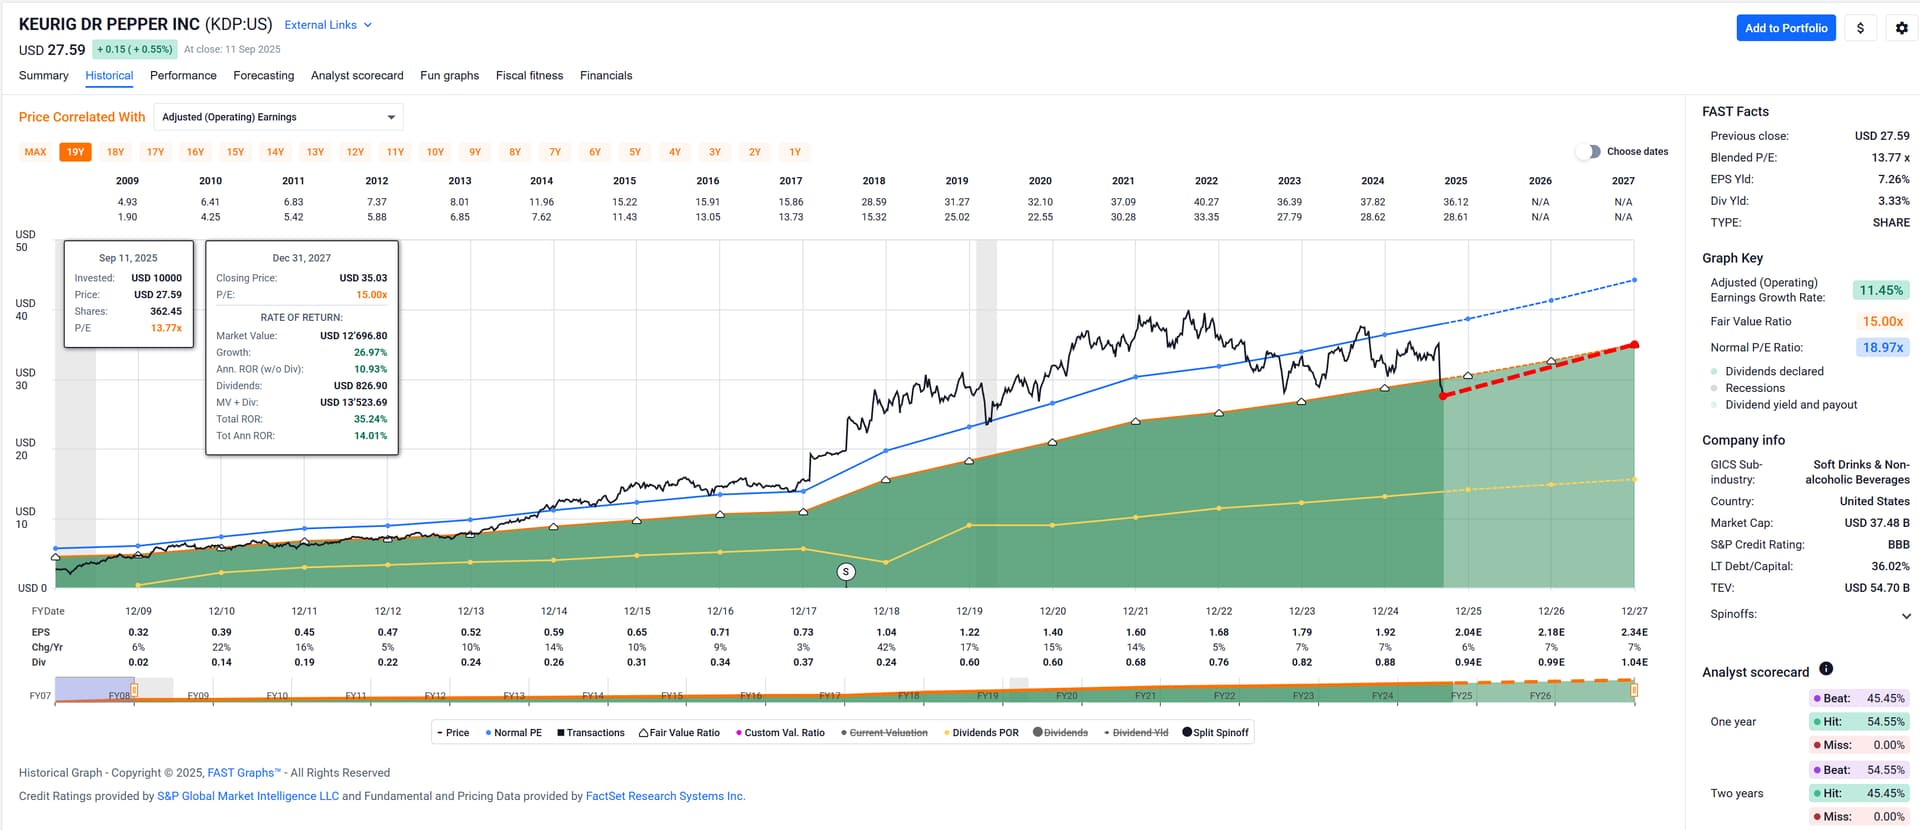
Just fired up FASTgraphs and it’s looking … tasty?
Not quite sure why the price recently went lower. Maybe too peppery for the market at the moment? ![]()
Maybe the price drop is related to them recently buying coffee company JDE Peet’s.
This
A quick look at the balance sheet shows that there is basically no company; Dr. Peppers is other companies that they bought. 81% of their assets are “goodwill”.
So it is kind of a second hand stock; the first owner already enjoyed it, probably a lot.
If I put on my sleeve protectors and put their books on my standing desk I see that discounting the goodwill the company would have to pay me to buy their shares, negative value. ![]()
I guess I’ll then just have stick to just enjoying Dr. Pepper the soft drink (even though it’s kind of hard to get in CH).
Maybe I’ll take a deeper look, I have some cash to deploy and my portfolio isn’t diversified enough. ![]()
I like Keurig. They built quite a coffee empire.
I recall they’ve been going on a buying spree, so first thing I’d look at is their debt: the scale, maturity profile and interest cover.
I wouldn’t be interested at buying for more than $20.
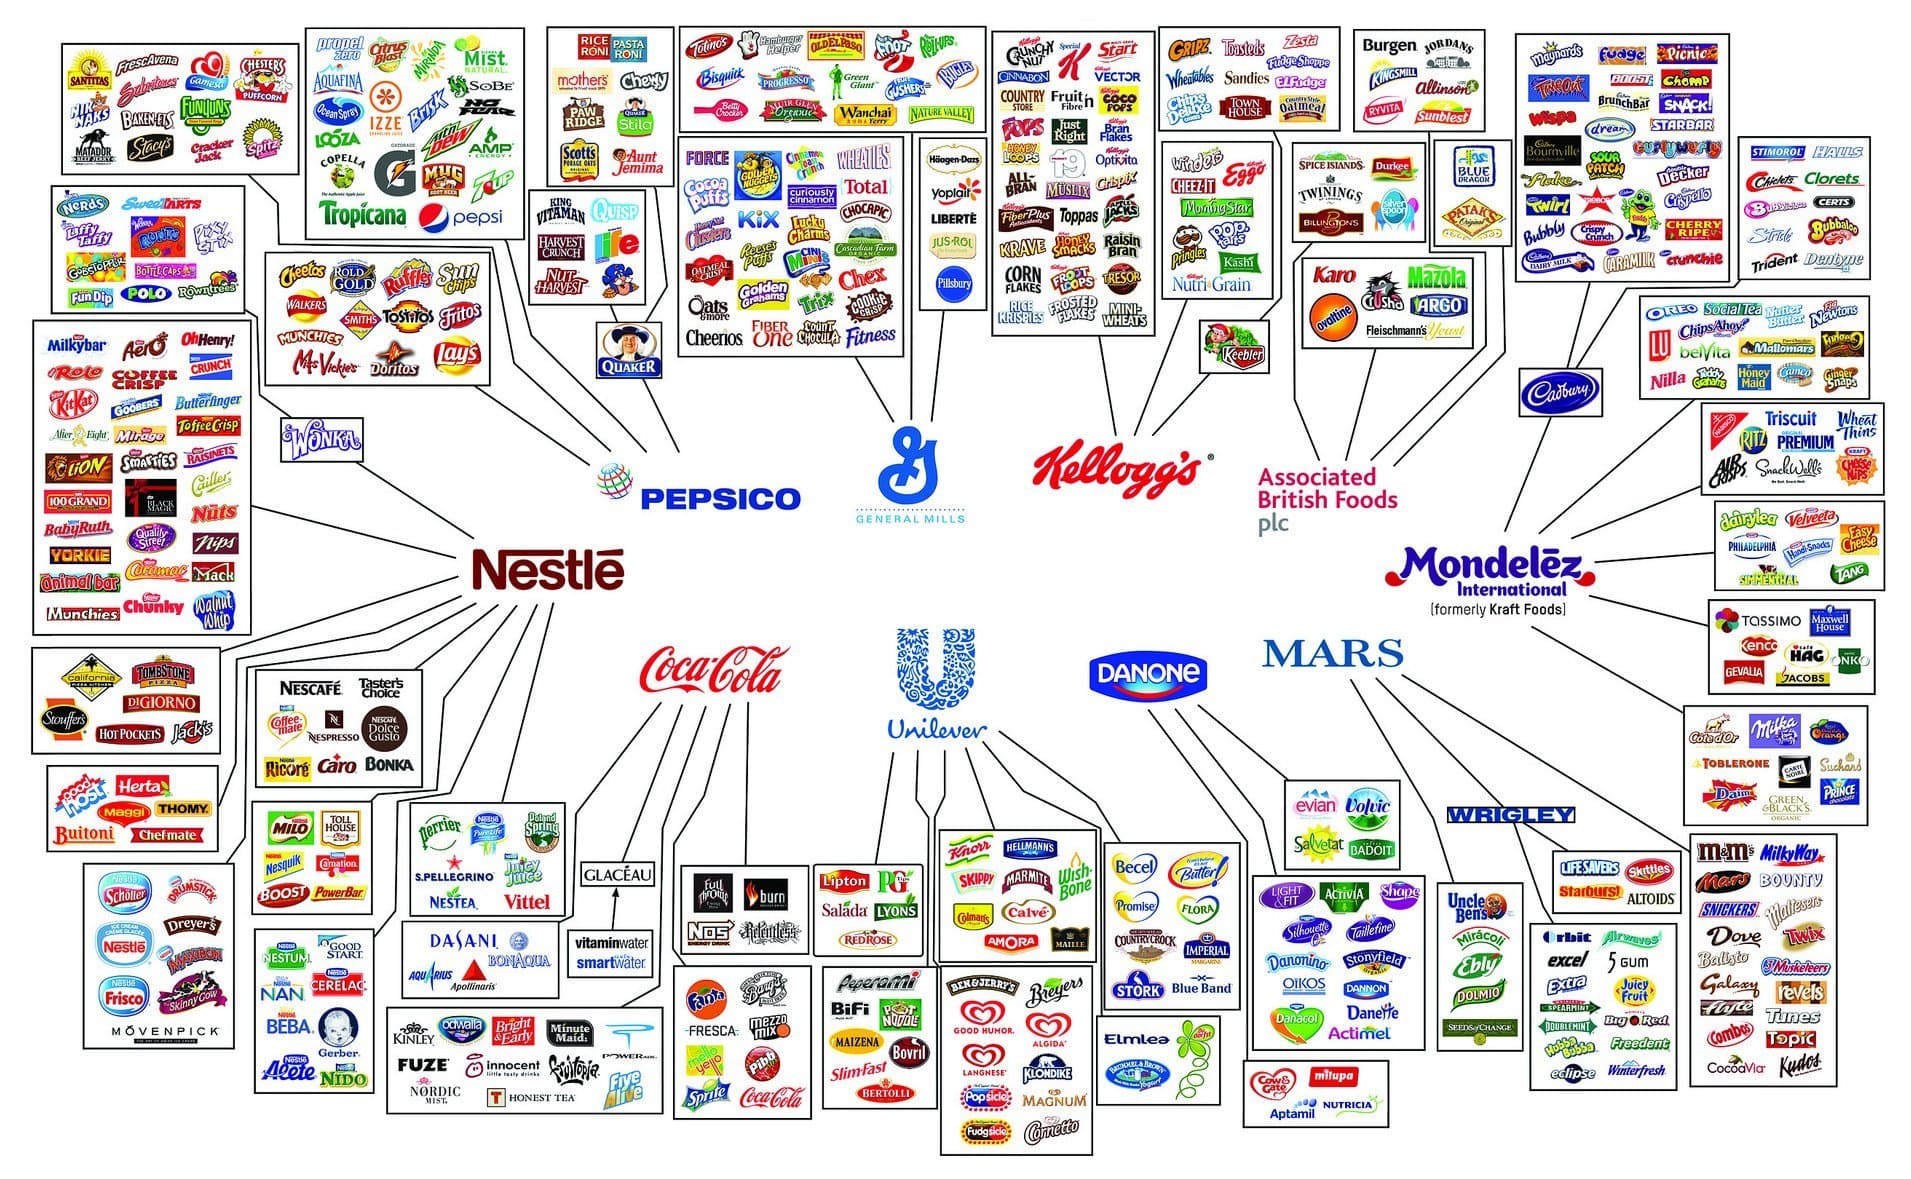
Aren’t they all, though? Or is KO or PEP significantly different in this respect? Sorry for asking the dumb questions as I have not looked into this at all, but an image – often labeled as “the illusion of choice” – I recently saw (again) on Twitter came to mind, as all of these companies just kept acquiring brands (ok, some brands they built themselves, but most they did not). And brands is all what these companies are about? For the beverage part of their business they sell water with sugar and some flavors … no?
Long term debt to capital is 36% according to FASTgraphs and their S&P credit rating is BBB.
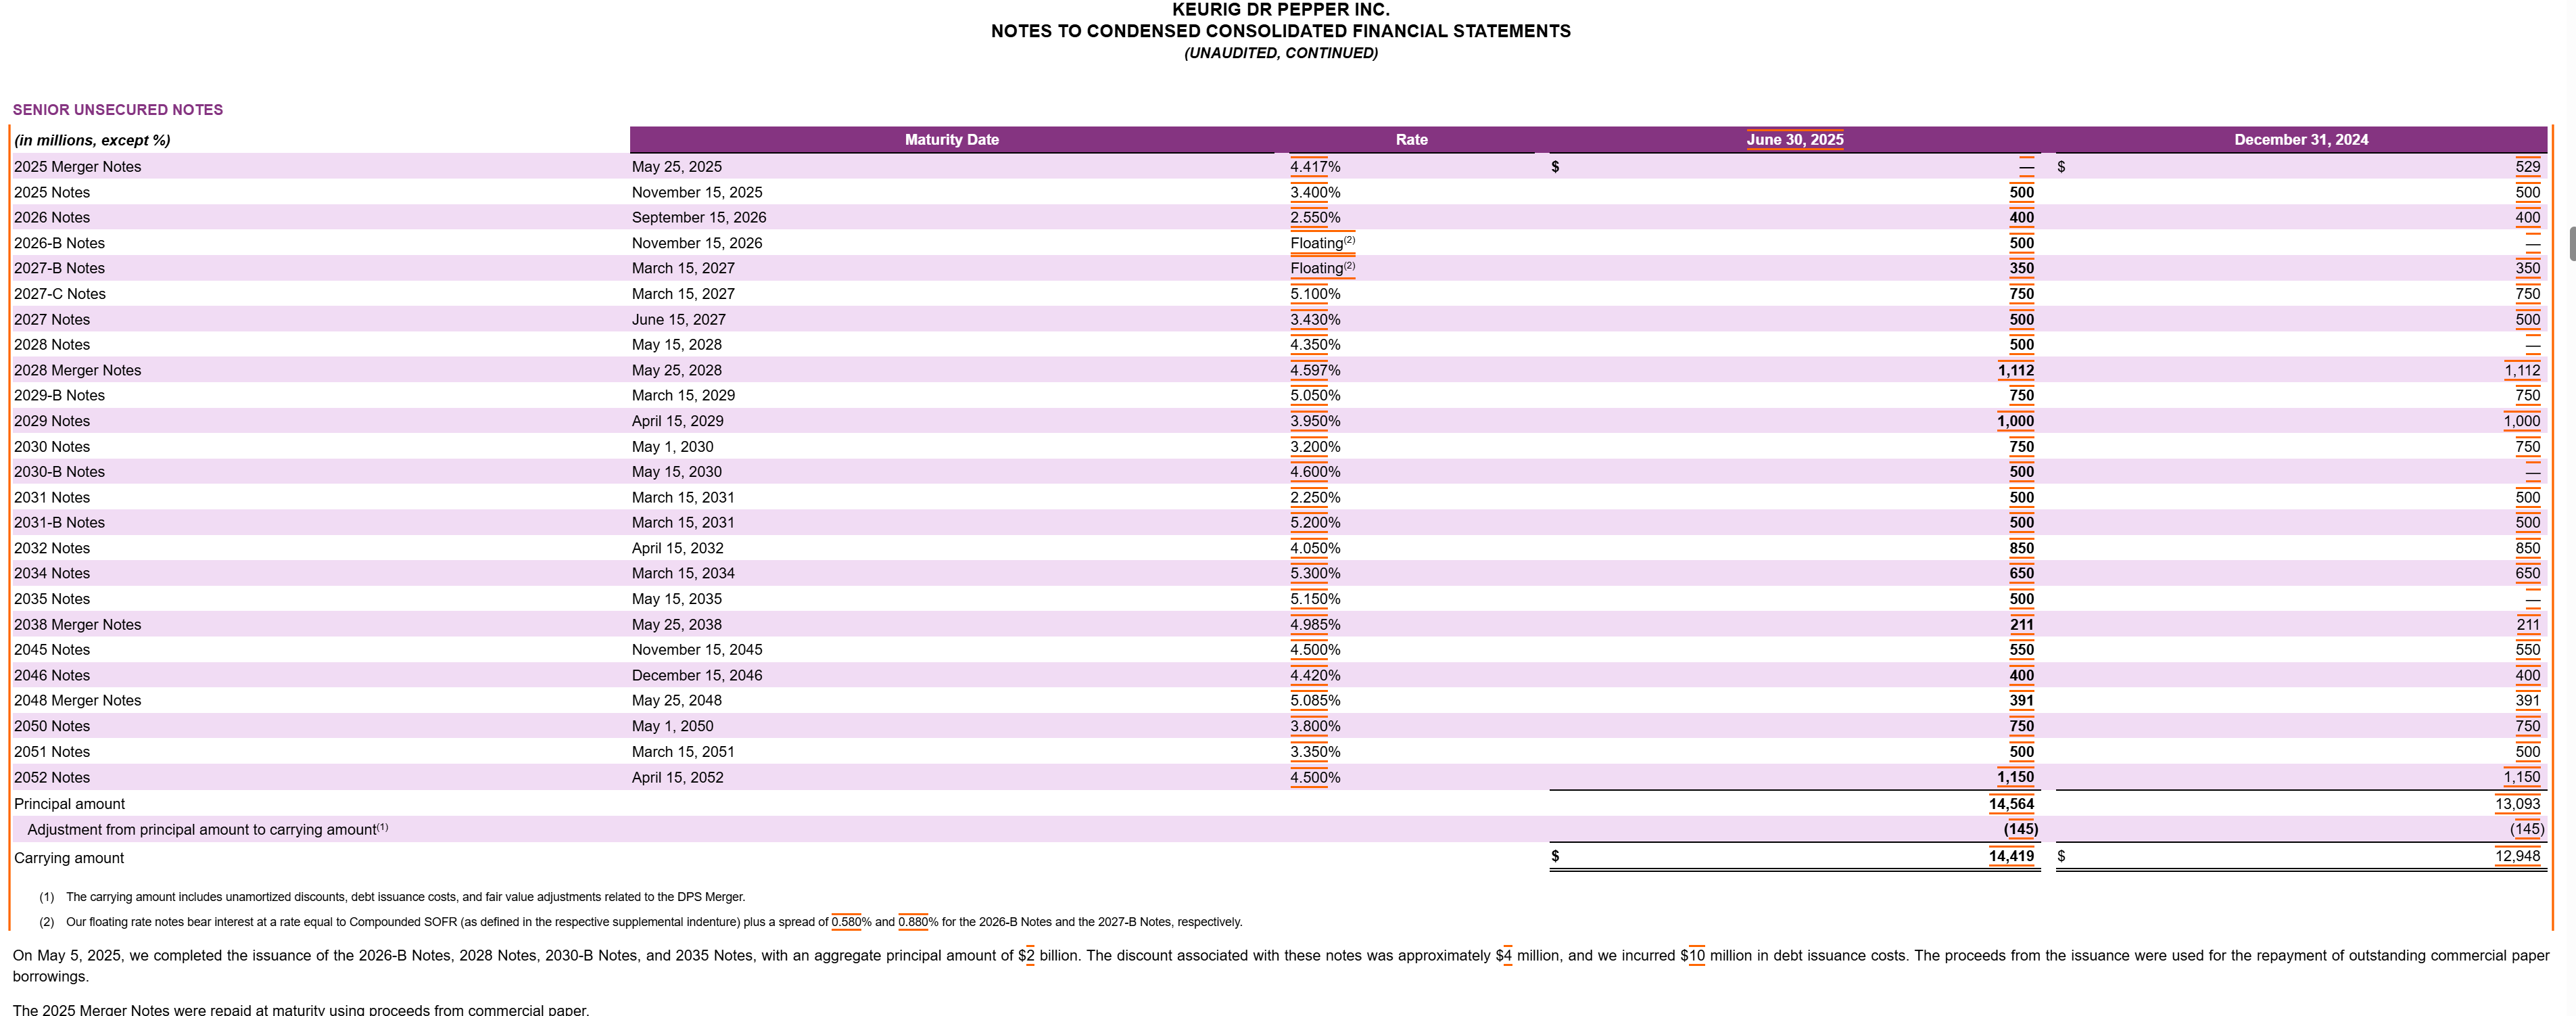
Debt maturity schedule:
Maybe I’m holding it wrong, but I fail to spot the alarming upcoming debt repayments due.
About $1.5B until the end of next year, and somewhat evenly spread out tranches longer term, nothing really really big coming up soon (or ever, according to the current maturity schedule).
Also – important for me – FCF easily covers the dividend and – bonus point (which I know someone here won’t agree with) – they raised and paid their dividend in 2023 when their FCF didn’t cover the dividend.
Got it, I’ll have to buy a fractional share then, right? ![]()
KO and PEP are both at 31% goodwill of total assets. Kind of high, but not that high as Dr. Peppers. Not sure about the rules but I think this has to be written off in some time frame and therefor will lower earnings.
But correct, the names have no tangible value, but they have value.
There is no need to write off goodwill, unless the value of the corresponding business went down. It usually stays on the balance sheet ad vitam eternam and decreases in percentage of asset with inflation and developpment of the business
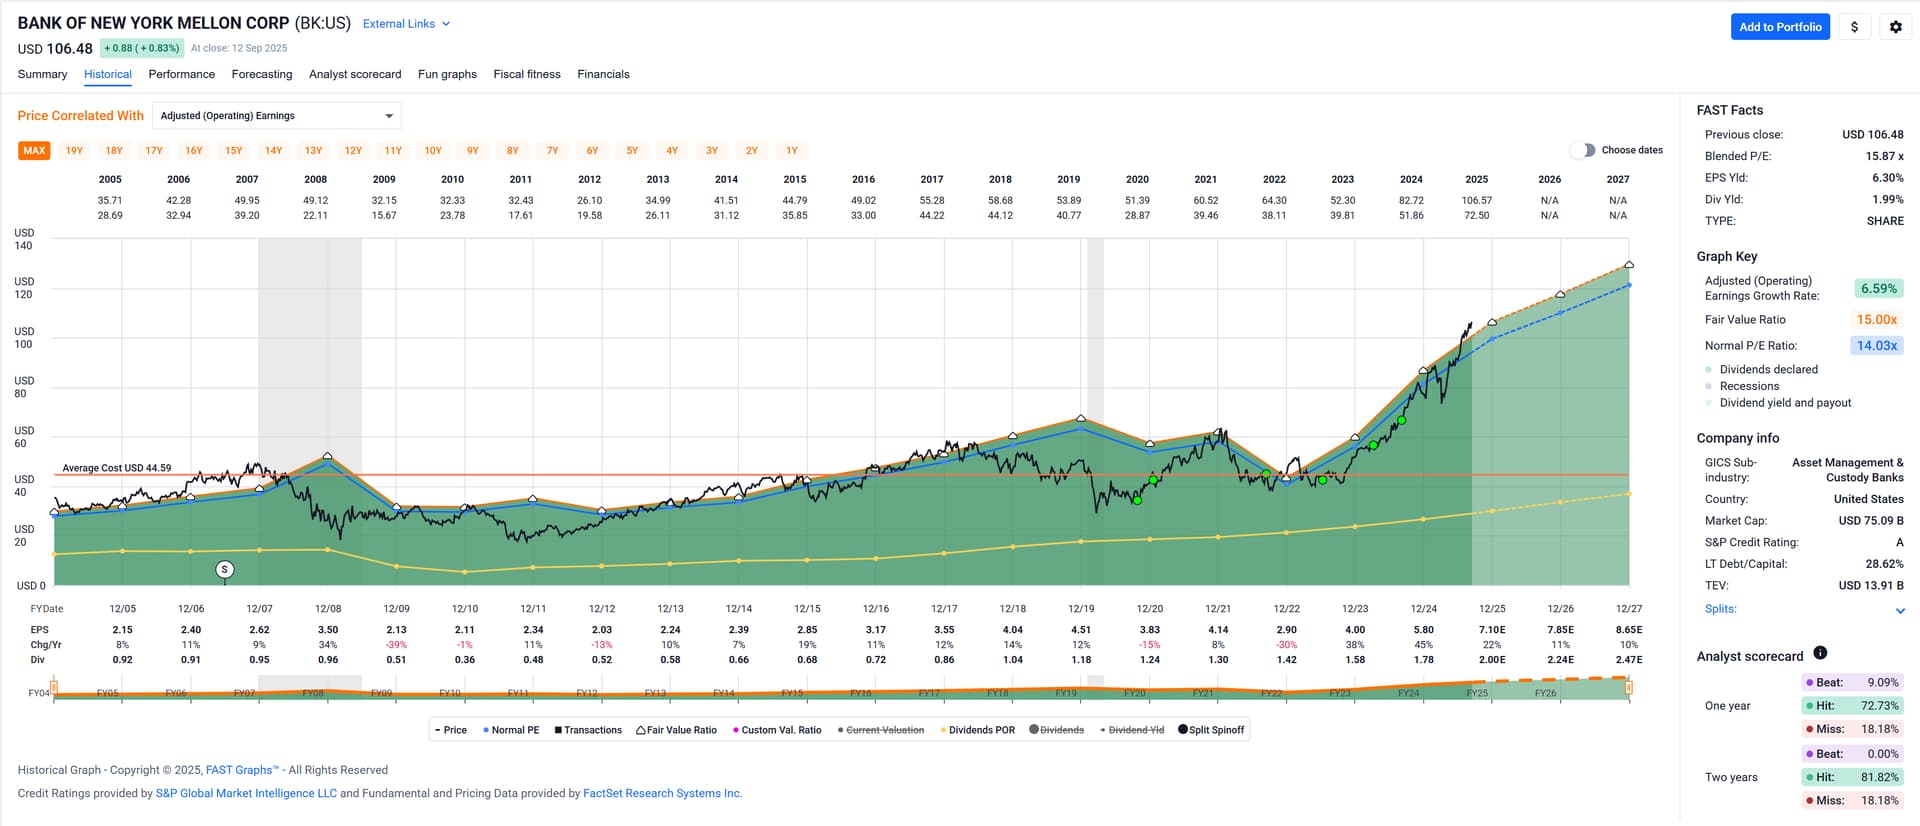
Regularly on Sundays I circle through my stockpicking portfolio with FASTgraphs to update potential buy and sell positions. Some companies I just click through, others make me stop and contemplate.
Three I’ll comment on here:
Boring Bank of New York Mellon (BK) is one that I liked looking at today:
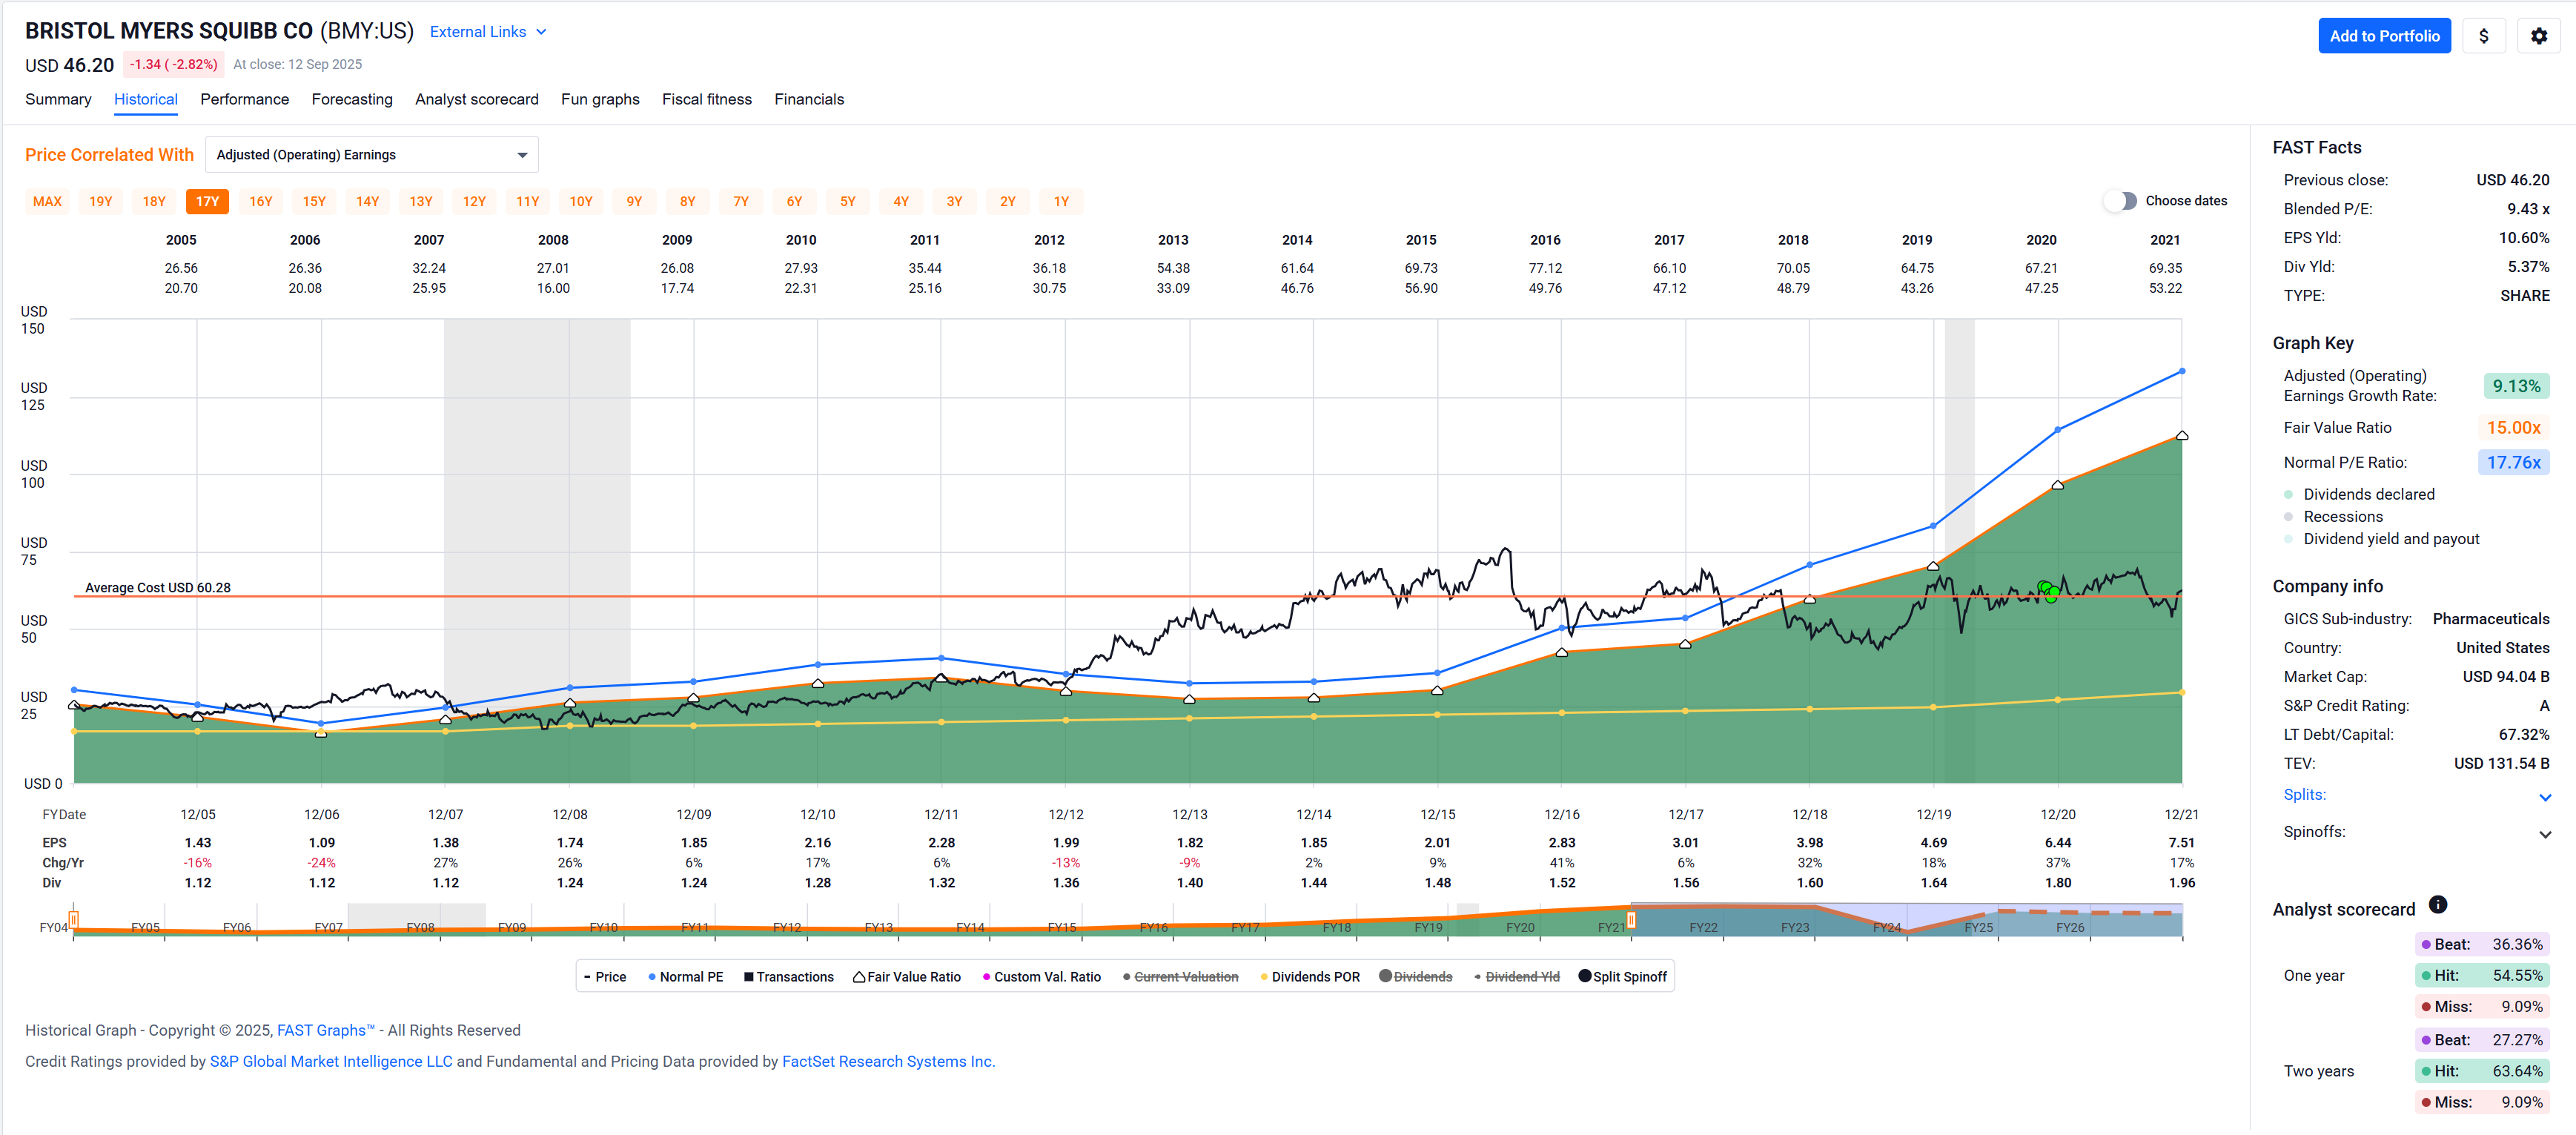
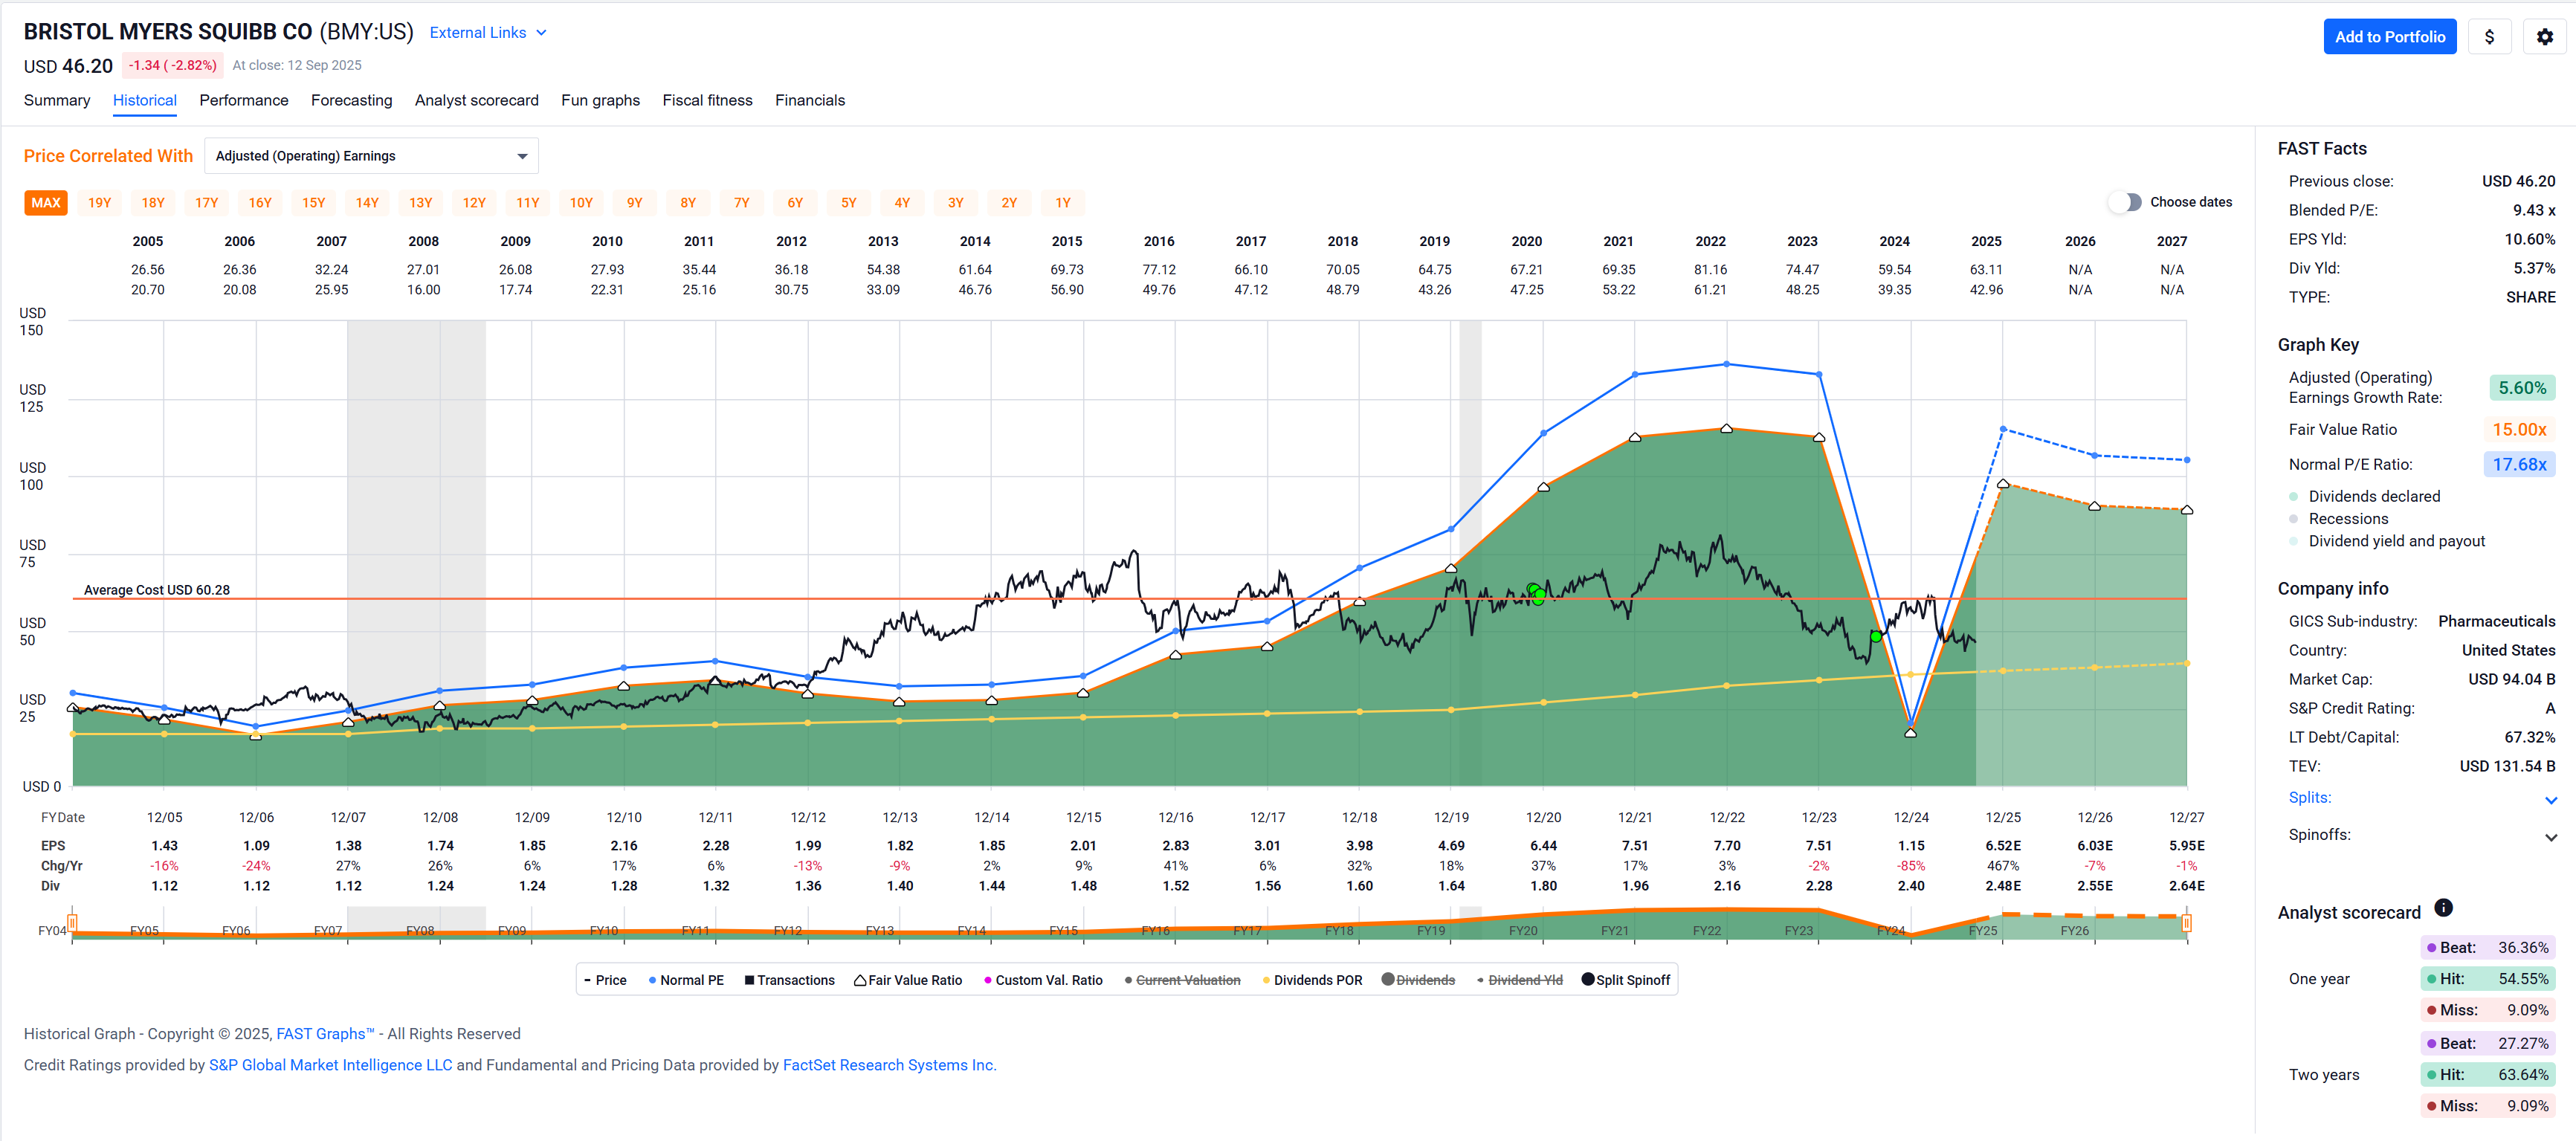
Then there’s some companies where I just slowly shake my head … like Bristol Myers Squibb (BMY).
The “this-thing-is-undervalued” thesis actually didn’t look wrong at the time I bought my first tranche in November of 2020
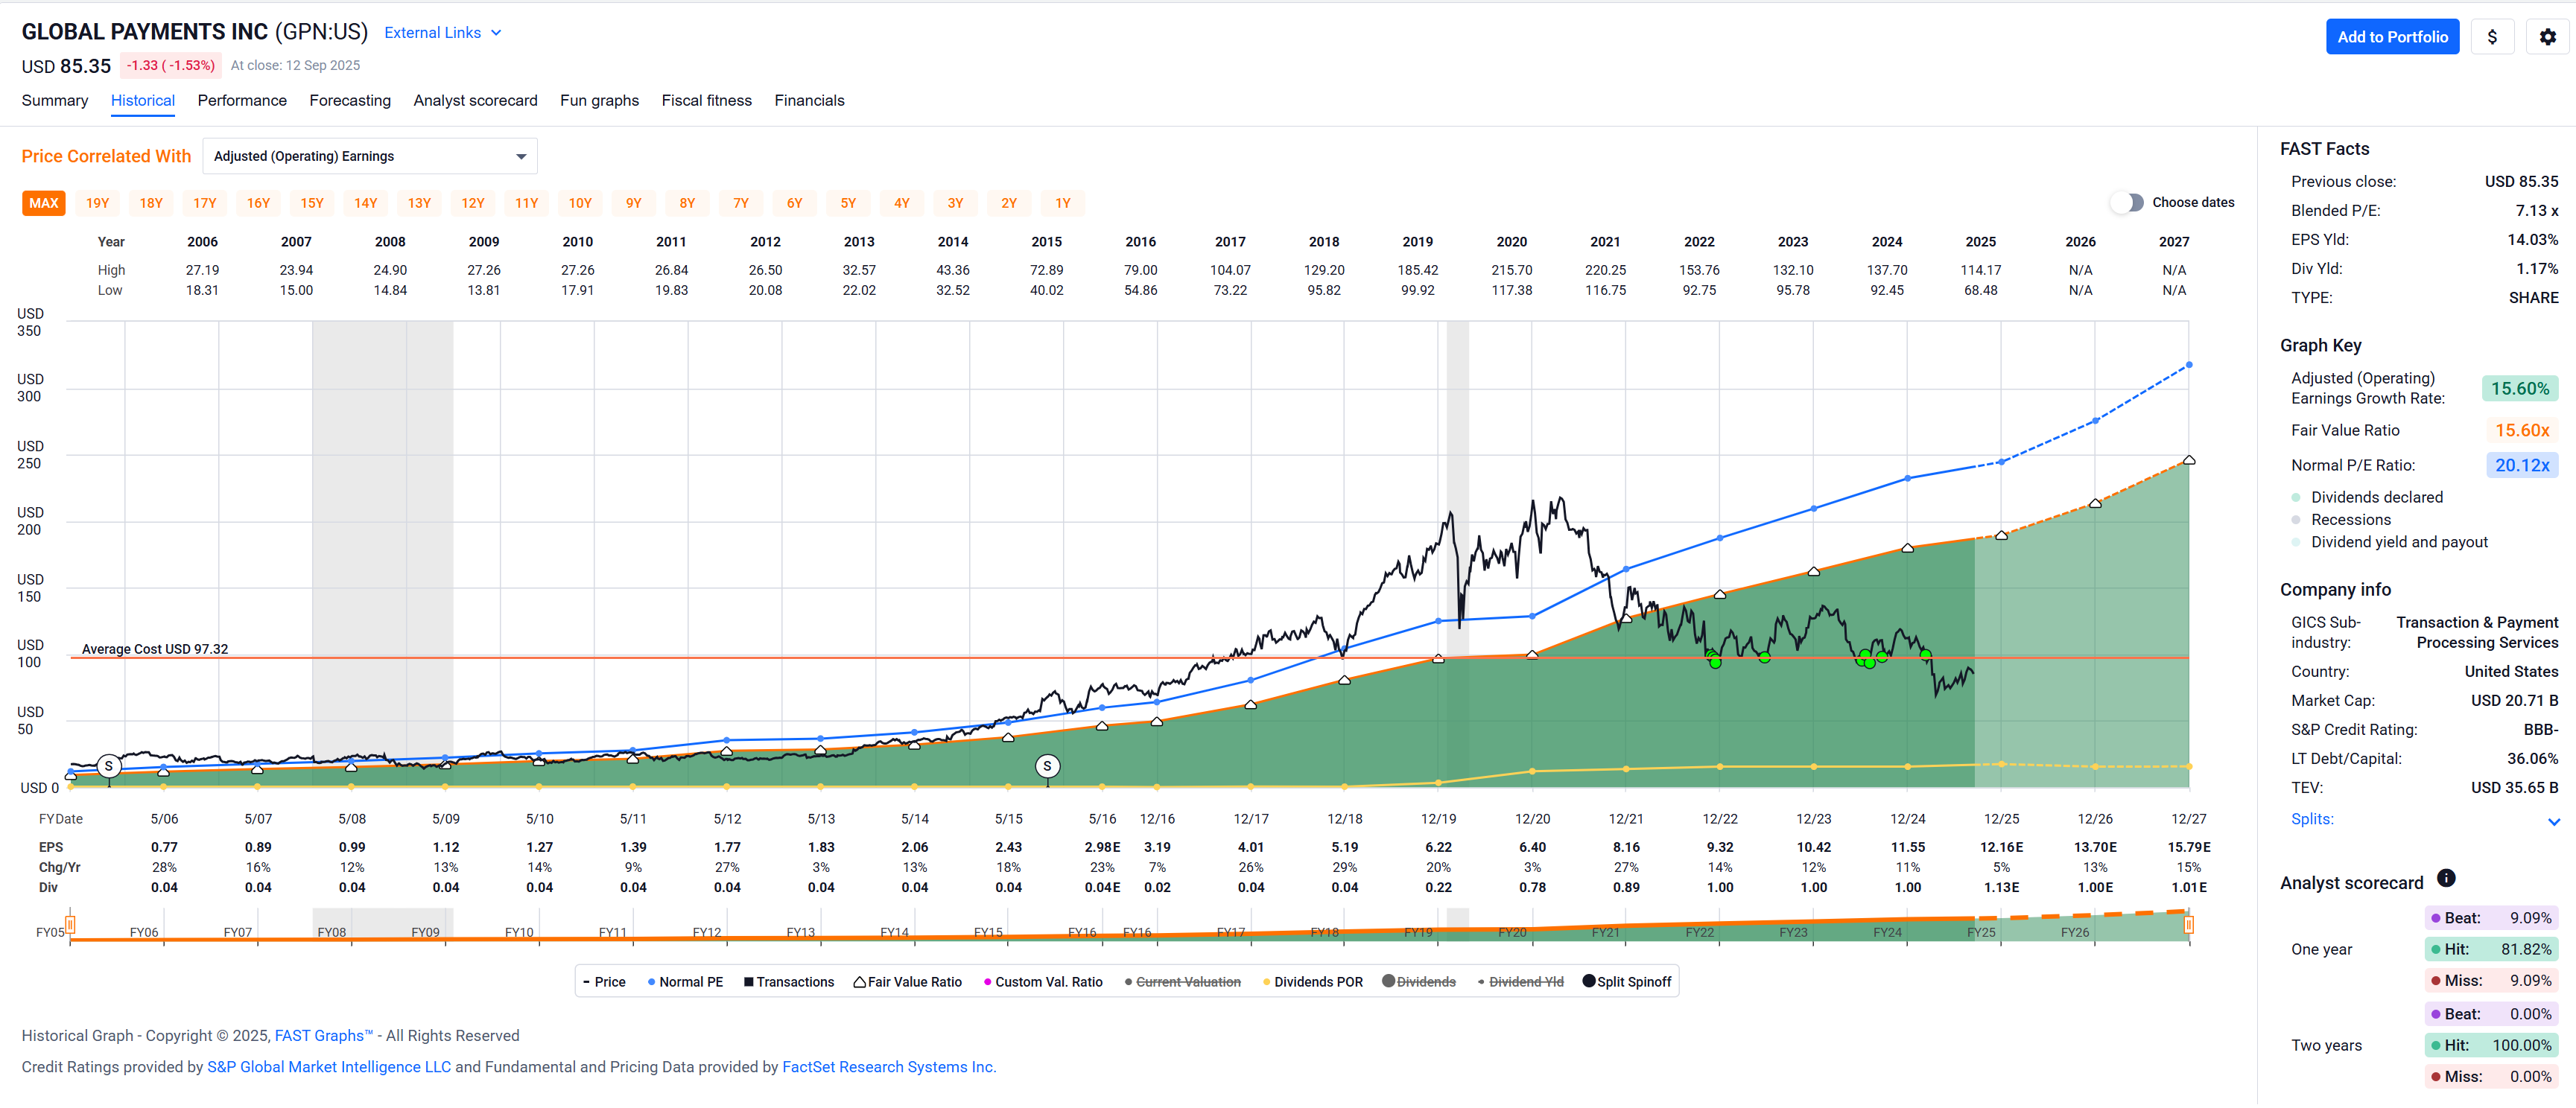
Some companies in my portfolio remain puzzles to me. Like Global Payments (GPN).
Oh, and I bought my initial tranche of Dr. Pepper. I expect to be buying more of this with the price going further down, but I believe it’ll work out long term, i.e. over the next week or so … ![]() [4]
[4]
1 First quarterly dividend after I bought it on Oct 27 2020: 31 cents (ex on Oct 28, no less! ![]() )
)
Latest quarterly dividend paid in August 2025: 53 cents. That’s +70% in five years! Almost the kind of income growth you would get with a regular job … ![]()
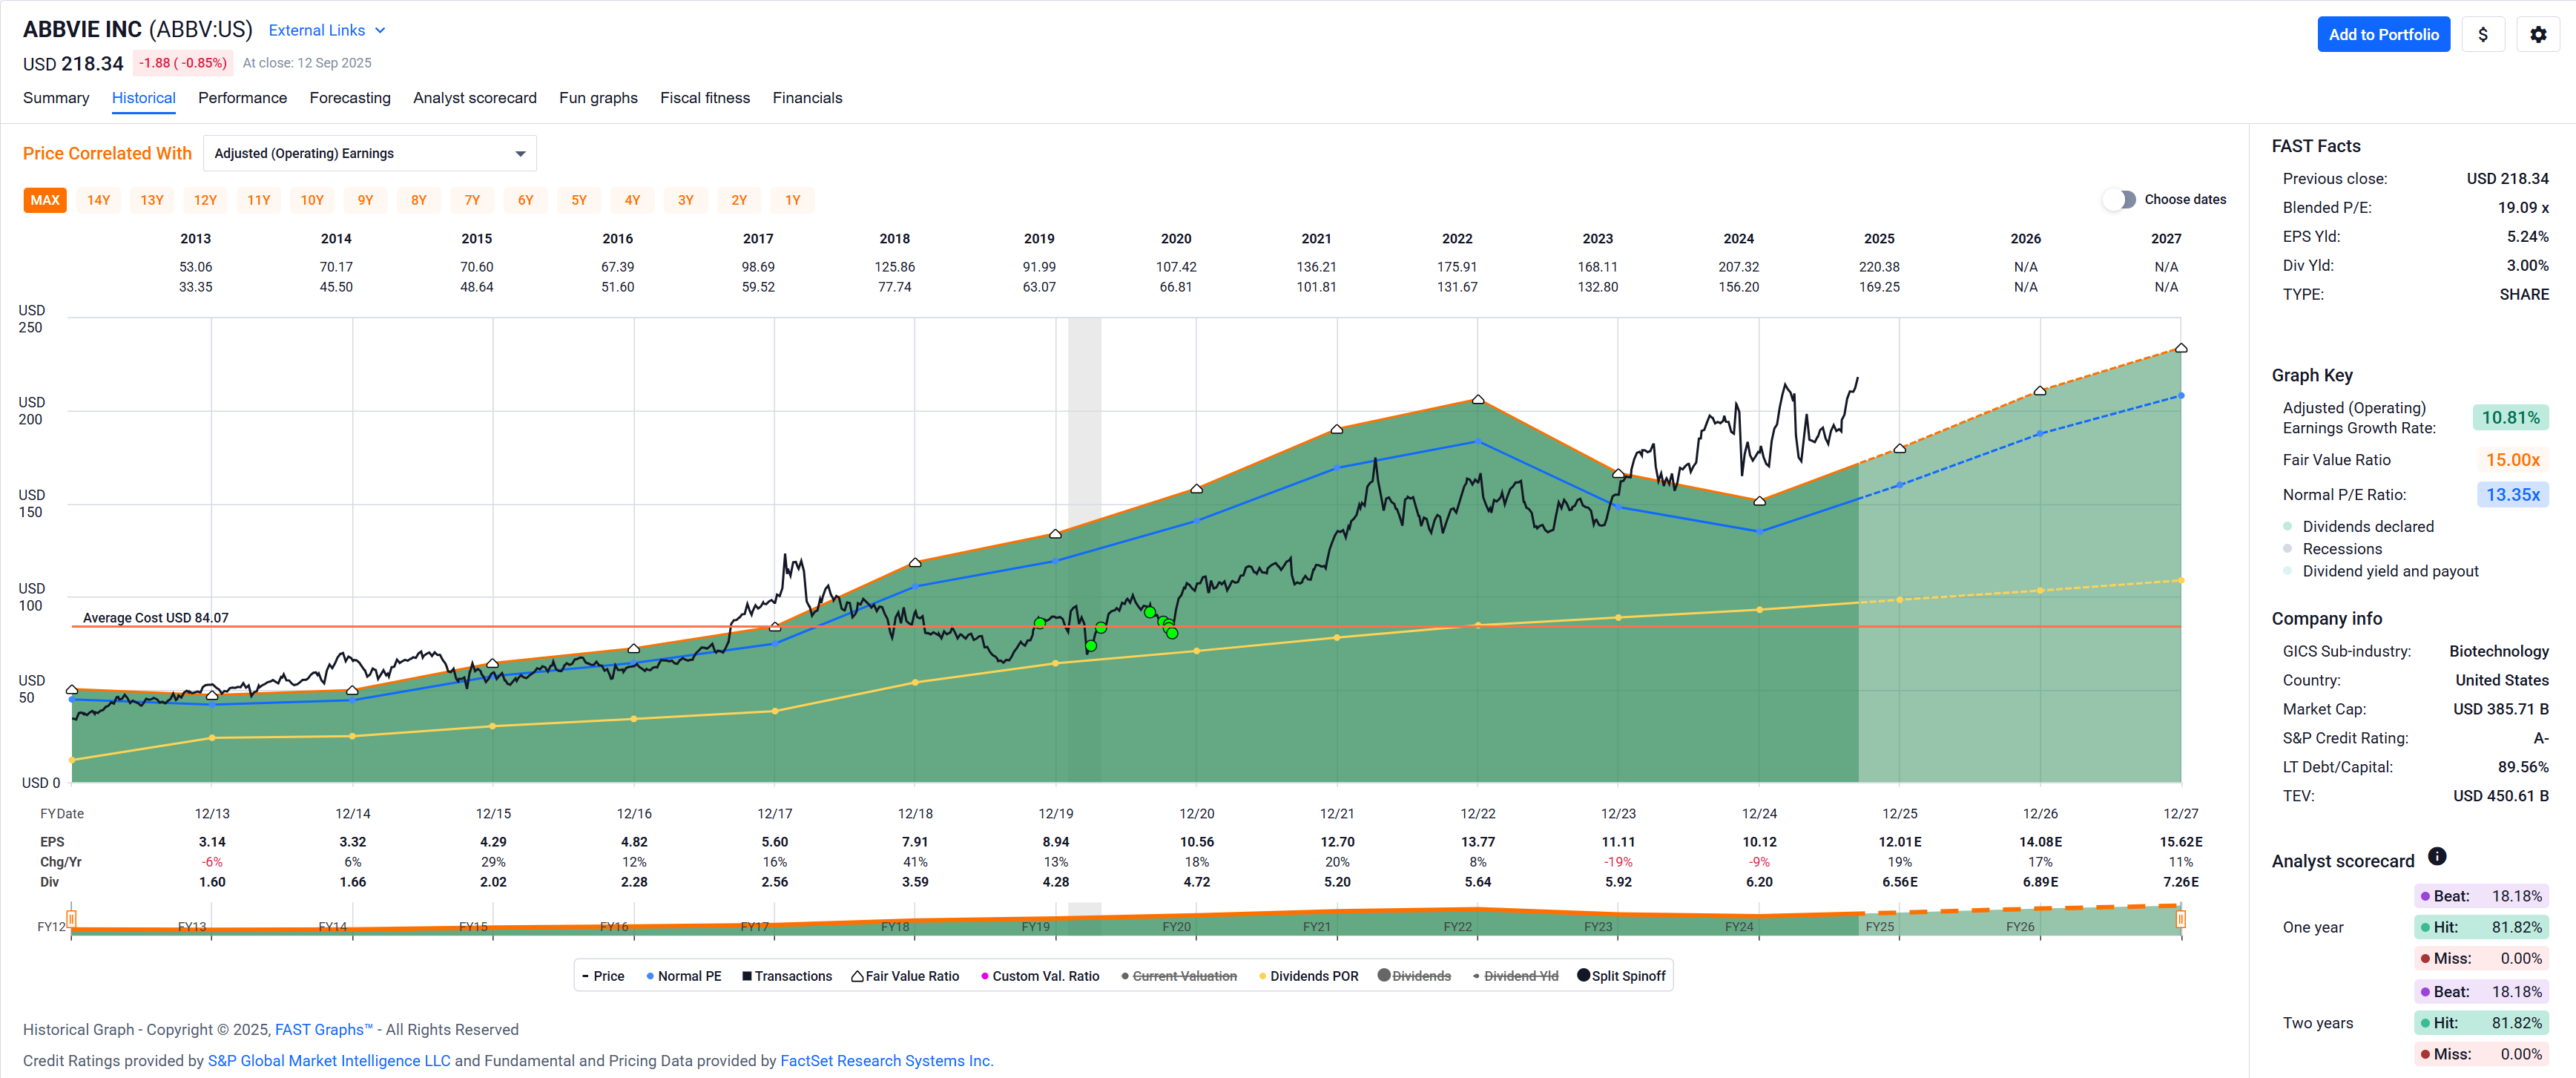
2 Always a risk with pharmaceuticals and biotech, but sometimes it works out just fine. I was in a similar situation with ABBV and it just took a couple of years until the stock price recovered.
In the mean time the dividends kept rolling in – which after all is the main thing I am looking for.
3 The market must know something that I don’t. I’ll hang on to it as it’s a speculative position with less than a 2% positon of my stock picked portfolio and quite some upside if price catches up to earnings again.
4 Just kidding (on the time horizon). I expect this is a buy-and-hold position unless it gets ridiculously overvalued for some reason.
Just checked the last cash flow statement of Dr. Pepper. Don’t like it. FCF payout ratio is over 100%, that is a no-go for me.
I keep on with my method: checking out U.S. Dividend 100 stocks, searching for the highest dividend yield that fulfills my cash flow requirements and is not in a sector I cannot buy any longer ant that is it. Easy peasy and fully mechanic.
Here a list of that index sorted by dividend yield: Finviz
I admit, when writing my post – which was really mostly about everything else in that post than my KDP buy – I was tempted to omit mentioning my KDP buy as I feared I’d trigger you … ![]() … but in the end that’s what makes a market!
… but in the end that’s what makes a market! ![]()
I’m guessing you looked at the 10-K/Q?
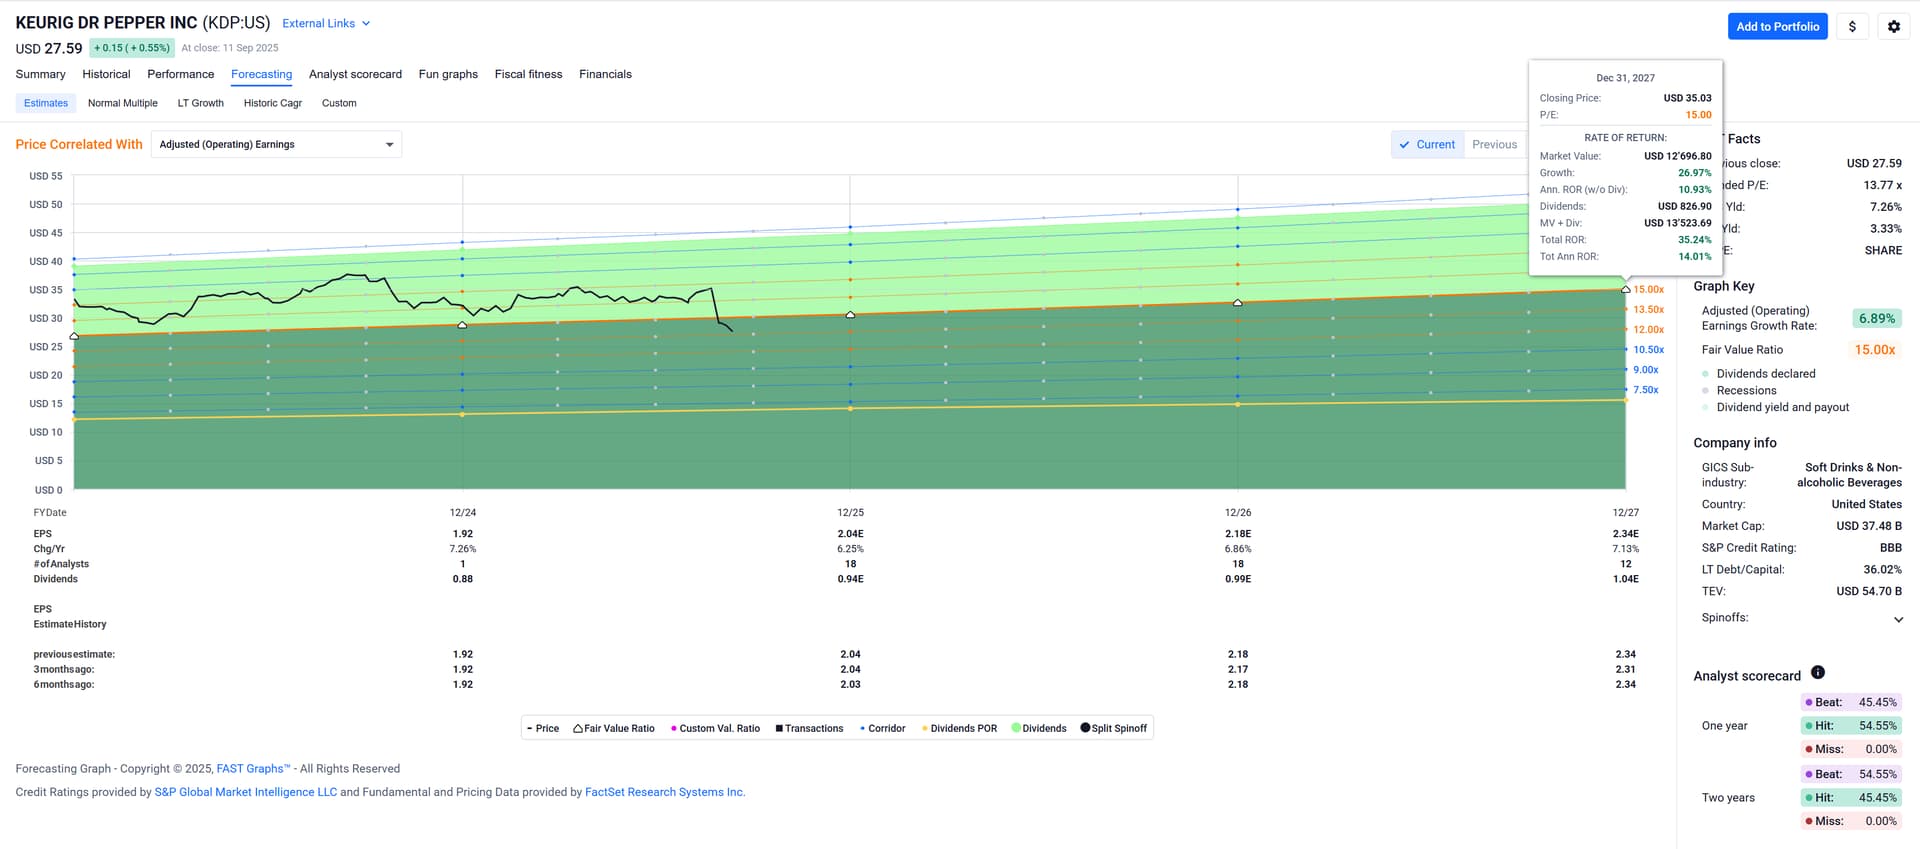
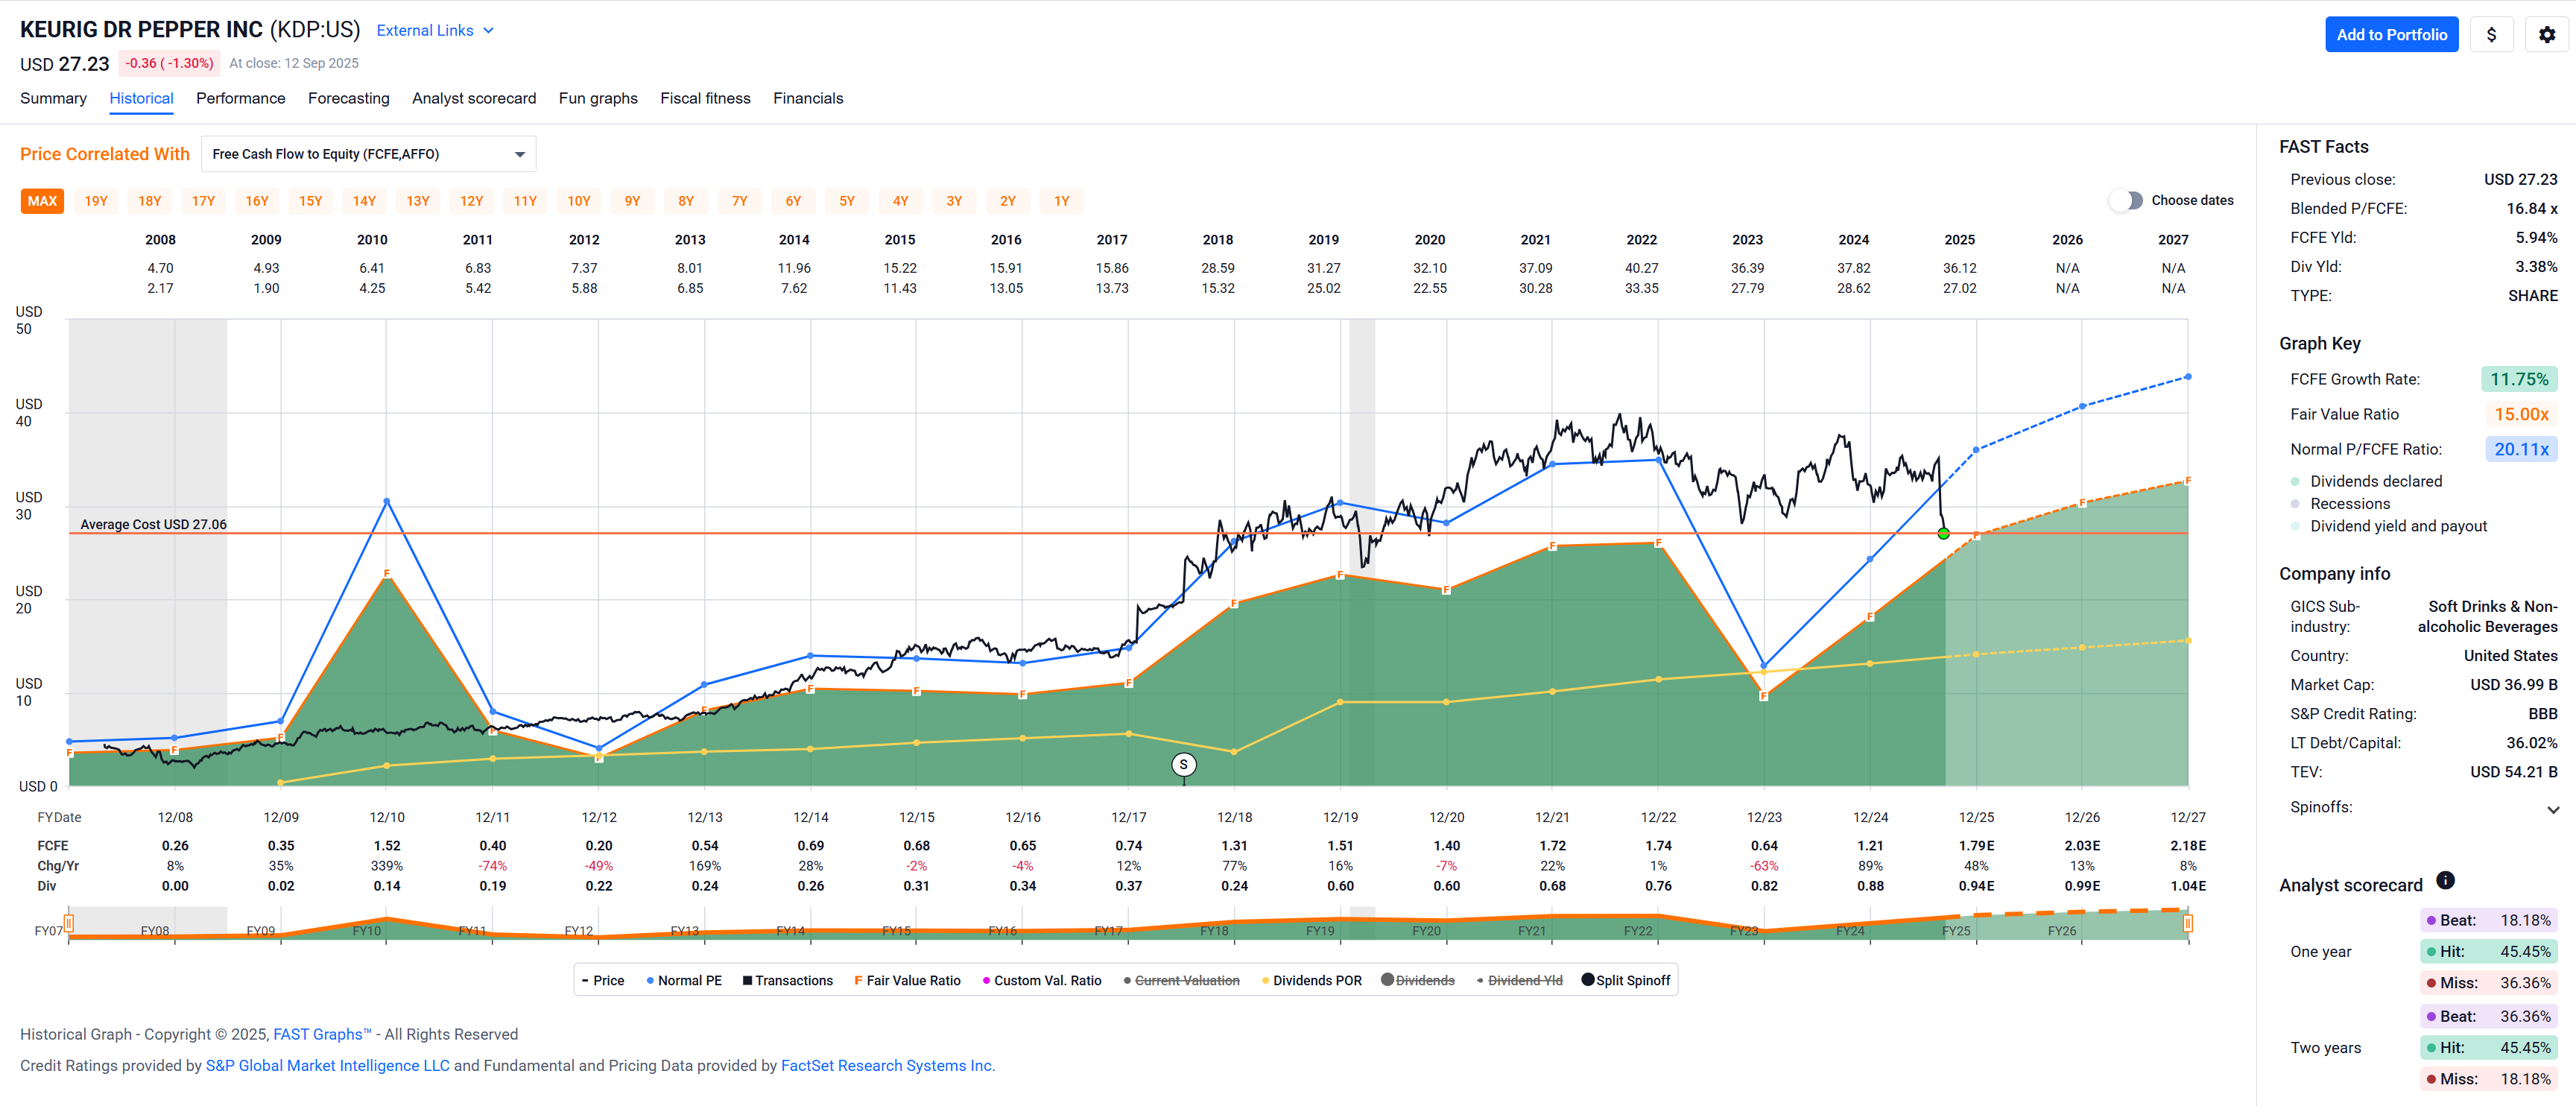
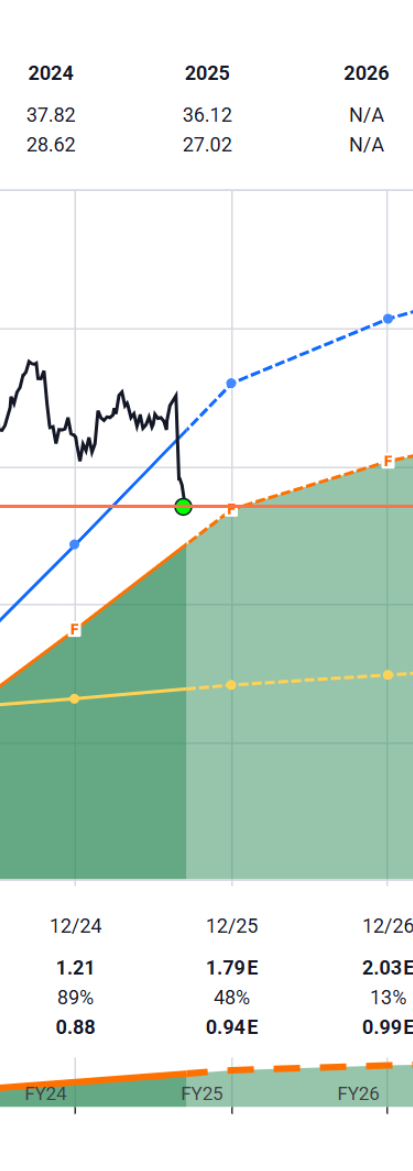
FASTgraphs claims the FCF[$] covers dividends easily:
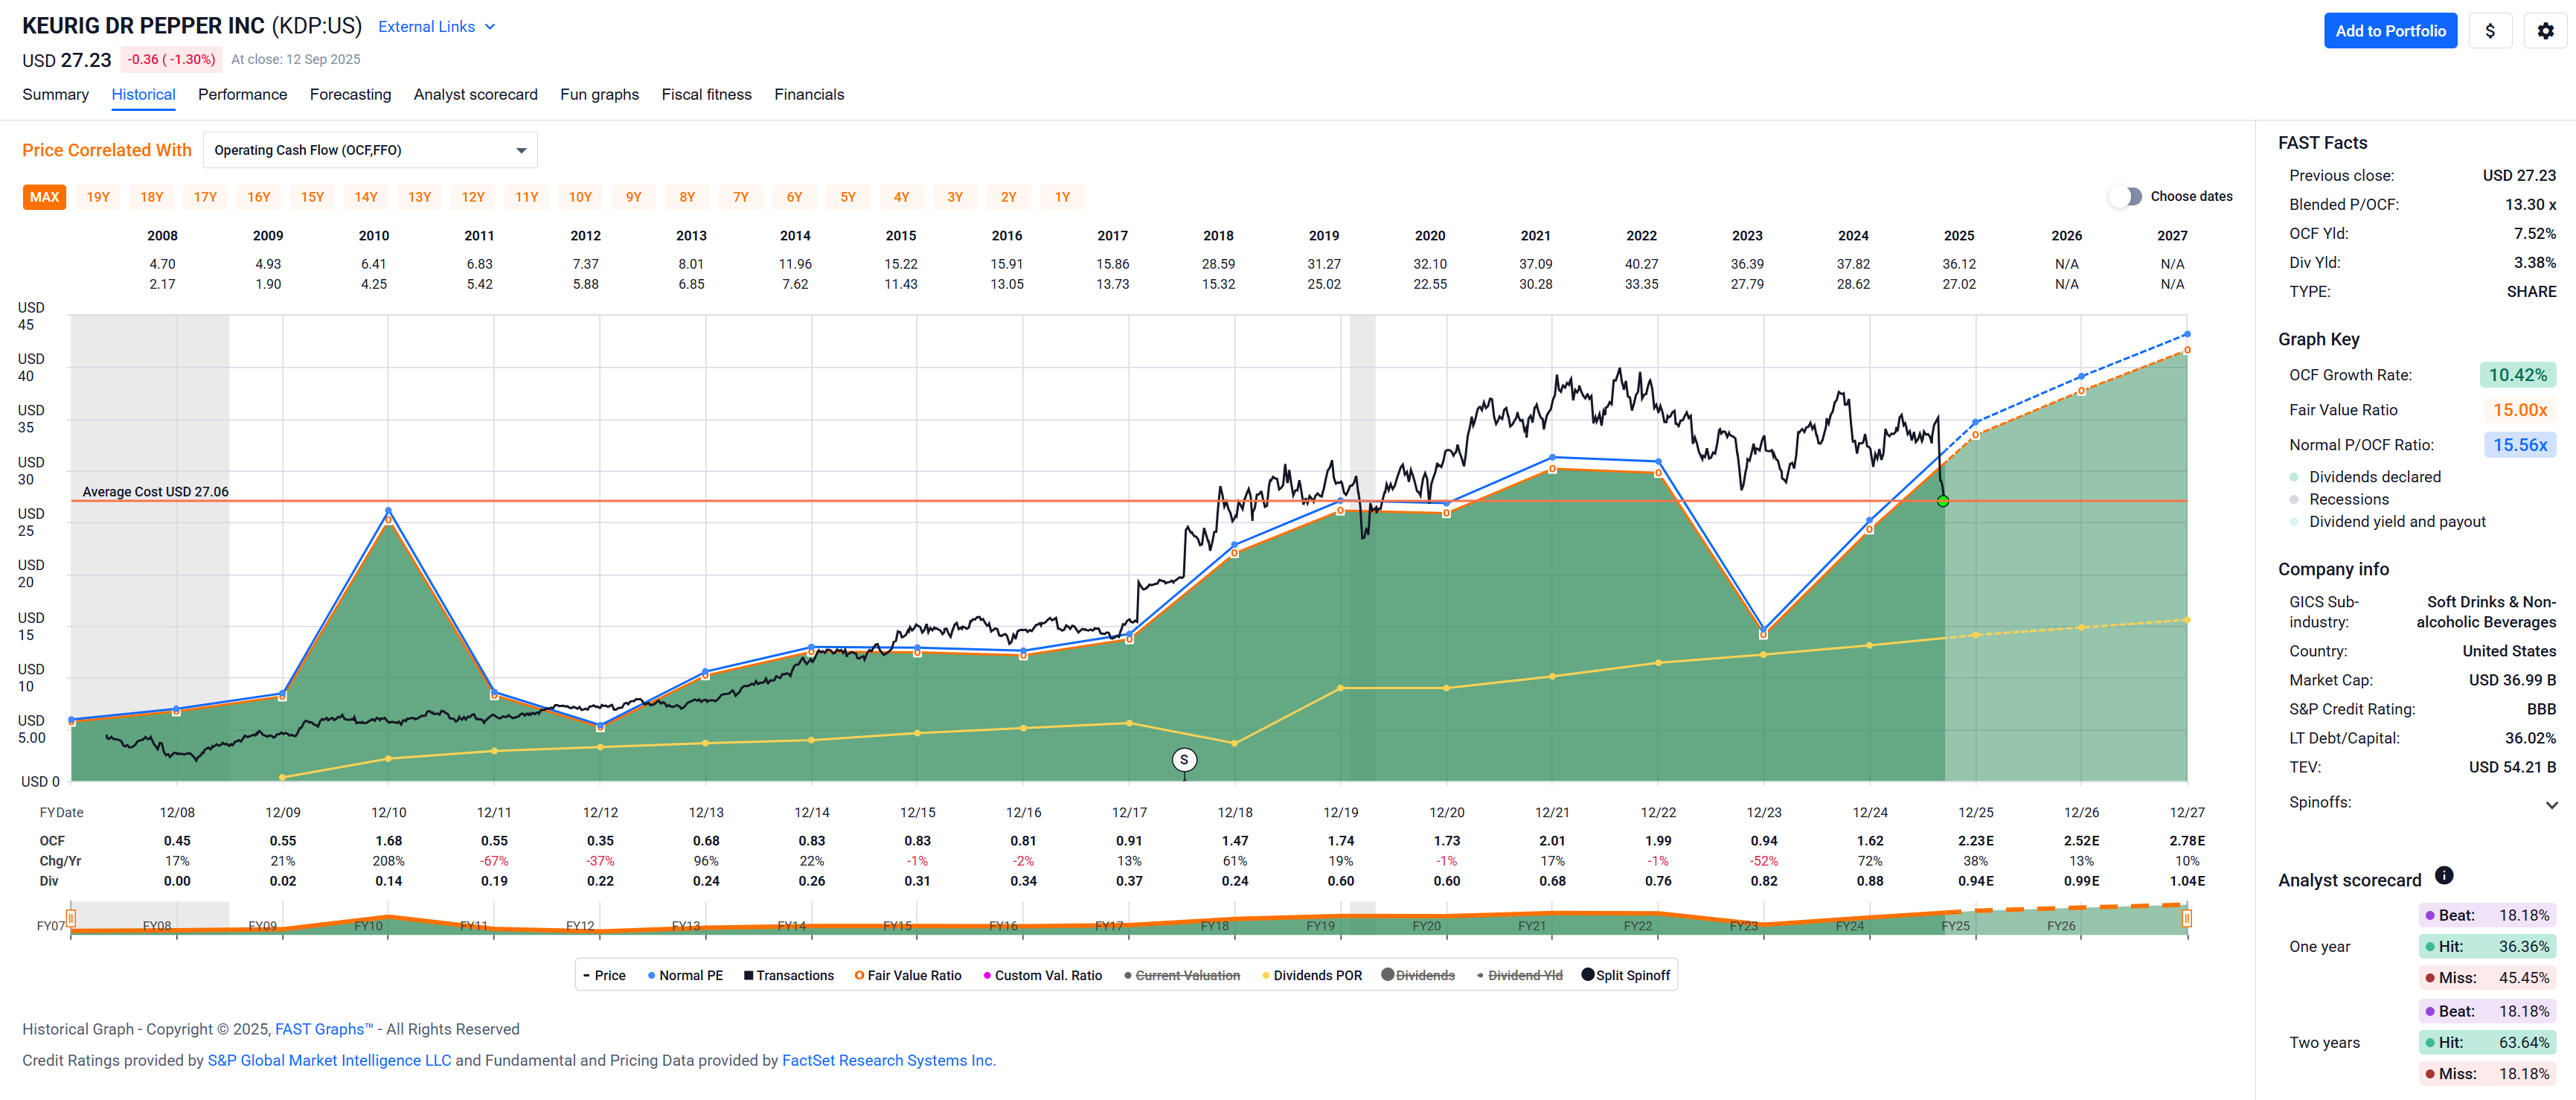
OCF even more easily:
Curious to learn how you arrive at a different conclusion?
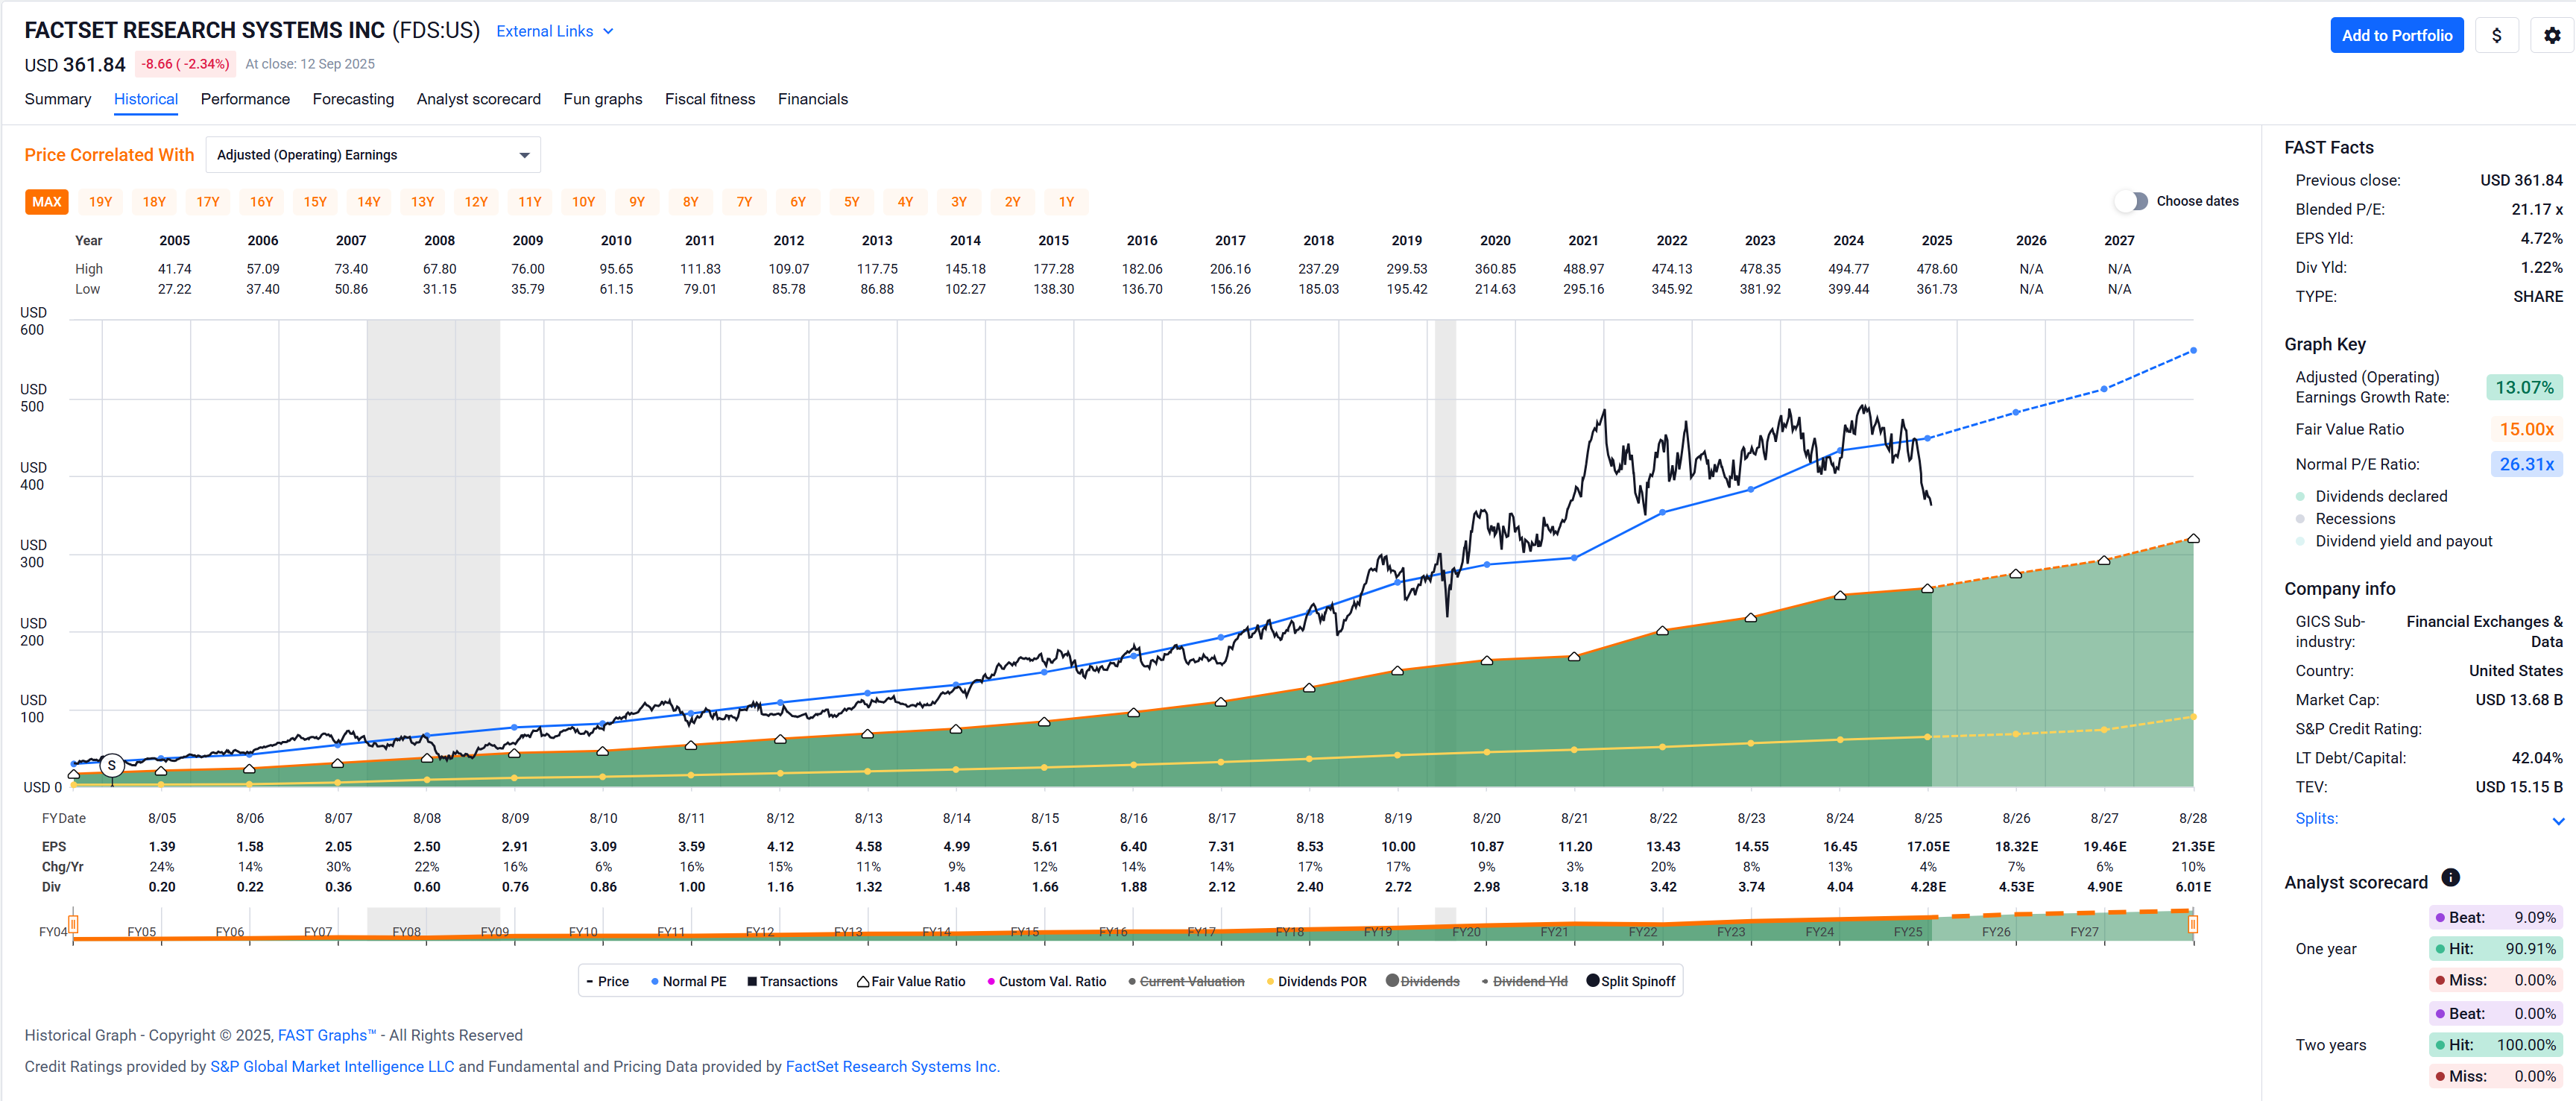
$ FASTgraphs gets (most of) their data from FactSet, which in turn I am certain of devours company financial statements with a small army of analysts.
FactSet Research Systems (FDS) is in fact a company I’d love to own, but they’re almost always expensive – they benefit from being in an oligopoly for providers of financial data.
I love it when somebody has another opinion and I think you helped me already a few times exactly like that. ![]()
The numbers in Edgar in million USD: OCF 640, investment 213 (only capital exp. otherwise 278), dividends 625.
640-213-625= -198
What are the numbers of FASTgraphs, where do they differ?
That’s the thing, there are analysts (eg these) looking at this stuff all the time, and they know their stuff, so wouldn’t it be…priced in?
It’s funny, pharma being the one business I have any serious understanding of, yet it’s so unpredictable that I’d struggle to invest in even if I was allowed to. Then again you have J&J, AbbVie and others who steadfastly somehow manage to raise dividends seemingly forever and in whatever climate, so they have seem to do that right.
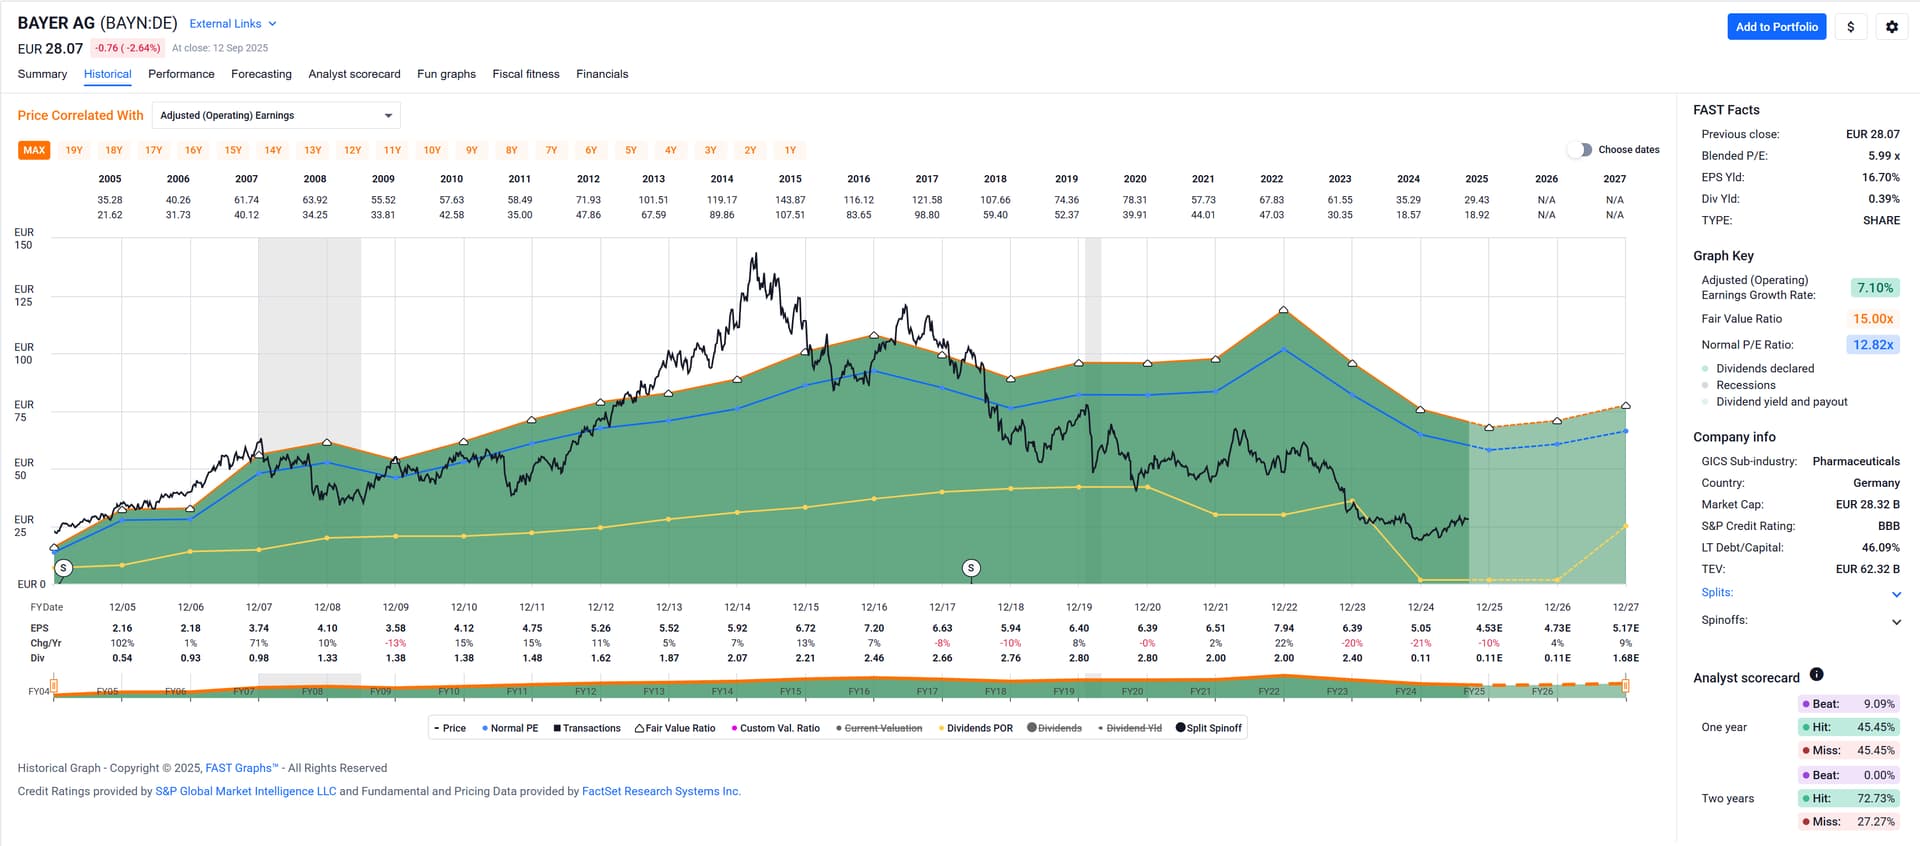
Care to FASTgraph Bayer? I expect a horror show ![]()
I’ve looked at them before. They look like a … ahem, turd show?
I mean, going forward they might even look attractive, but look at the history of them poo-pooing all over the place, especially regarding dividends.
Perhaps from a pure price specalation POV it might be worth a shot? I don’t participate in playing that game, though, as I am just a simple (dividend) mind.
Likewise!
This link appears to lead to this page, at least for me:
I believe the first obvious difference is that FASTgraphs aggregates to yearly data points (versus the quarterly ones (that I assume) you’re looking at? For the yearly FASTgraph/FactSet numbers please see the graphs in my previous posts where FCF and OCF is depicted (per share), but only in fiscal yearly terms (e.g. expected $1.79 FCF for 2025 and expected $0.94 in dividends for the same fiscal year.
While FactSet provides much more granular data, I unfortunately do not have direct access to it. The subscription fee is pretty rich – high 5 to low 6 digits CHF per desk per year IIRC.
Now the embarrassing part:
I do have access to a Bloomberg terminal – kind of the gold standard for financial data, both current as well as historic – but I can’t navigate it to produce tables of FCF or OCF for KDP in order to argue about the actual numbers for KDP.
I’m just not well versed enough for entering the keyboard shortcuts that would produce those tables.[OT] If anyone knows the key control sequence for producing such tables, please post.
Lastly, independent of Bloomberg or FASTgraphs: I’m not very familiar with this, but I am guessing that companies try to get their numbers appealing on a (fiscal) yearly basis, not just on a quarterly this-and-that argument (which unfortunately seems to be the rule nowadays).
Thus, judging KDP on a quarterly basis may be premature.
But what do I know?
OT (Off Topic) The keyboard shortcuts for the Bloomberg terminal remind me of the keyboard shortcuts for using Unix text editors VI or Emacs – I’m fluent in both VI (close to native speaker) and Emacs (first 2nd language learned)
Sorry for the link, seems a direct link does only work for a short time.
Try this and then select the last one: https://www.sec.gov/cgi-bin/browse-edgar?company=&match=&CIK=kdp&type=10-Q&filenum=&State=&Country=&SIC=&owner=exclude&Find=Find+Companies&action=getcompany
And yes, the first two quarters had the same problem last year while the year end data looks better. However, it got slightly worse this year. I do not use the last 4 quarters but once a quarterly and yearly report are not to my satisfaction… out with it.
I rely on Edgar for data. Maybe a little trick, you can add a one letter search engine with the link above to google chrome. And of course, Edgar works only for U.S. traded stocks.
Dear Gurus ![]()
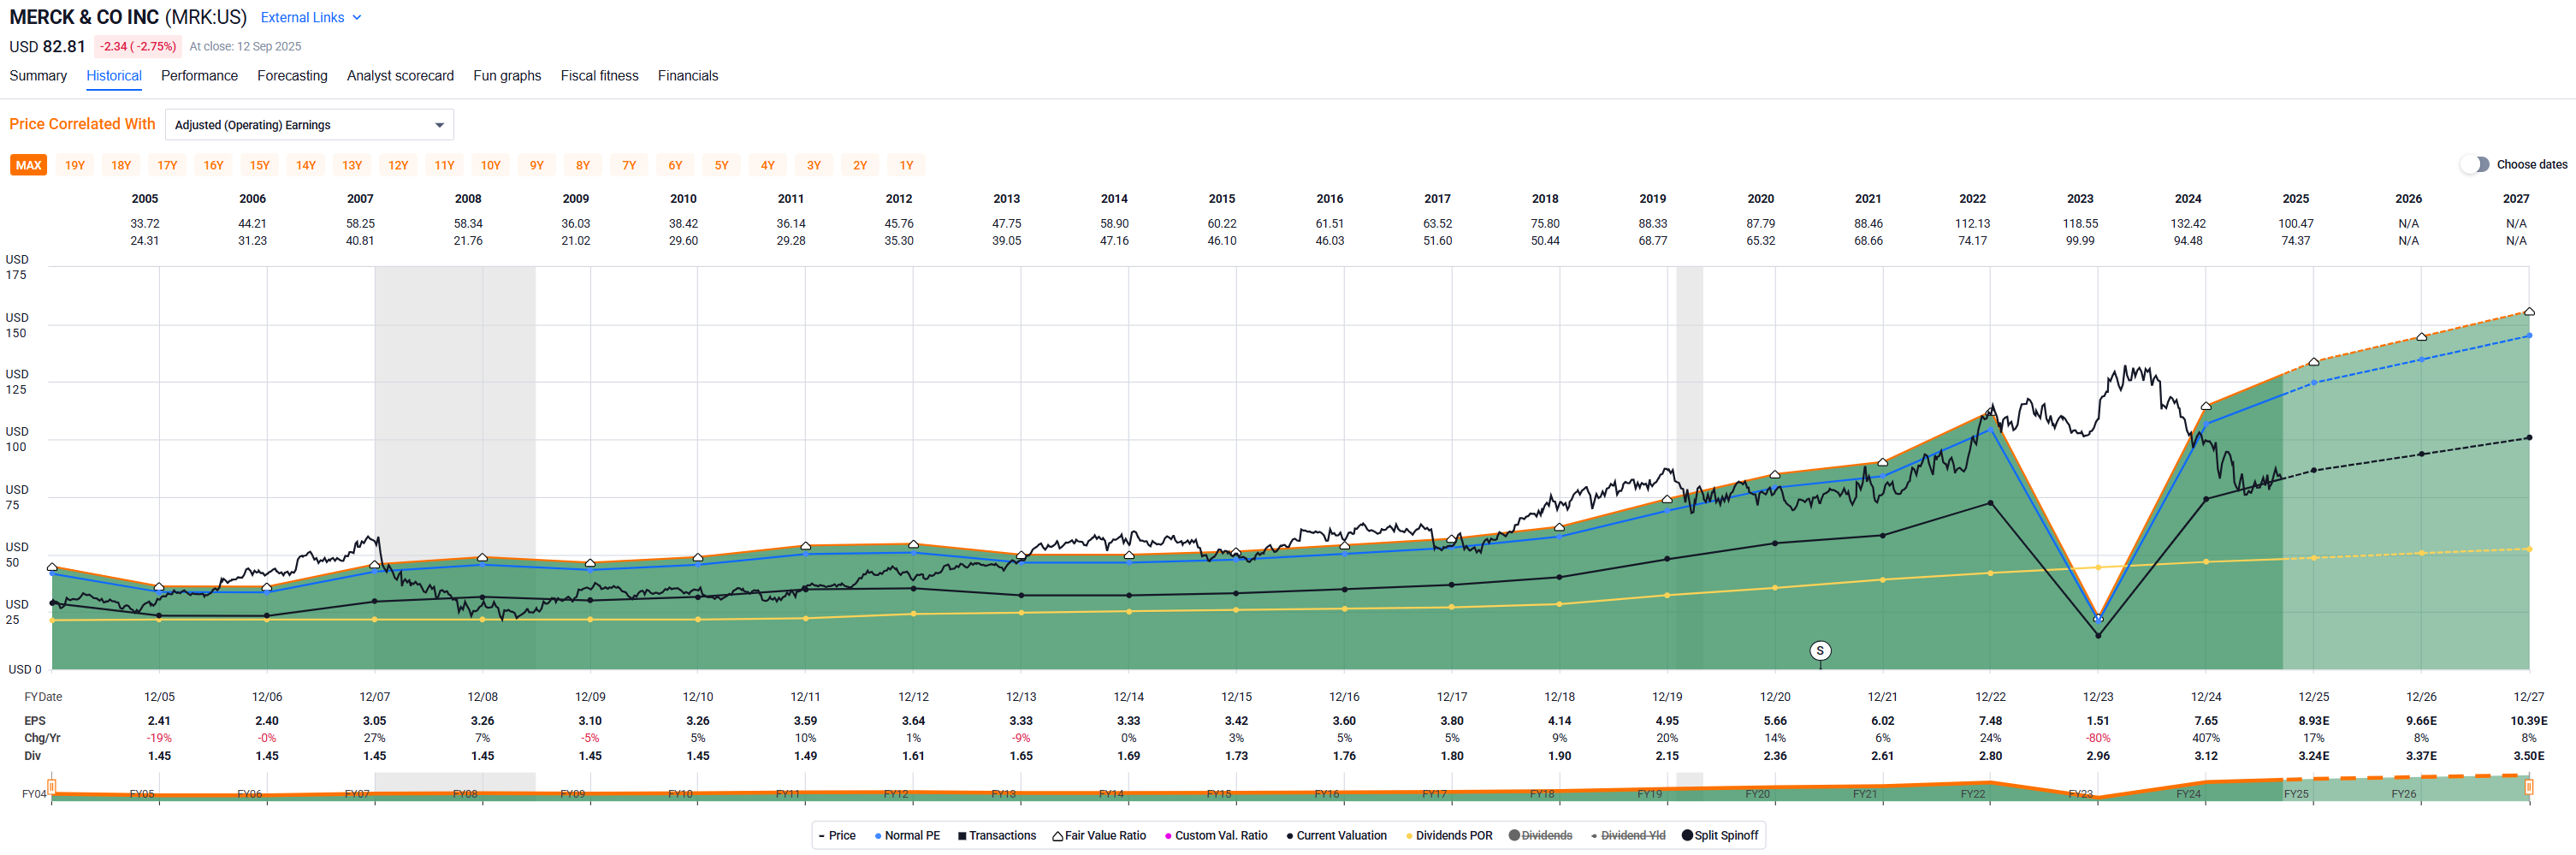
I just stumbled upon Merck, can I pls get your views?
(disclaimer: I still need to read up for DD on my own, but the numbers/graphs look interesting).
Quarterly is a little too noisy for my taste. Some new investment in this quarter, some special tax situation in that quarter, FX headwinds in the 1H of 2025 … probably easy to account for if you read the 10-Q, but I’ll just go with the yearly data aggregated in FASTgraphs. Call me lazy … ![]()
Keurig has raised their dividend since they initiated one in 2009 and their (financial year) FCF has covered the dividend with two exceptions: 2012 and 2023. We’ve disagreed on this before – I like it when the company continues to pay their dividend even if cash flow in some years might not cover it as long as the fundamentals of the business are still ok long term. With Keurig, I feel like that’s still the case as they continue to grow their business and their earnings at a nice cliff.