Yeah, great question and I cannot answer it.
Thanks for beating the FOMO out of me … ![]()
Yeah, great question and I cannot answer it.
Thanks for beating the FOMO out of me … ![]()
someone should fire the person who implemented the default color picker on justetf.com
Replying here since it seems more suitable than the Chronicles of 2025 topic.
I actually dumped my entire portfolio (stock picks plus VXUS plus a couple of smaller bond holdings) into Gemini the other day to have it check my US exposure and it came out at about 2/3 (67.8%).
The VT US exposure is just a little above 60%, so I am only slightly overweight the US, which surprised me.
Contrary to the VT degens aficionados, though, I don’t◊ hold any mag 7 companies (which – acording to Gemini – make up about 16% of the VT).
I like it!
[◊] Except via ETFs in retirement accounts.
Oooh ![]()
Aaah ![]()
I think most research is available for US companies, so I wouldn’t be surprised if lot of active investors have high US exposure
Huh … true, but … thought twist: how many active investors follow “research”?
I guess it depends on the definition of “research”, but I for one certainly pretty much completly ignore “research” except for analyst estimates on forward earnings (but not price!).
By research I mean -: forward earnings estimate, fundamental analysis, trend analysis , etc
If some calls themselves active, they should atleast study the companies they invest in. Or else it sounds like random picking of stocks ![]()
Hmm.
Maybe we’re discussing “potAto potAhto”![]() here, but I believe what you seem to be calling “research” would not be “research” in my book. Or maybe I misunderstood (or simplified).
here, but I believe what you seem to be calling “research” would not be “research” in my book. Or maybe I misunderstood (or simplified).
“Forward earning estimates” is basically analysts doing hepatoscopy, i.e. looking at the liver of a freshly sacrificed sheep, offered by the company executives to the market gods, and analysts concluding from their liver impression the next couple of quarters’ earnings for the company.
Contrary to me ridiculing this approach, and despite the somewhat bloody and certainly unscientific method, I believe this is (still) the best![]() “research” done by analysts.
“research” done by analysts.
Be prepared, from here on it get worse …
Trend analysis? This is just wiggly charts, drawing lines and extrapolating into the unknown future. Certainly nothing I would label as “research”.
Fundamental analysis? Here we might agree, but probably only on the literal terms themselves (versus their meanings to each of us).
To me, fundamental analysis is the work I do to convince myself of buying or selling and I’ll look at – spoiler alert! – FASTgraphs, company presentations, 10Ks and 10Qs, earnings & dividend history, forward earning estimates, etc.
But I’ll ignore deeply sector and industry familiar analyst Mr.-Super-Sharp at bank Blablabla thinking shares of company TBLAT will go up/down/sideways.
[![]() ] Let’s Call The Whole Thing Off
] Let’s Call The Whole Thing Off
[![]() ] Comparatively speaking.
] Comparatively speaking.
[ T ] Ticker symbol is pure imagination.
With arrival of veo3
I would have expected a Flow movie for this screenplay ![]()
(I had to google veo3 … and I am still confused about the Flow movie reference – maybe it’s an AI generated movie?)
Sooo…Navitas?!
What is the lot size? Are there futures?
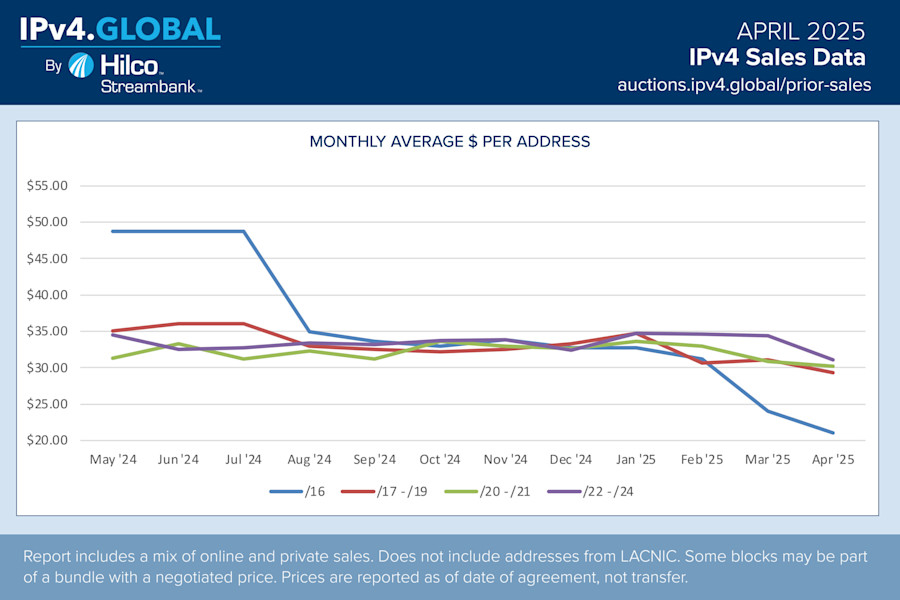
Standard* lot sizes are /24** (256 addresses), /16 (around 65k addresses) and /8 (about 16.7 million addresses).
The chart provided above lists prices for lots (“blocks” in network speak) /16, /17 to /19, /20 to /21 and /22 to /24. Only the price for /16 blocks/lots seems to be sinking significantly – you’ll pay about 20 x 65536 = 1.3 million USD for such a lot. There are 65536 /16 blocks/lots in total.
The arbitrage opportunity is to buy /16 lots, split them up and resell smaller sized (and higher priced) ones. Of course, apart from higher up-front cost you need to run infrastructure to do this, and it looks like it costs about $10 per IP address to run this infrastructure.
No futures, I’m afraid.
[**] /24: of the 32 bits available 24 are defined and 8 are left for you to assign. 2^8 = 256.
/16: of the 32 bits available 16 are defined and 16 are left for you to assign. 2^16 = 65536.
Etc.
i might be over exposed. I already own
10.0.0.0 – 10.255.255.255,
172.16.0.0 – 172.31.255.255,
and 192.168.0.0 - 192.168.255.255
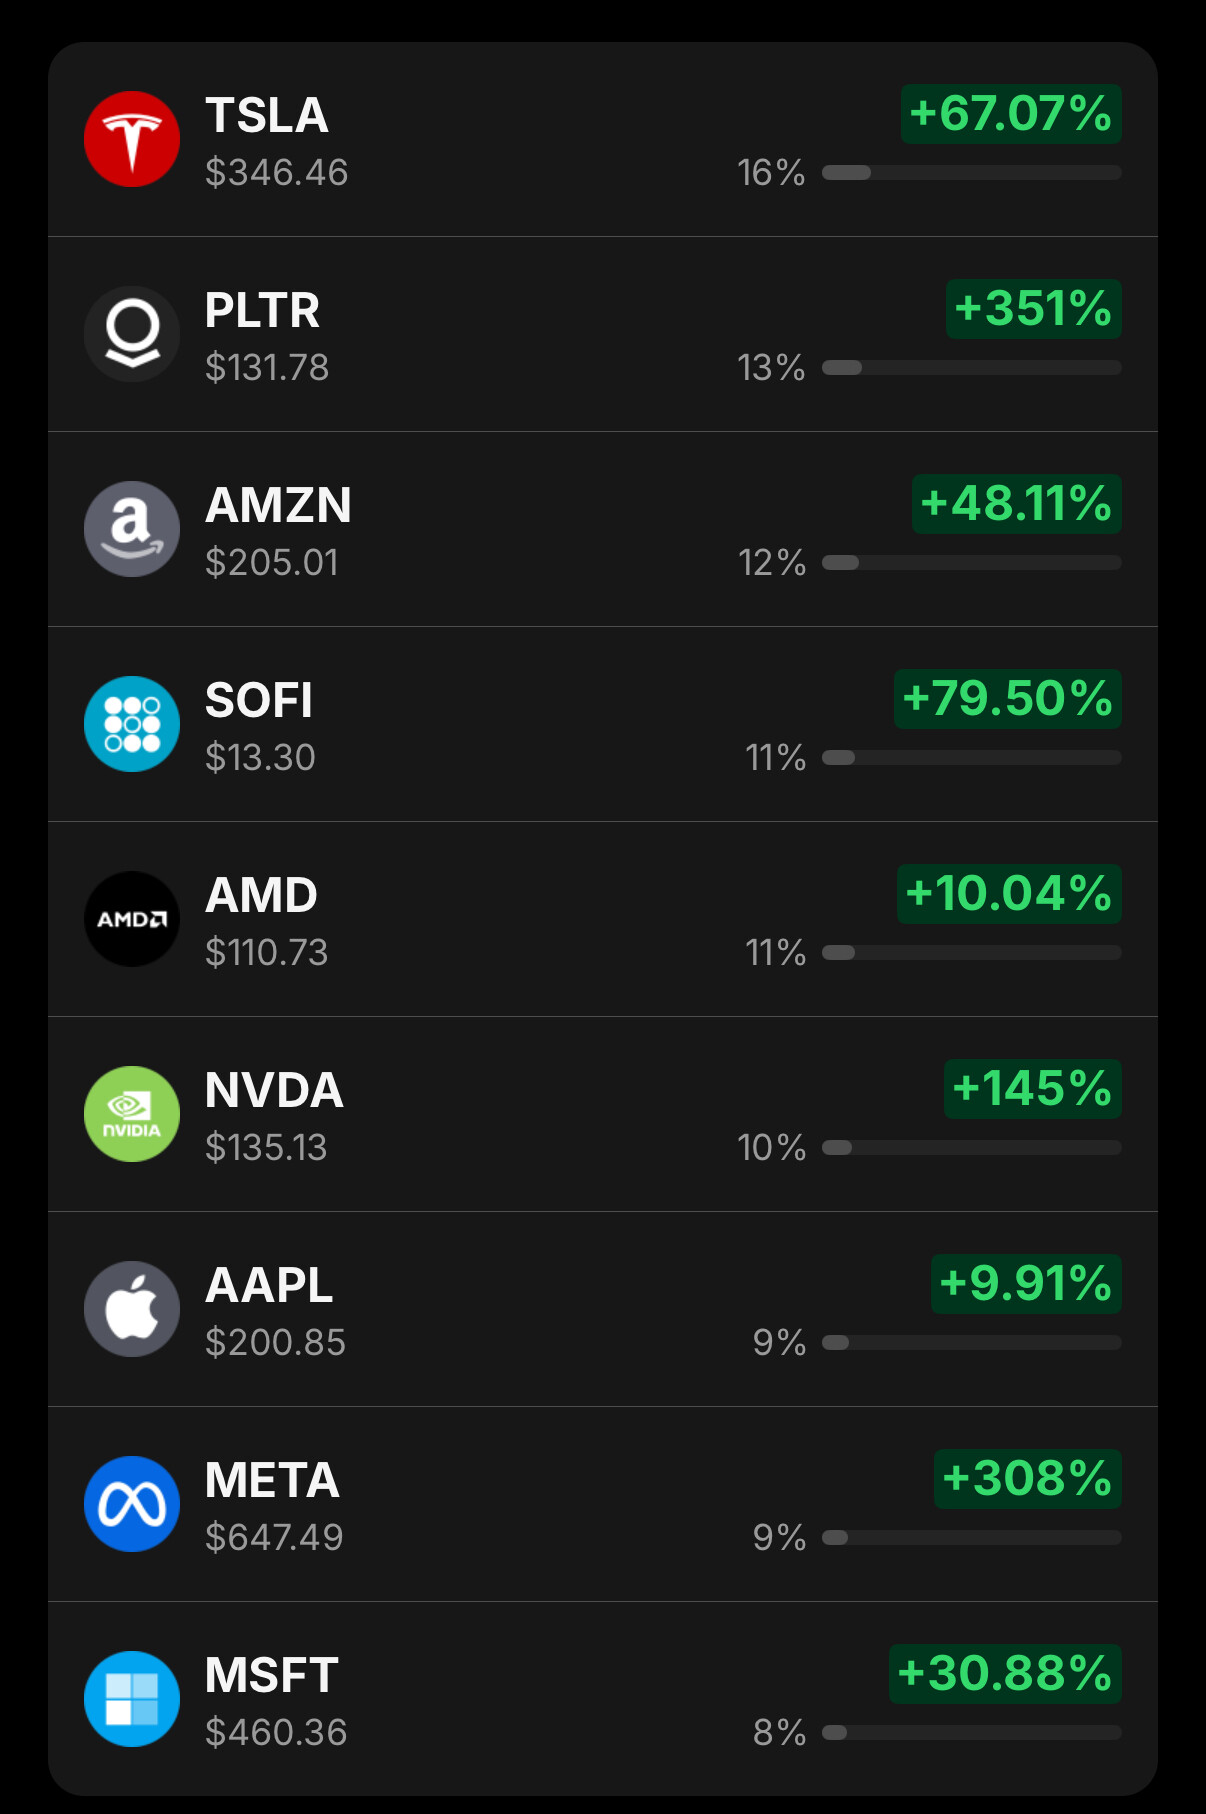
Have been into some growth stocks for some years now.
Have only trimmed PLTR once. Holding all long term along with my core ETF.
Looks nice, but not even a 3- or 4 digit bugger. Is that really worth the risk?
Sir, these are communist address blocks.
Reluctantly sold my corporate bonds today. They were running until 2027 and 2029 with YTM of up to 12%, but I wanted liquidity and so wanted to sell them while the market for them is still relatively liquid.