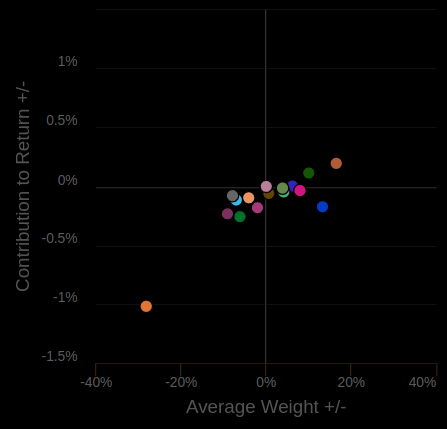
Sector allocation mostly postive so far. Overweight in energy is the main drag on portfolio.
Main winners are: underweight tech, overweight materials and real estate
Sector allocation mostly postive so far. Overweight in energy is the main drag on portfolio.
Main winners are: underweight tech, overweight materials and real estate
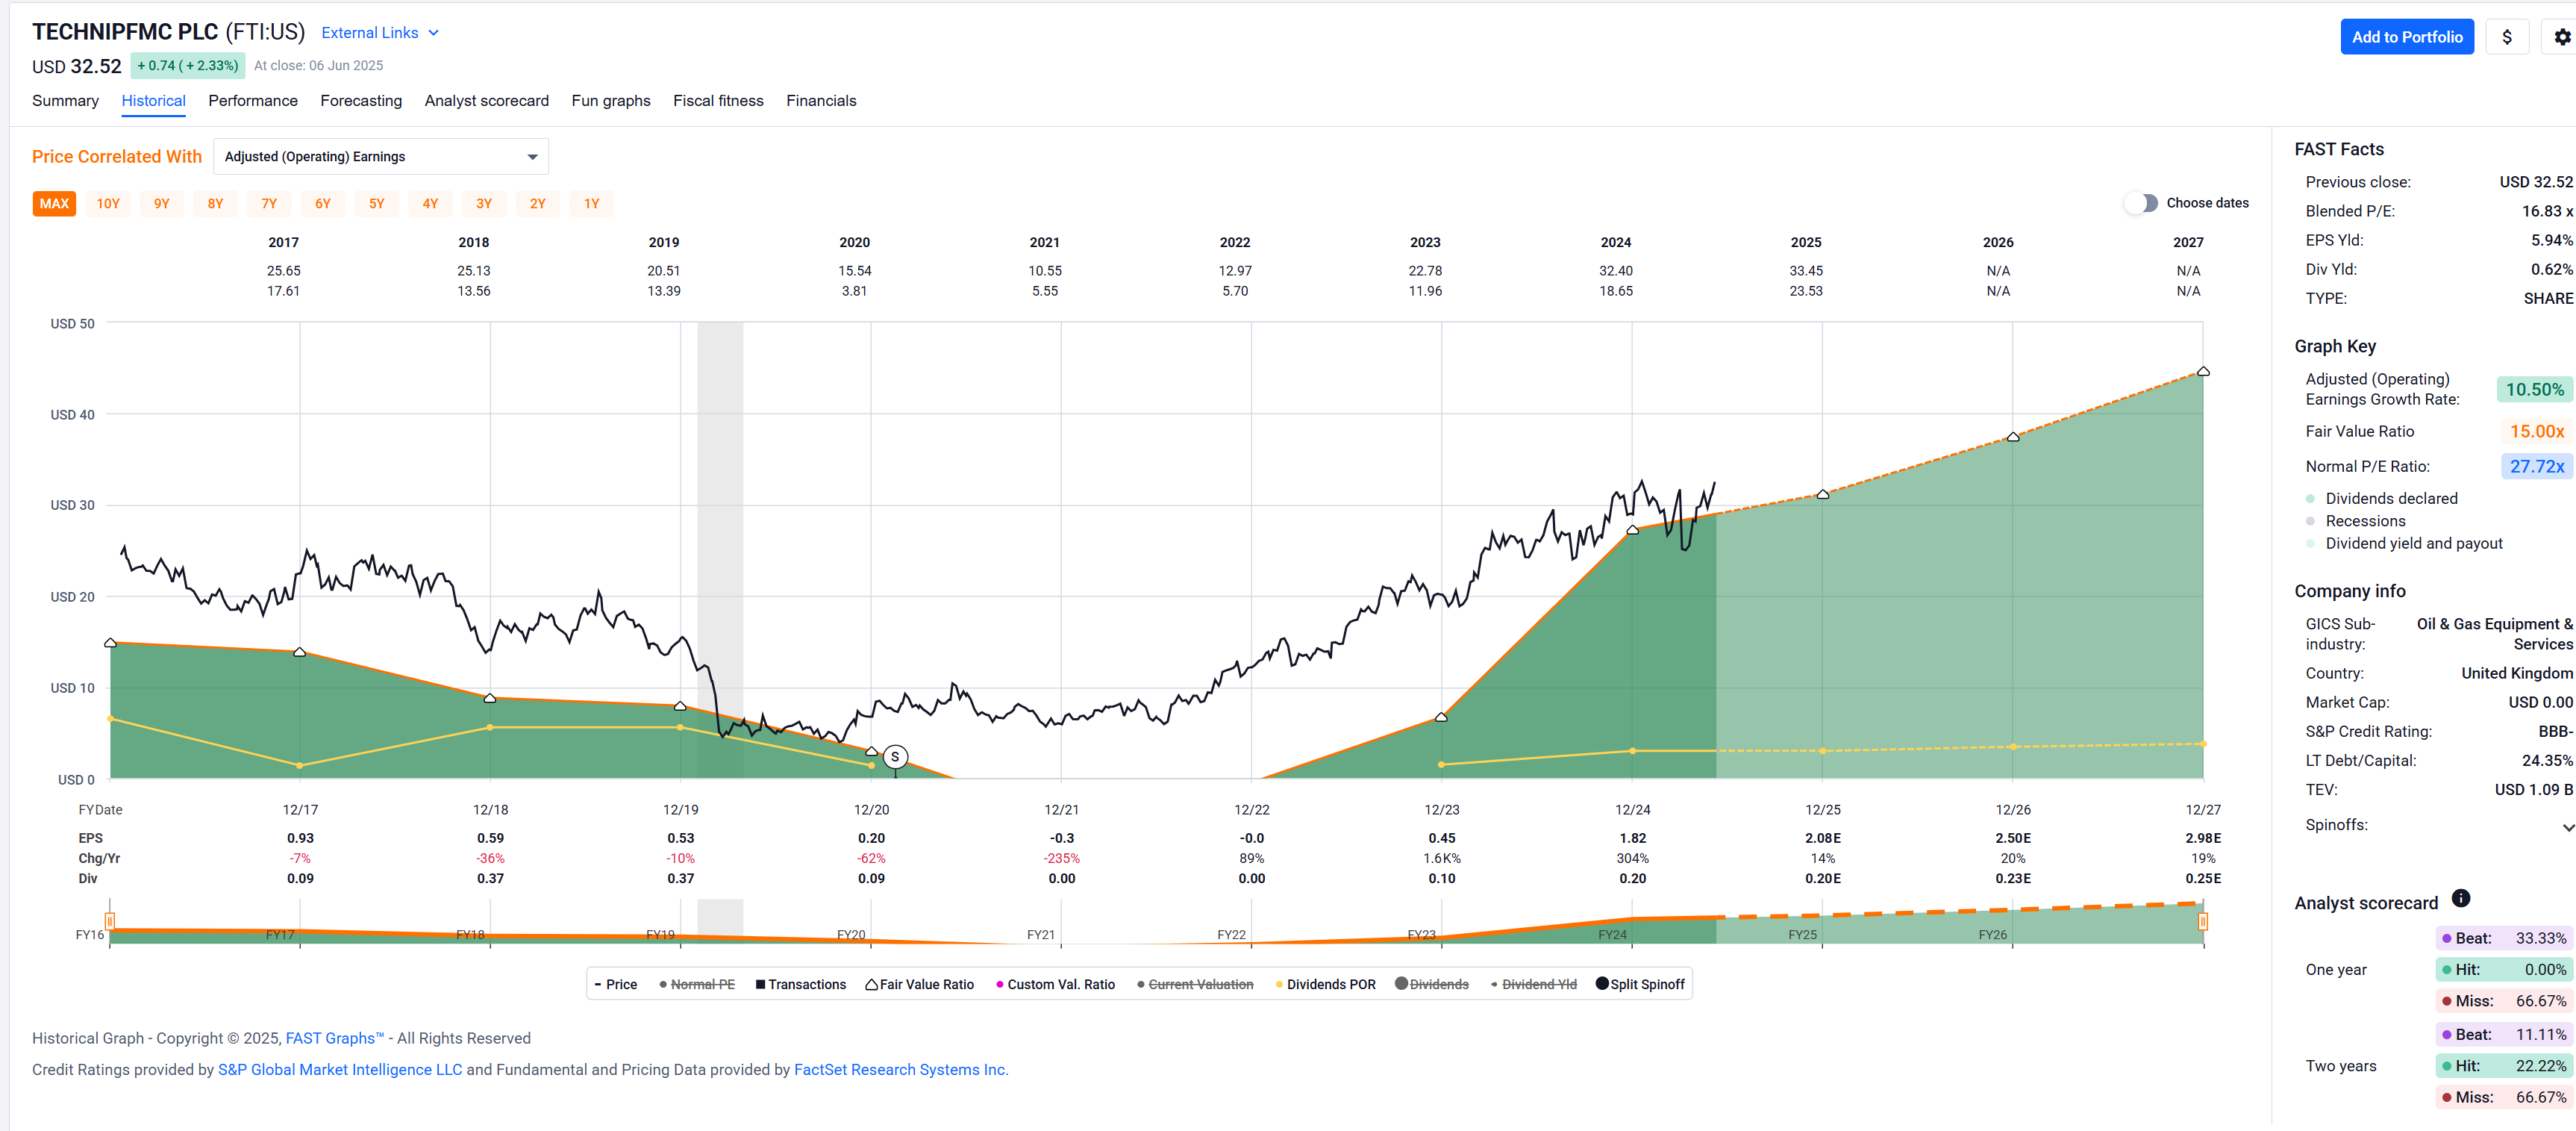
Not a pick but I sold a part of Technip (FTI) today. Enters the fourth year with me now, is a nice cash cow, actually at +375%.
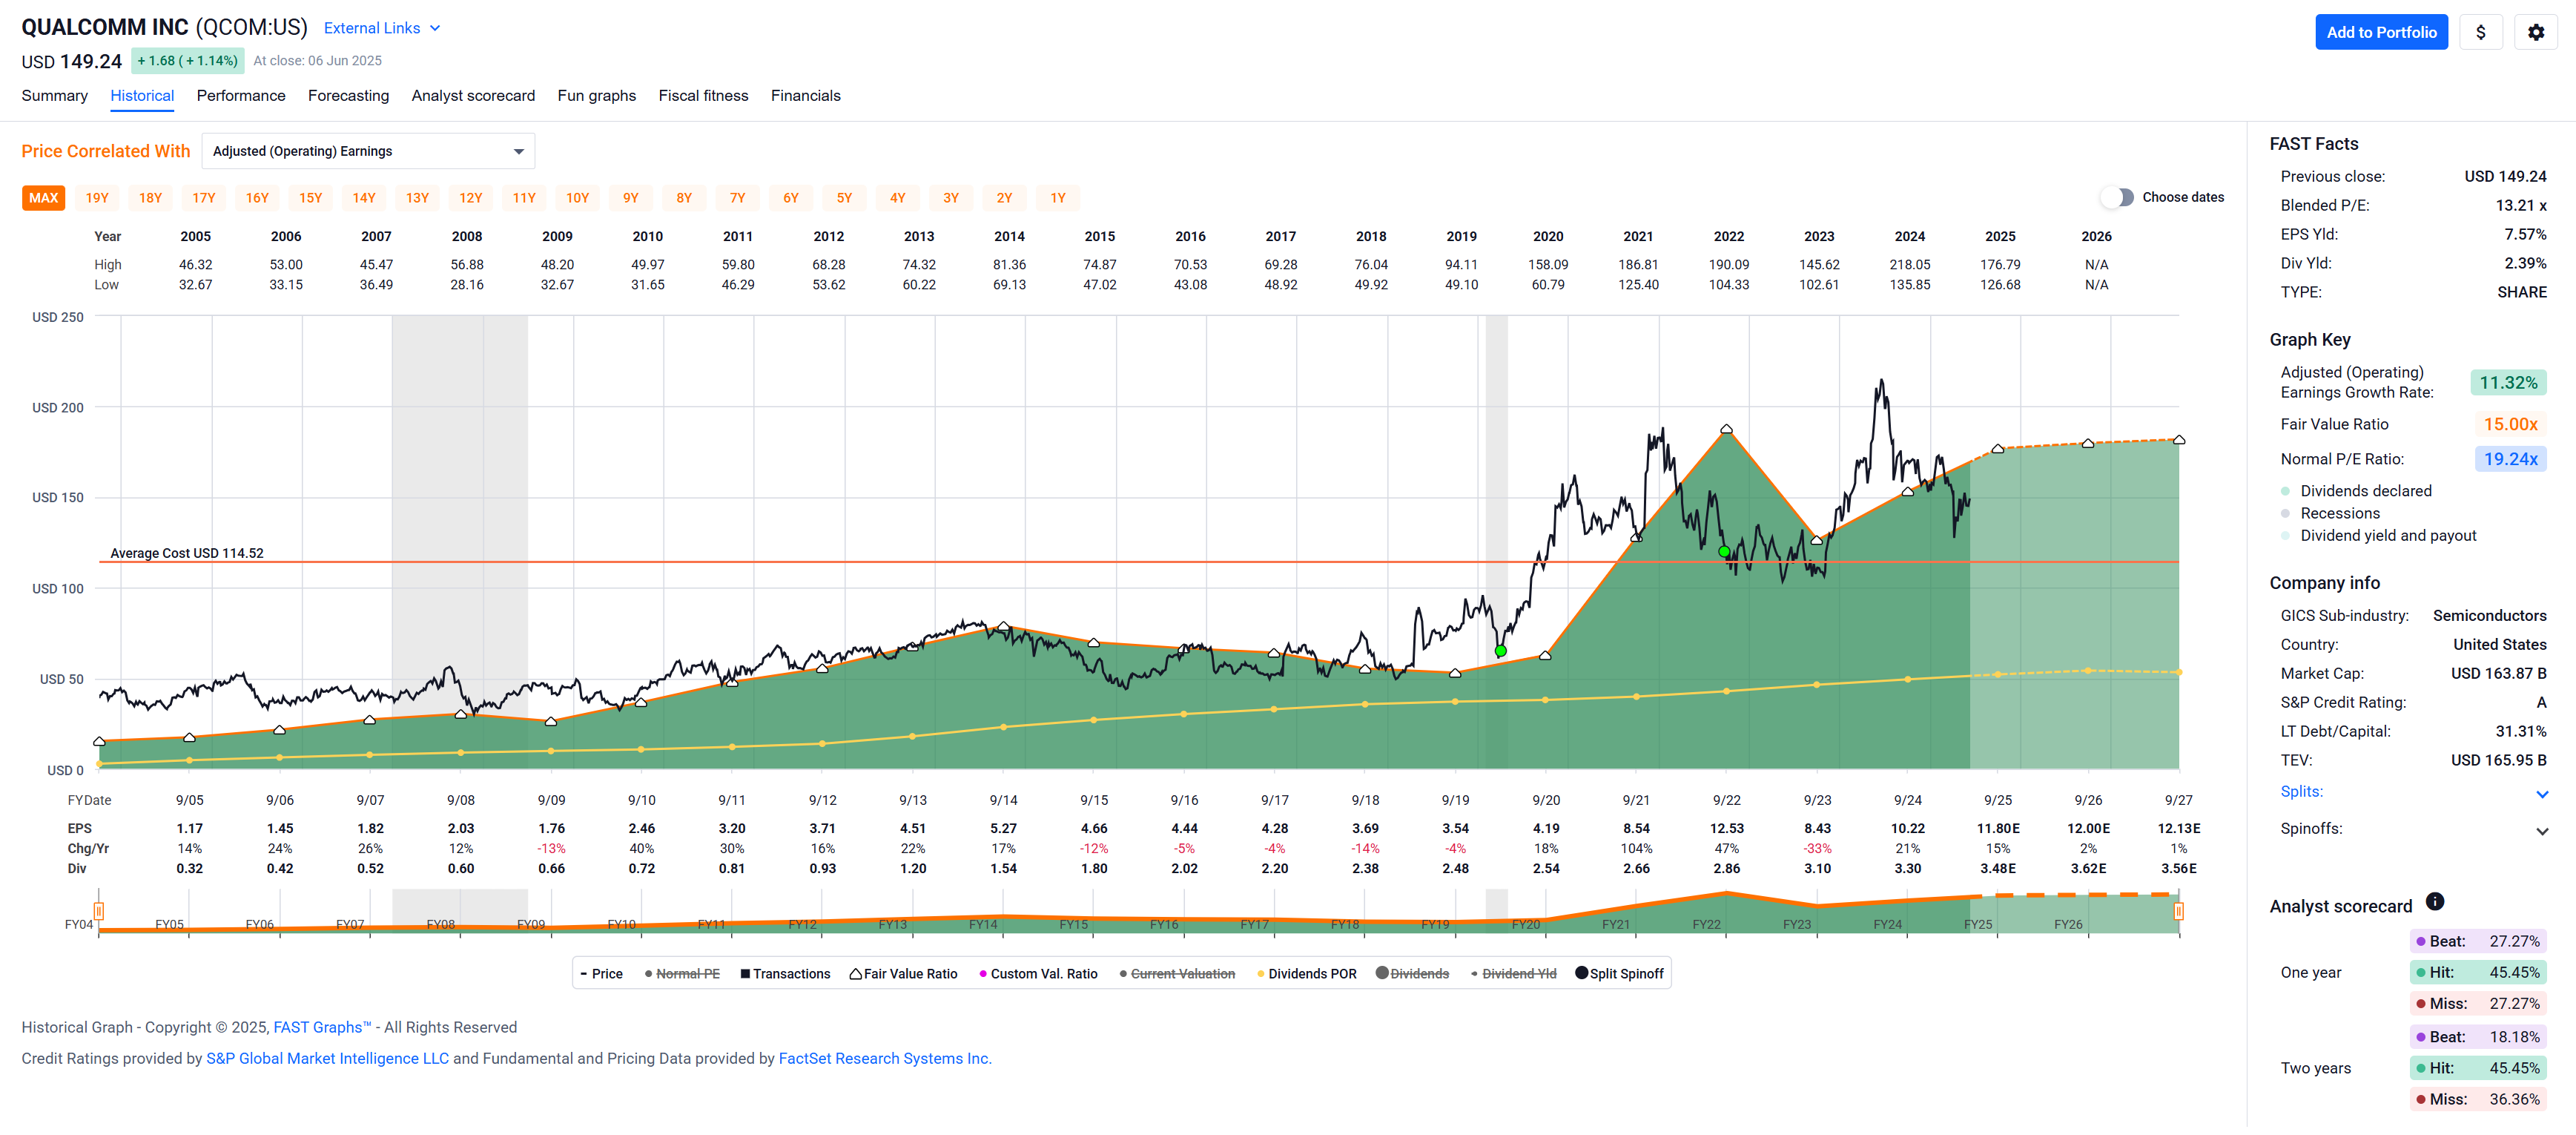
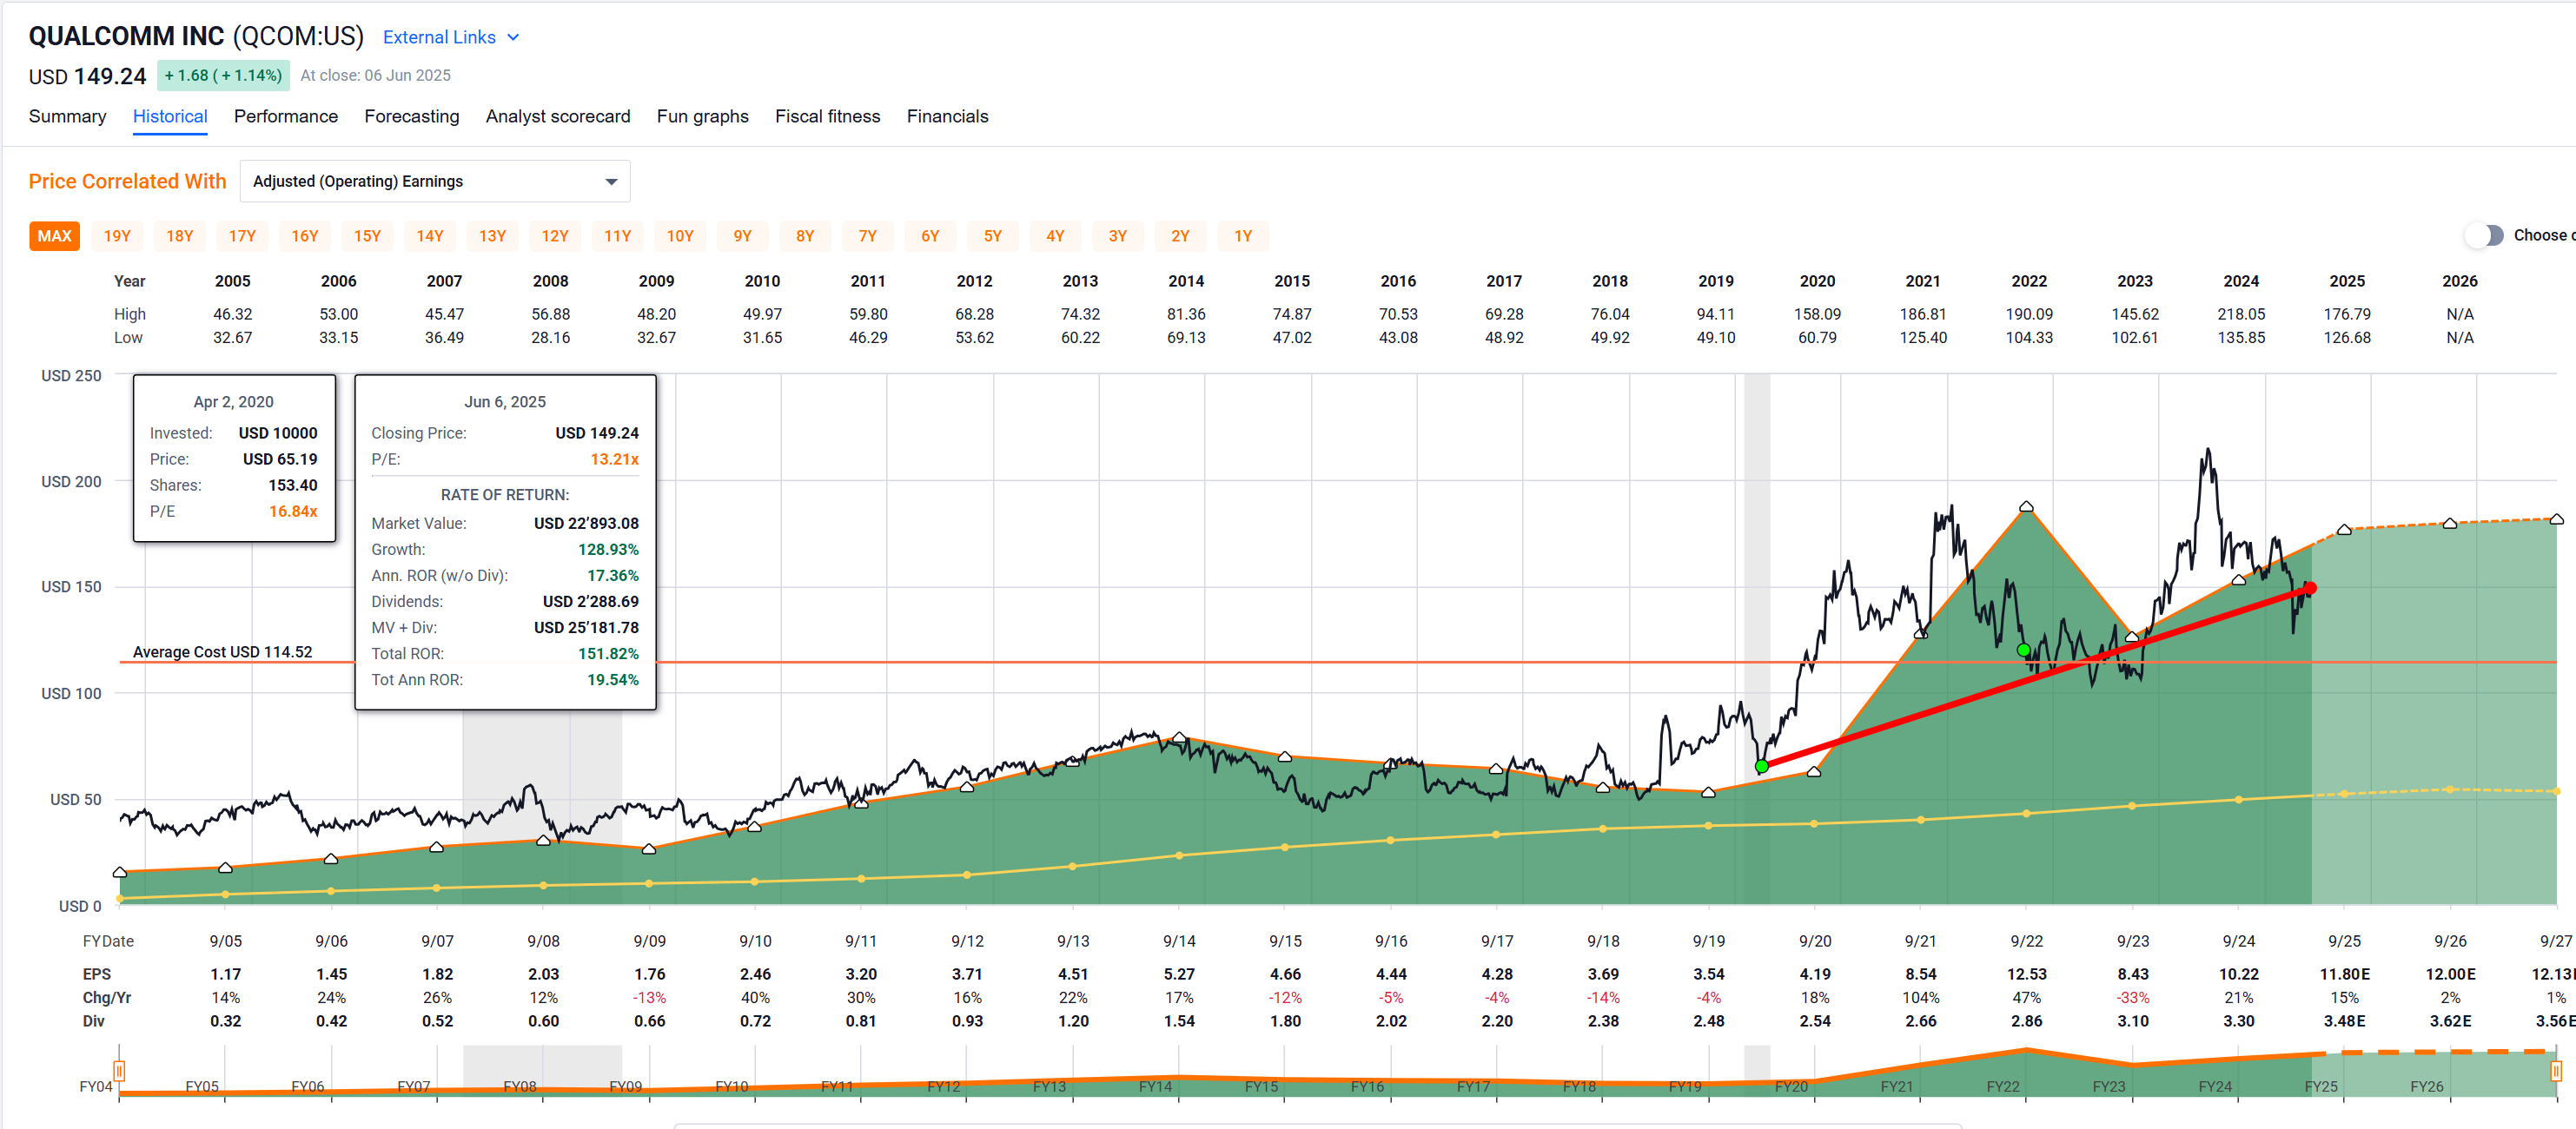
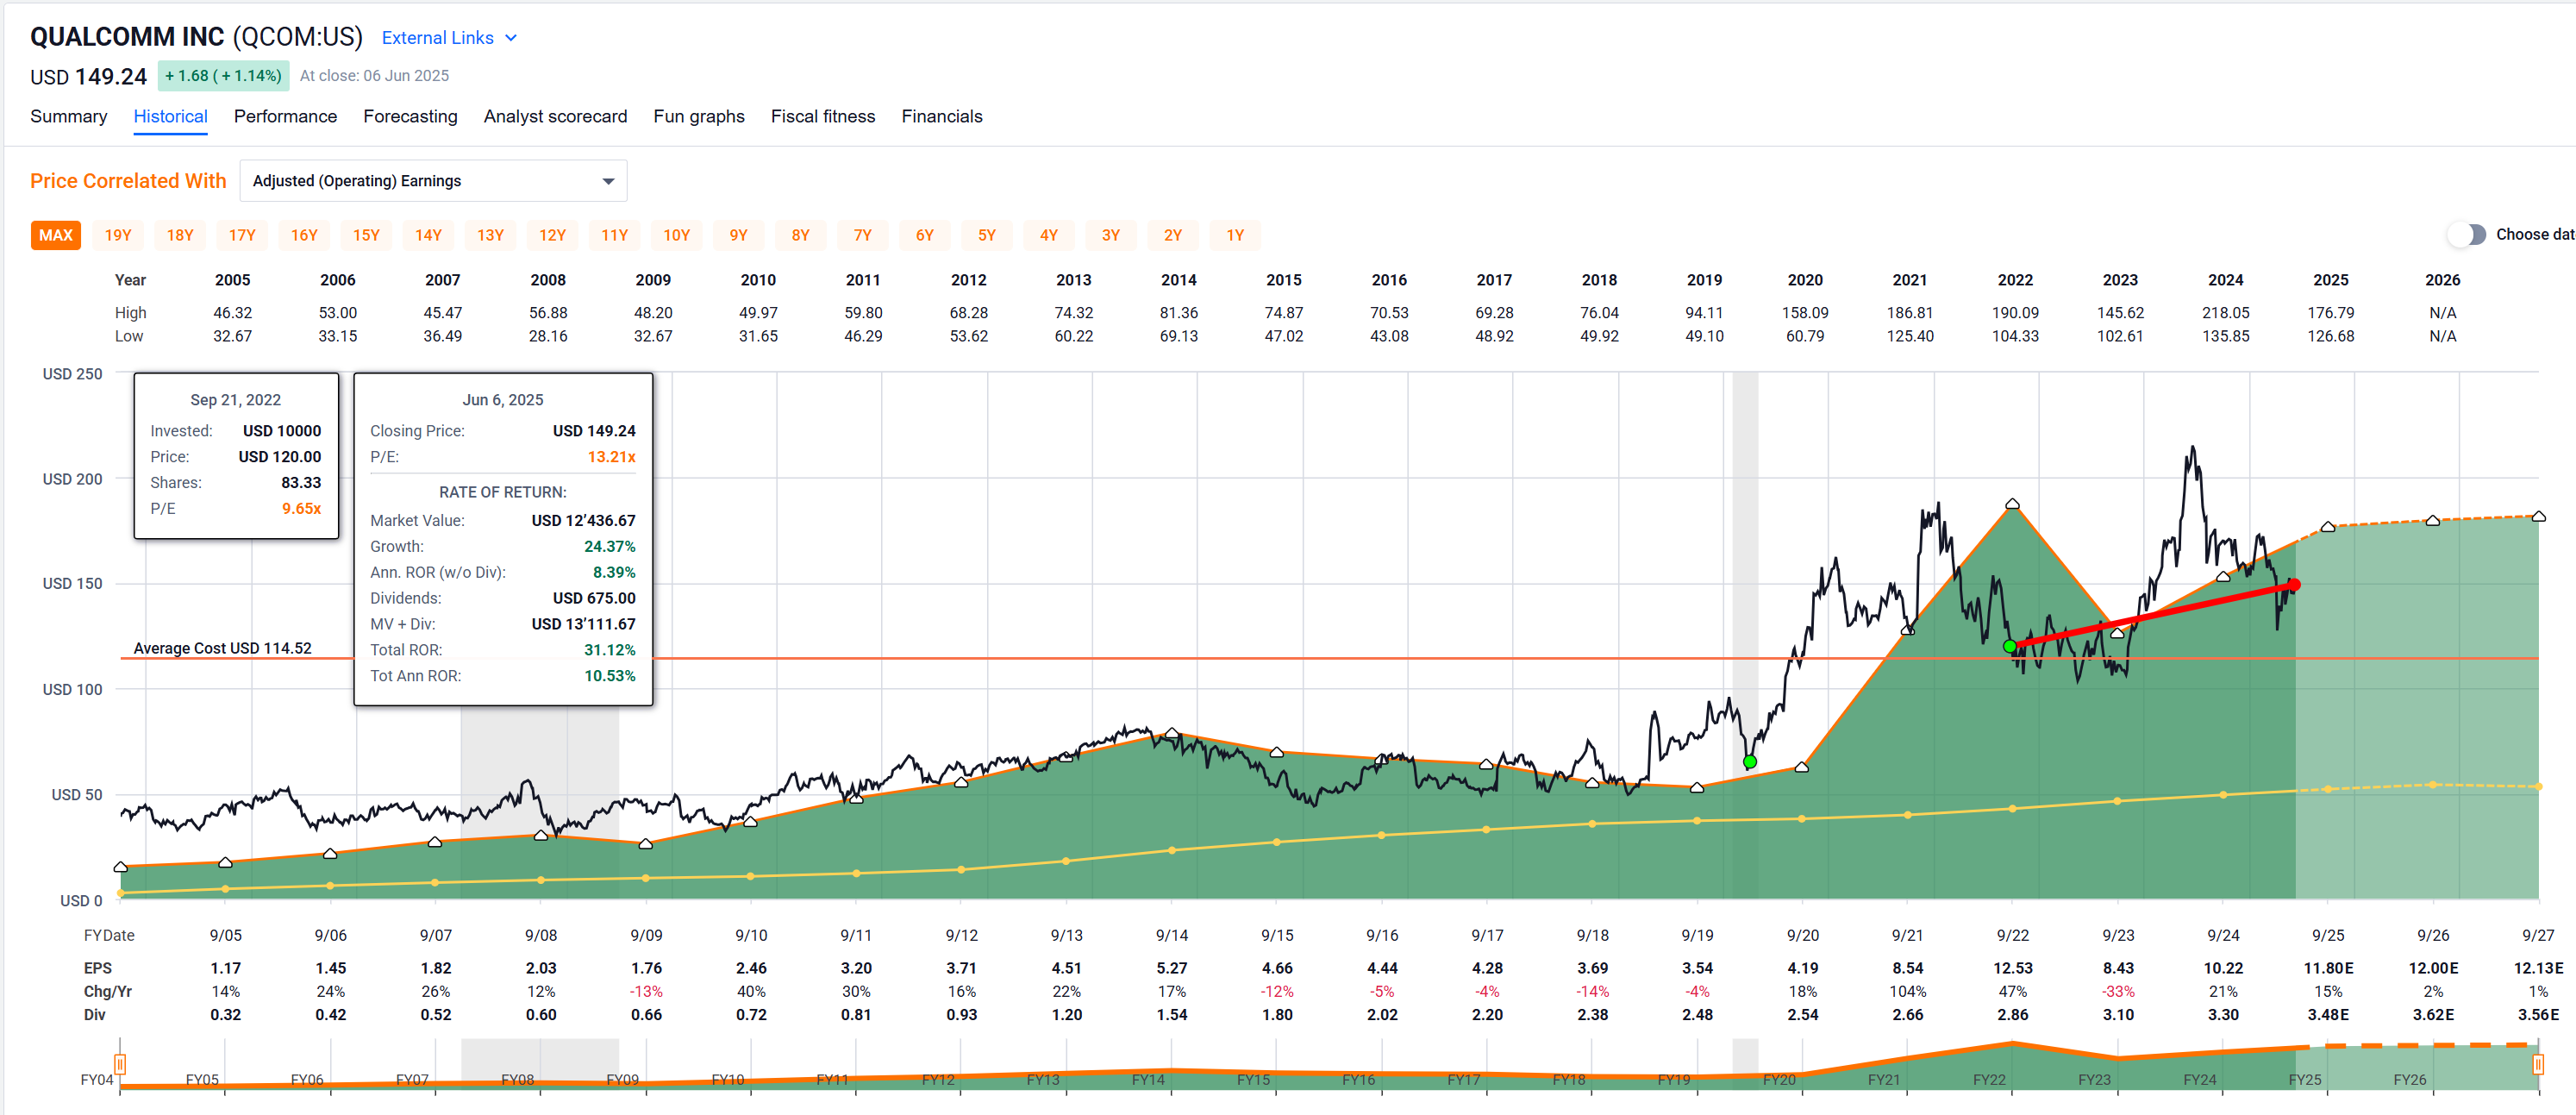
Qualcomm (NASDAQ:QCOM) is acquiring British semiconductor company Alphawave IP (OTCPK:AWEVF) at an implied enterprise value of about $2.4B to boost its AI technology portfolio.
Alphawave shareholders will get 183 pence per share. Shares of Alphawave soared about 23% in London, while Qualcomm’s stock
Not entirely happy about that as I think they sold too cheap considering the potential, but in this current uncertain market, I guess it is OK.
I sold today and my portfolio just squeaked back into the green YTD.
As I read this I wearily opened up my portfolio, expecting my Qualcomm position to have tanked 20% … but they’re actually up, too:
![]()
Due to its cyclicality (and low dividend yield) it’s still on the Most Hated Positions list in my portfolio and I keep wanting to sell it
even if both my purchases have generated nice
or at least acceptable returns
This FTI?
According to FASTgraphs they have some gas left in the tank, but I understand the urge to take some money off the table after quadrupling your investment.
Yep, that’s the one. No, no urge to sell, as almost always I hated what I had to do due to my mechanical system. I need cash flow therefor I sell parts at gains of 500%, 1000% and so on and parts after every 12 months. FTI is with me the 4th year now, so I partially sold 3 times already. It still did not reach 500% gain…
The actual leftover position is still worth more than double what I paid for it with cash in my pocket of already $5.55 per share. That is my negative entry price after those transactions. Hope I can keep it forever but will not hesitate to sell when my mechanical system tells me to.
QCOM has been one of the few stocks that passes one of my screeners, but I haven’t bought it as I just don’t trust the stock.
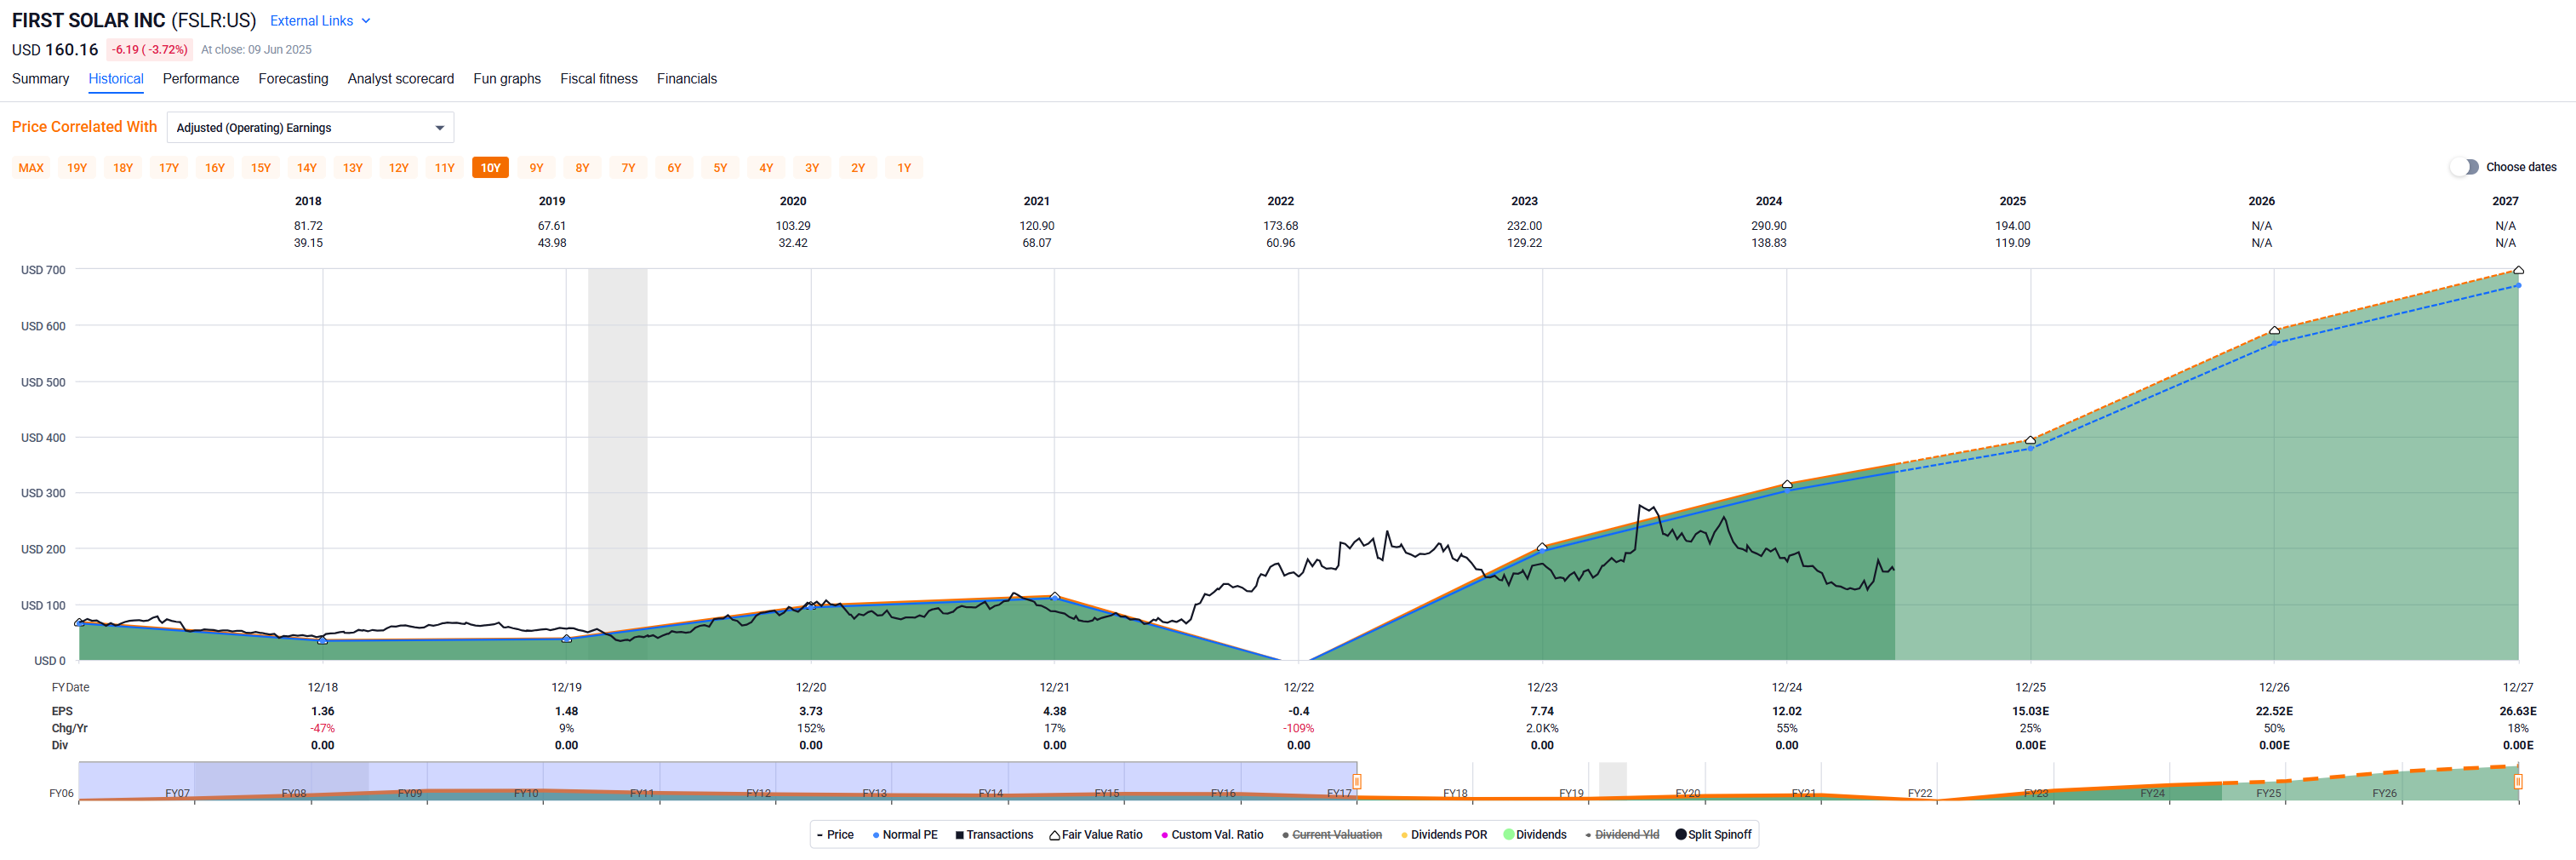
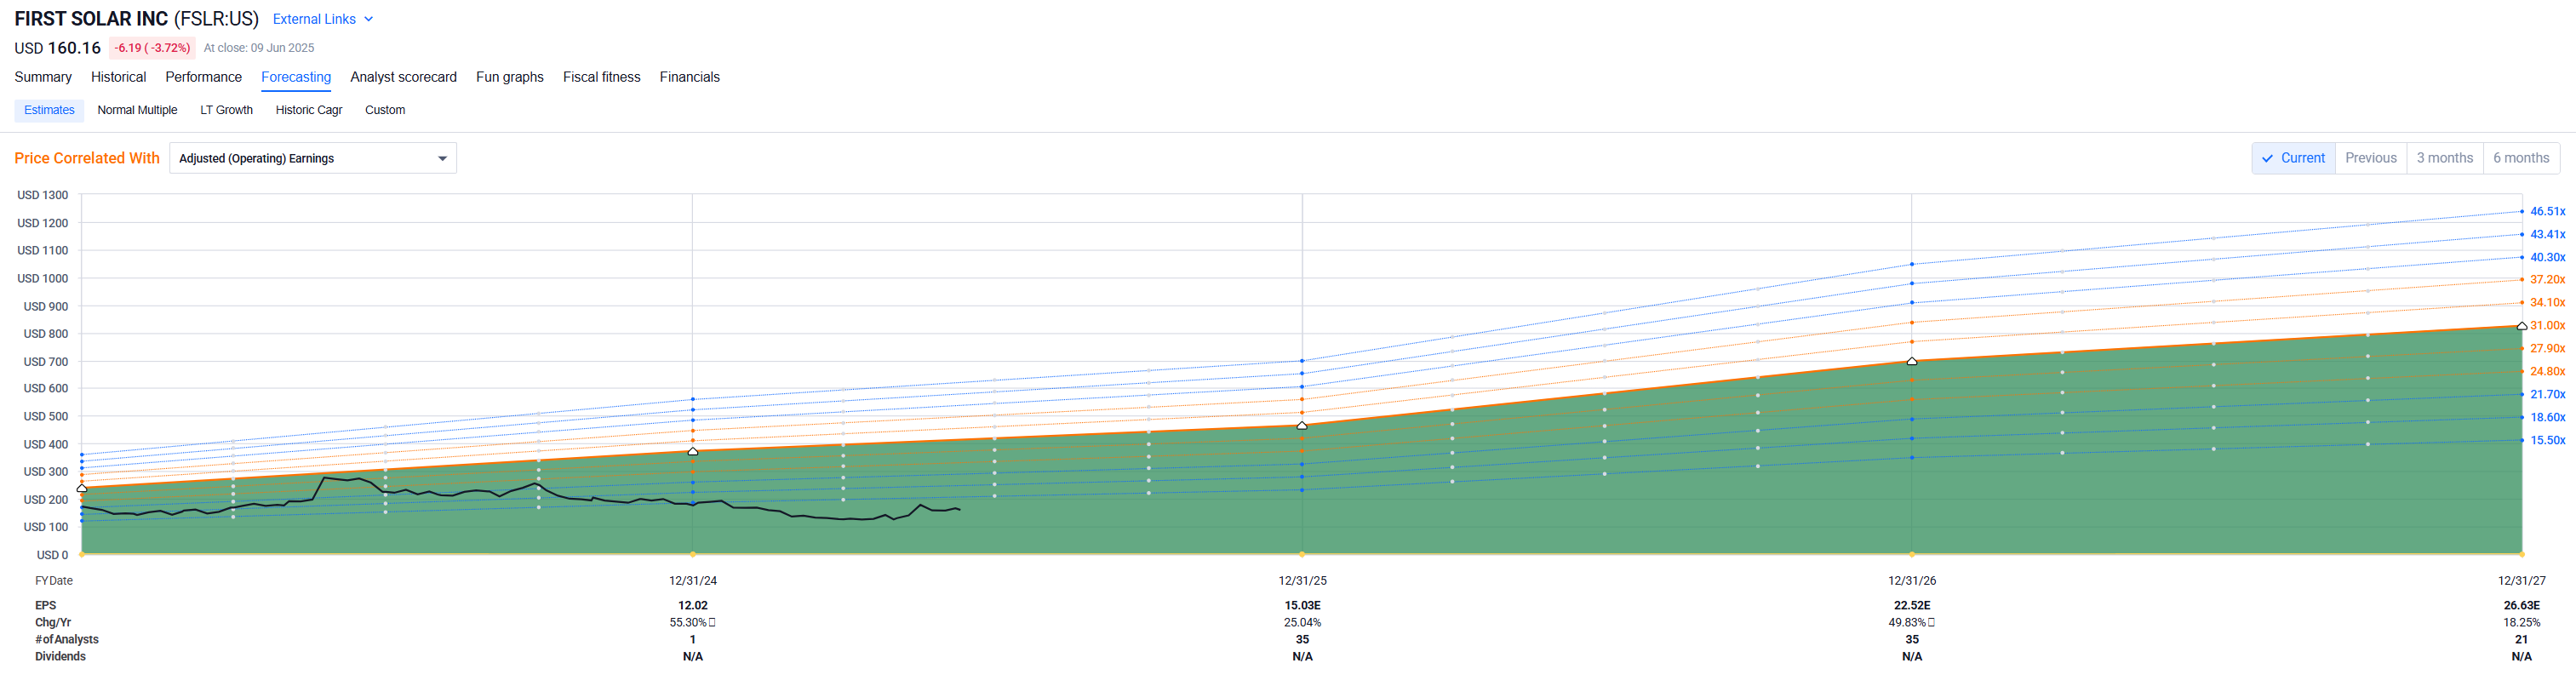
thinking about stepping into First Solar for the post-trump era, solely for growth - what does the community think about this company?
Fastgraphs suggests a fair value of 350, SimplyWallSt DCF says 250, IBKR Analyst target sits at 200 bucks. IT might still go lower, which would be great to expand the position…
![]()
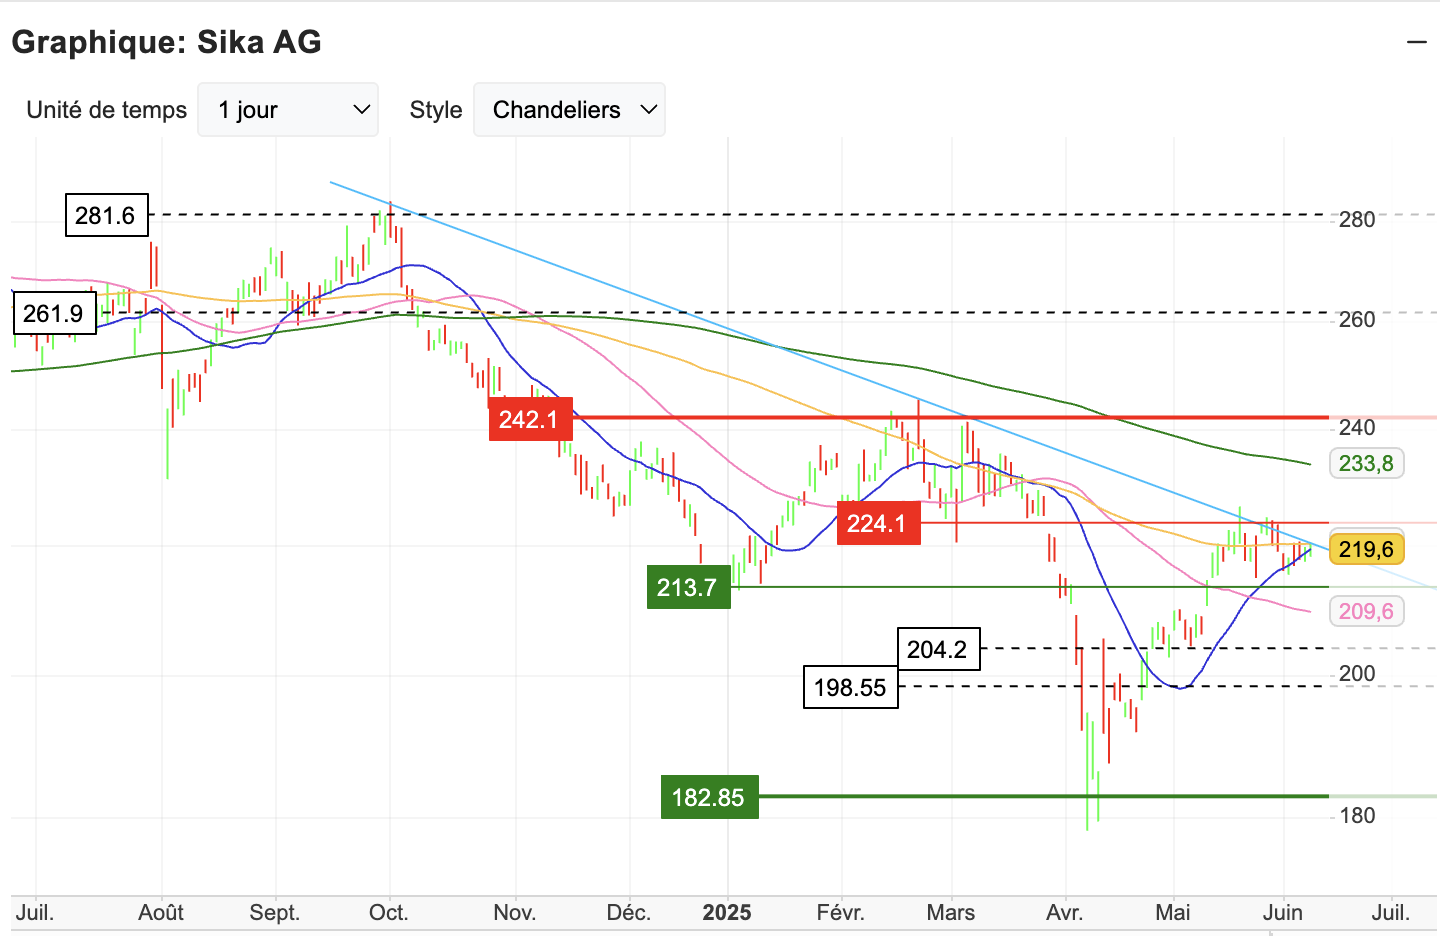
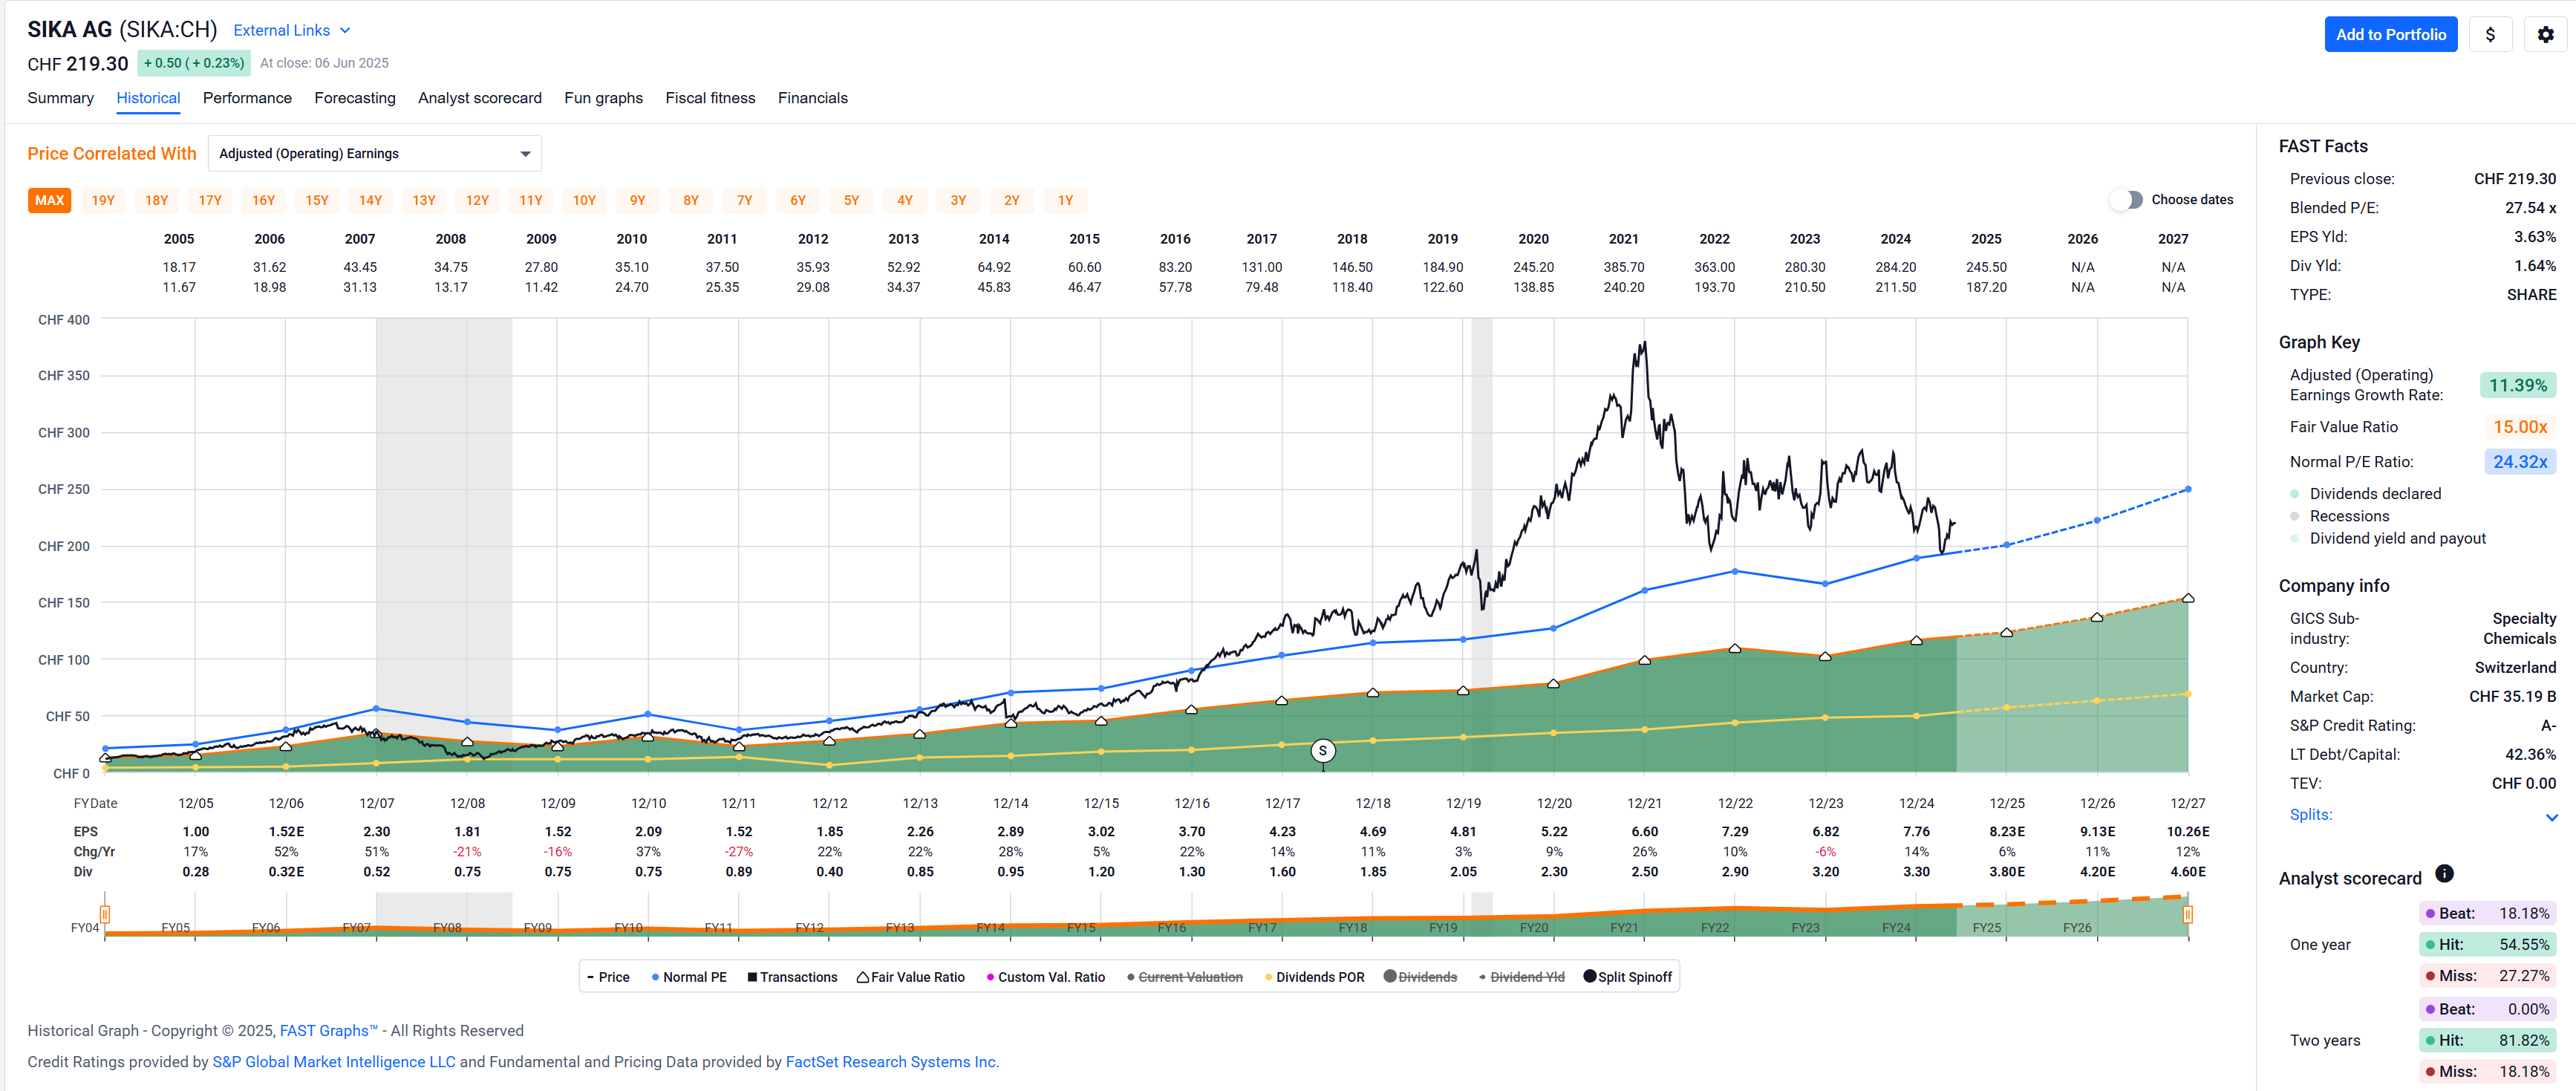
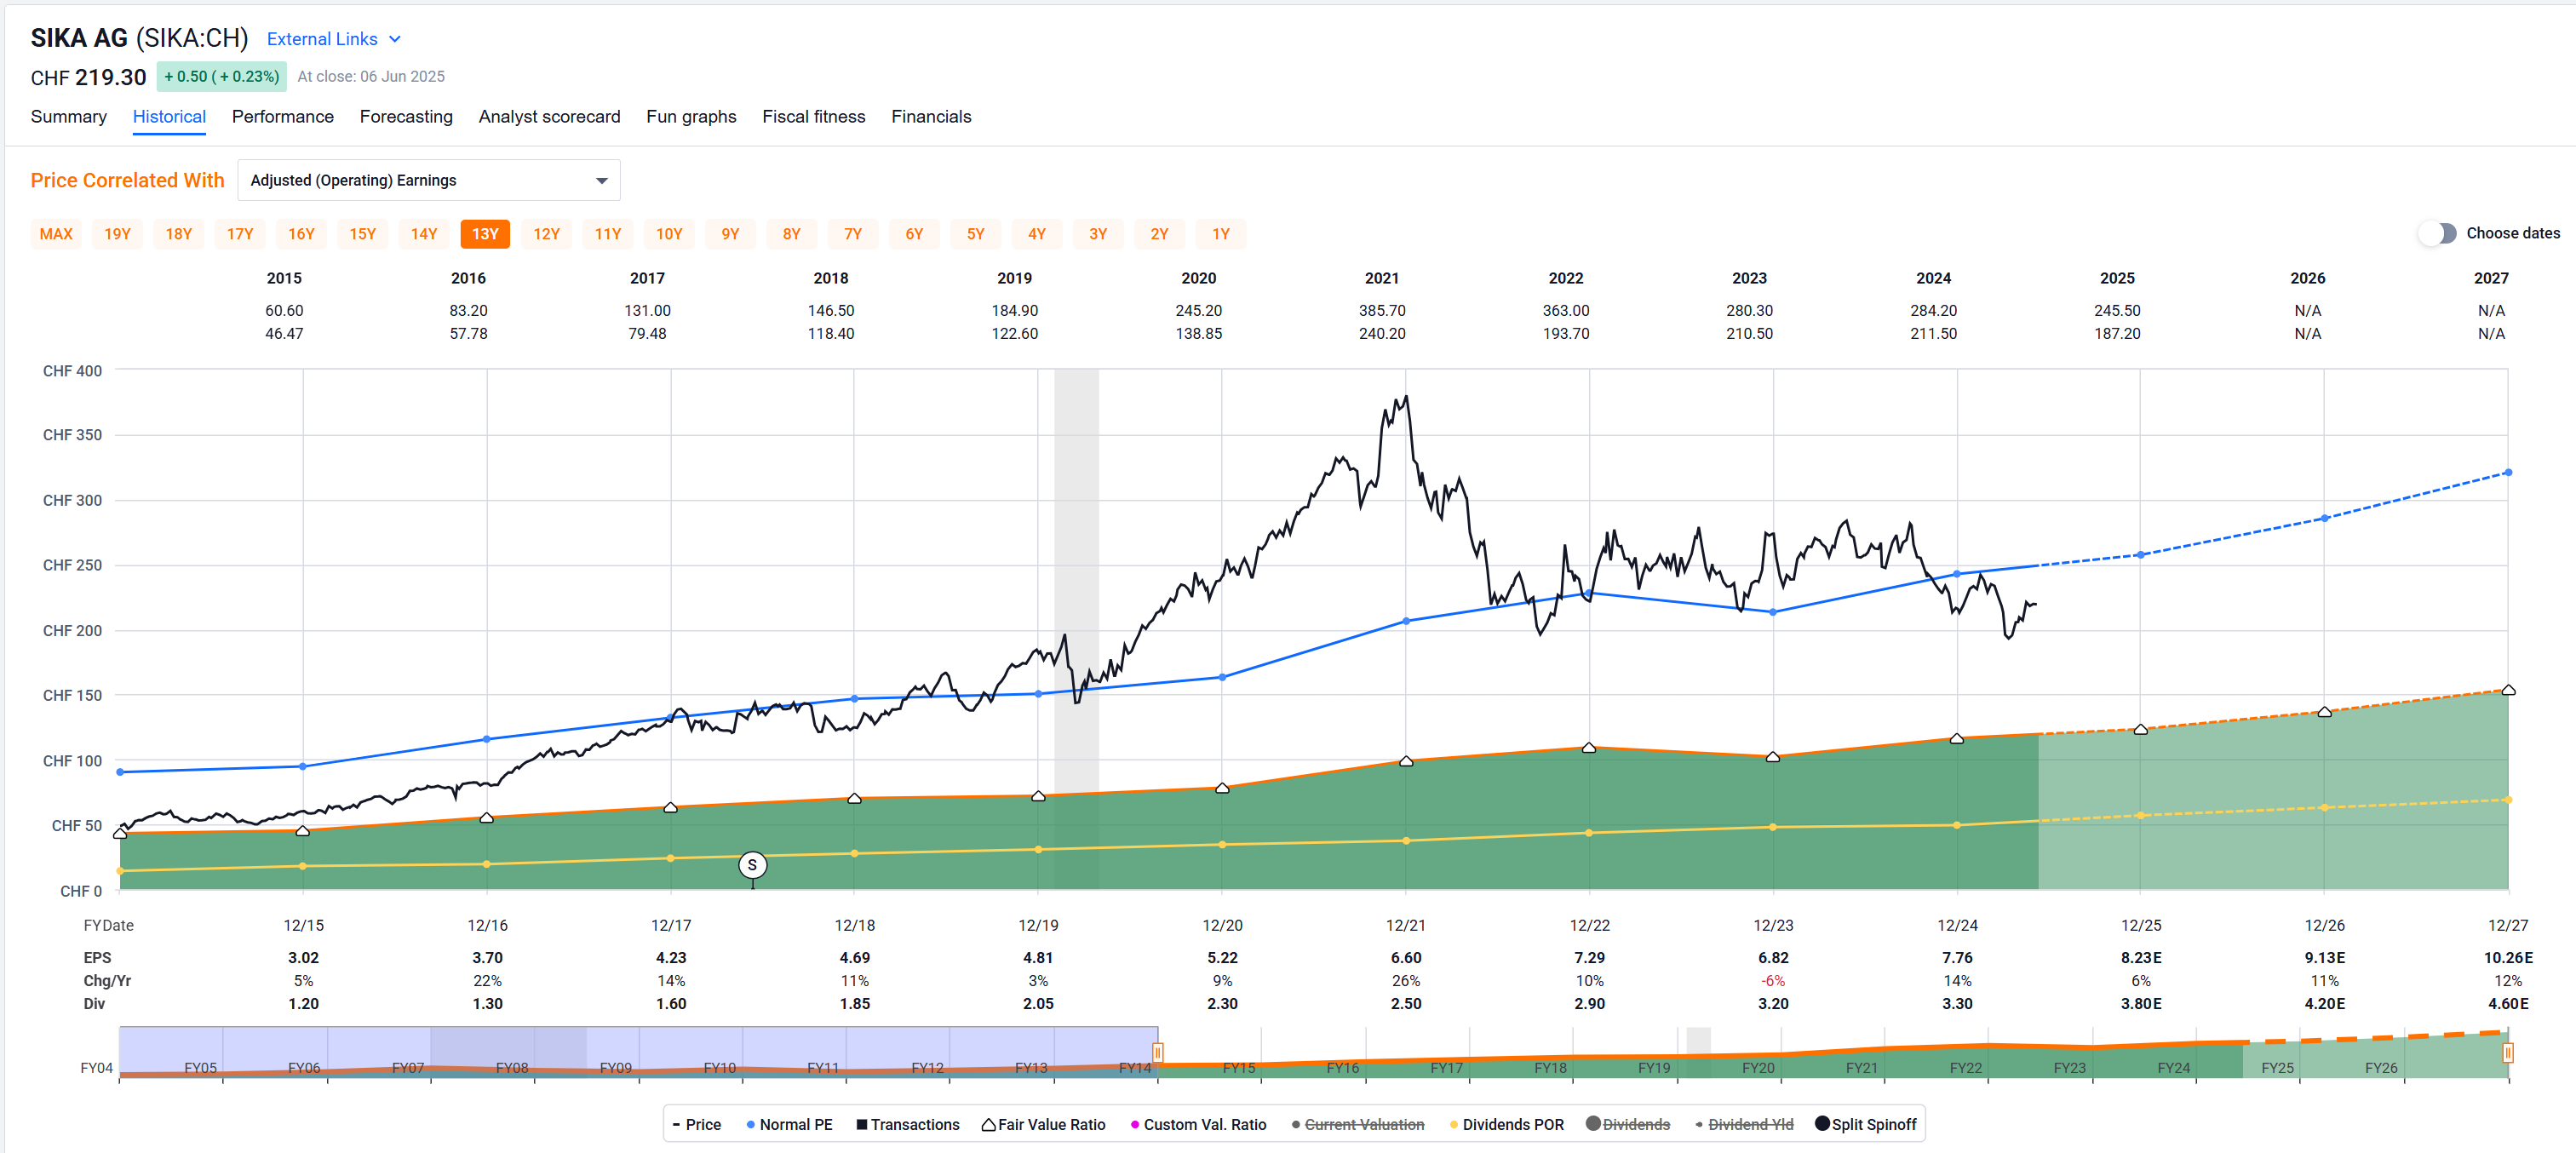
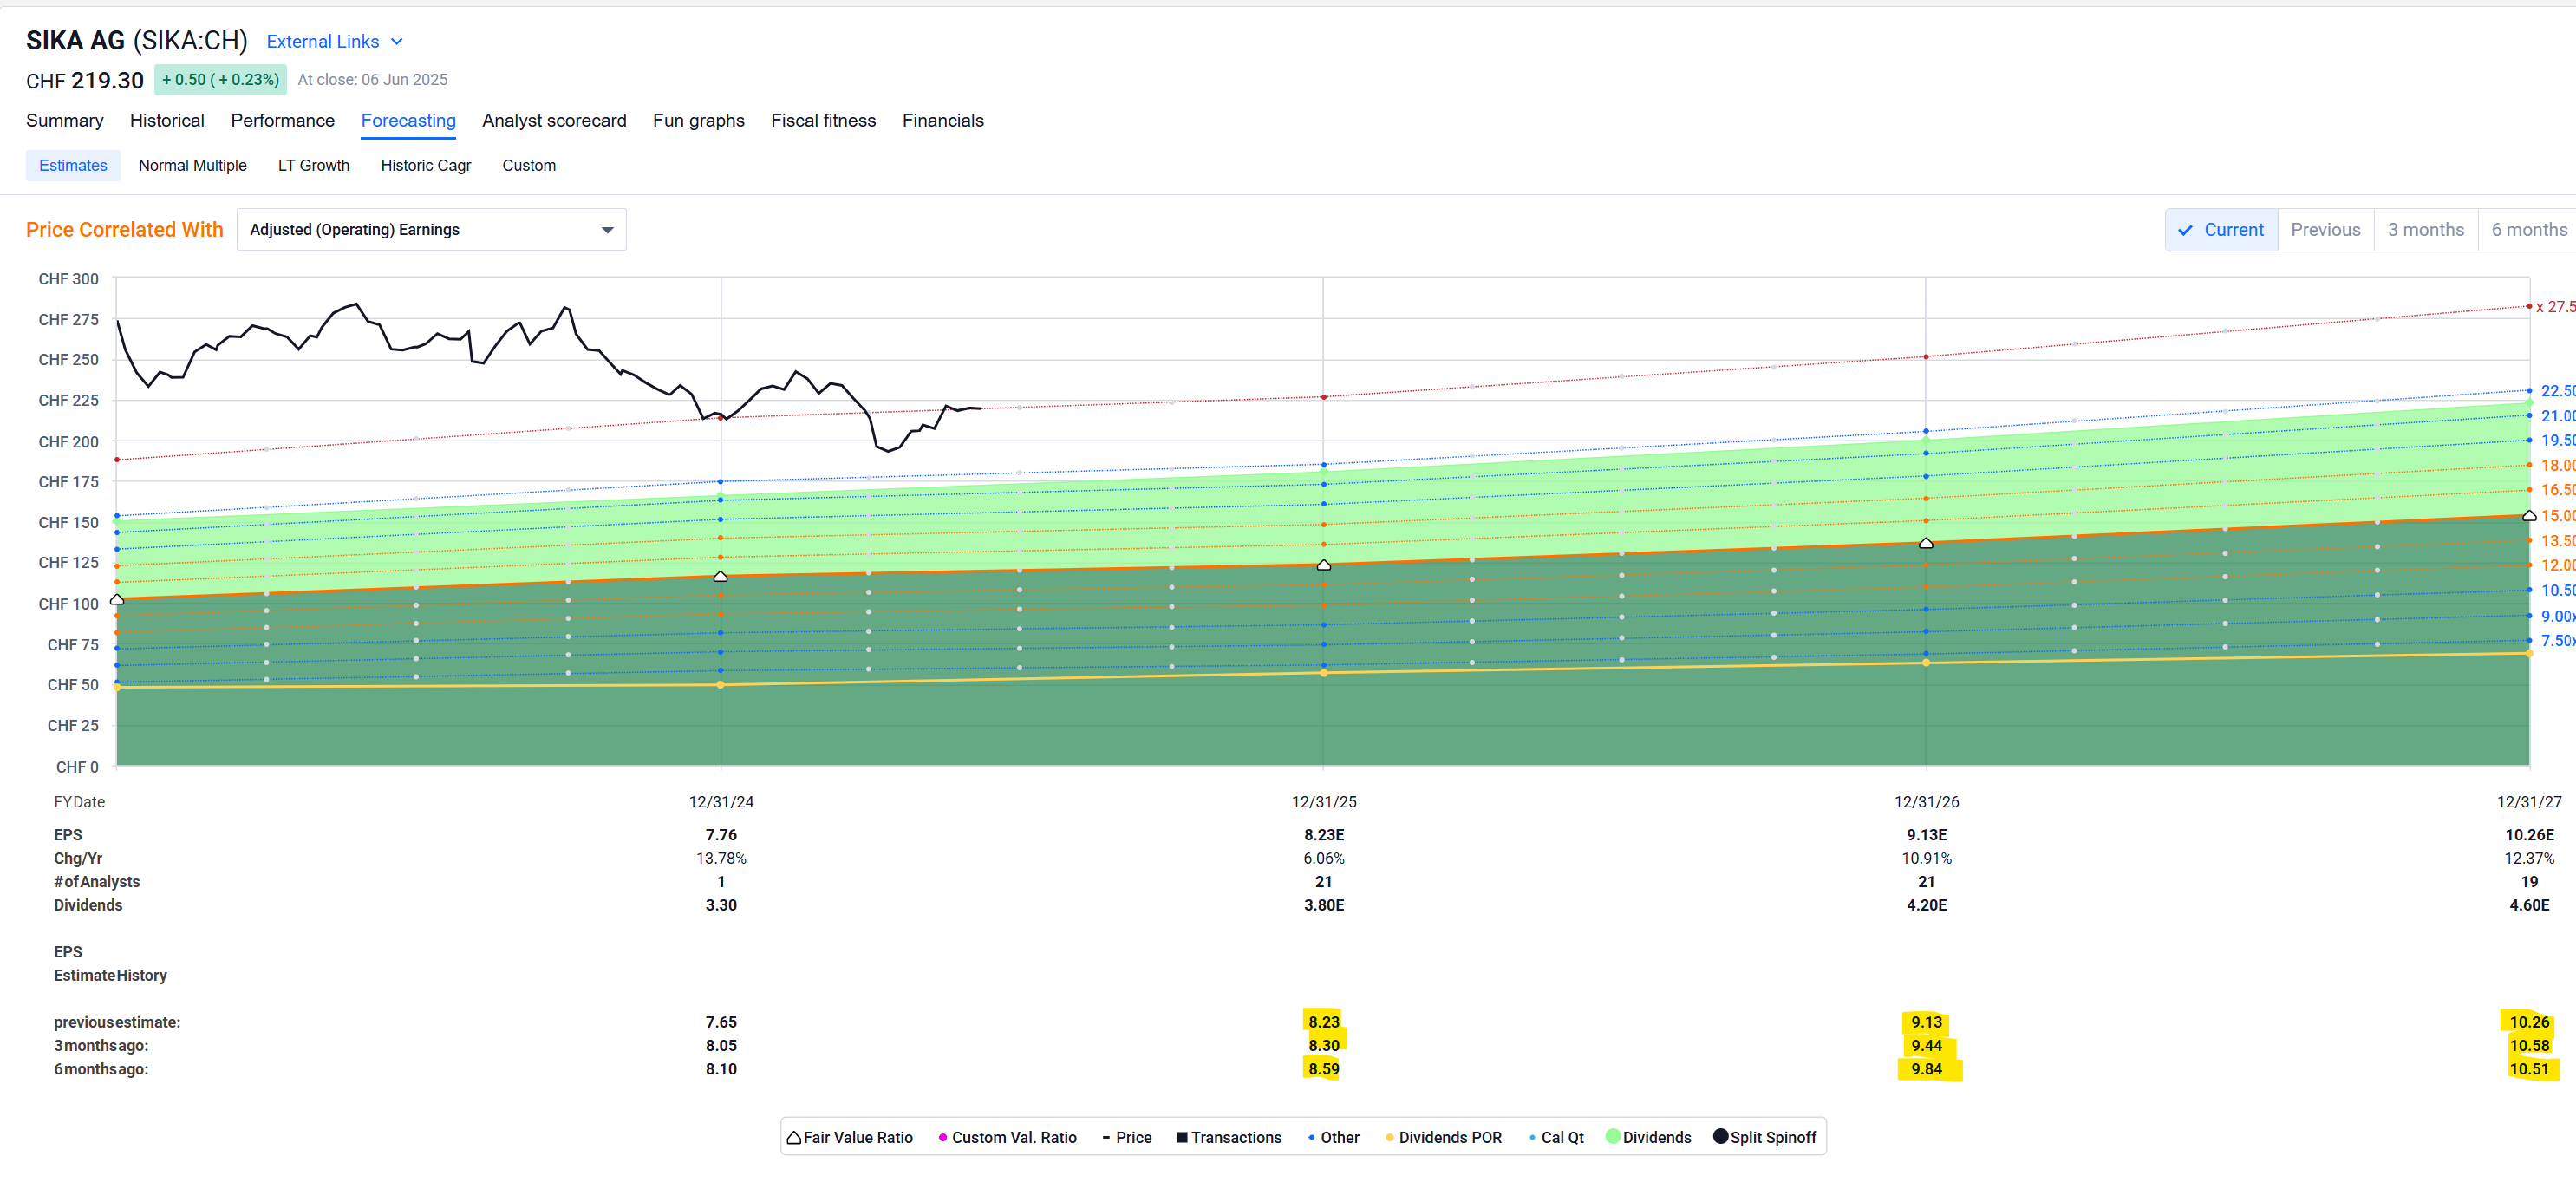
I remember looking a while back at Sika but the valuation was far more than I was willing to pay. Maybe it will touch the orange line soon.,..
They’re growing earnings fairly nicely, and they hike their dividend at the same nice clip.
But (still) too overvalued for me, too.
They’re even trading above their historic “normal” multiple (i.e. what the market is attributing it as a valuation over the selected time period).
Picture looks a bit better if I shorten the timeframe, but not enough of a margin of safety (for me). And anyway, the dividend yield is anemic even though they pay out close to half their earnings as dividend.
Also, analyst estimates for their earnings have been going down over the last half year, denting a little bit the picture of nice earnings growth.
Lastly, why haven’t they renamed their comany to Sik.AI yet? ![]()
I was planning on looking at some energy stocks today, but the Iran thing threw an extra bit of volatility in there. Looking at:
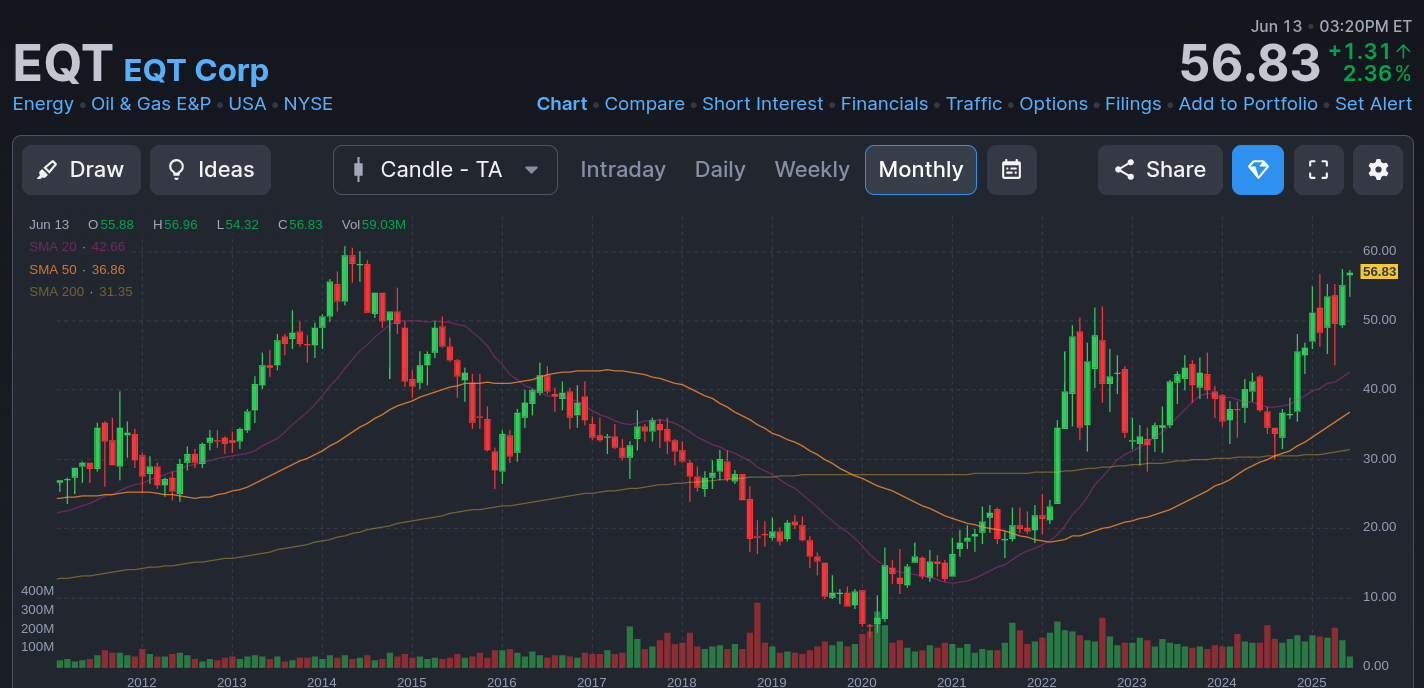
I looked at EQT too. What happened here?! This was a $3 stock during covid and now it is 20x that!
Antero Resources was my first big multi-bagger in my momentum portfolio, 2’000% if I remember properly, got lucky in 2020, got in way too early as always but it was a diamond. At the moment I only hold Vista Energy (+1038%), Gulfport (+83.1%), Technip (+310.95%), and the recently purchased CVR Energy (+17.22%).
Wars usually kick off a broad rally, starting with energy stocks. But I prefer to get in too early. The price for those multi-multi baggers is that you have to sell a lot with a loss. You have to pick up a lot of stones to find a diamond, but there are diamonds.
I hadn’t noticed how cheap APA had become too.
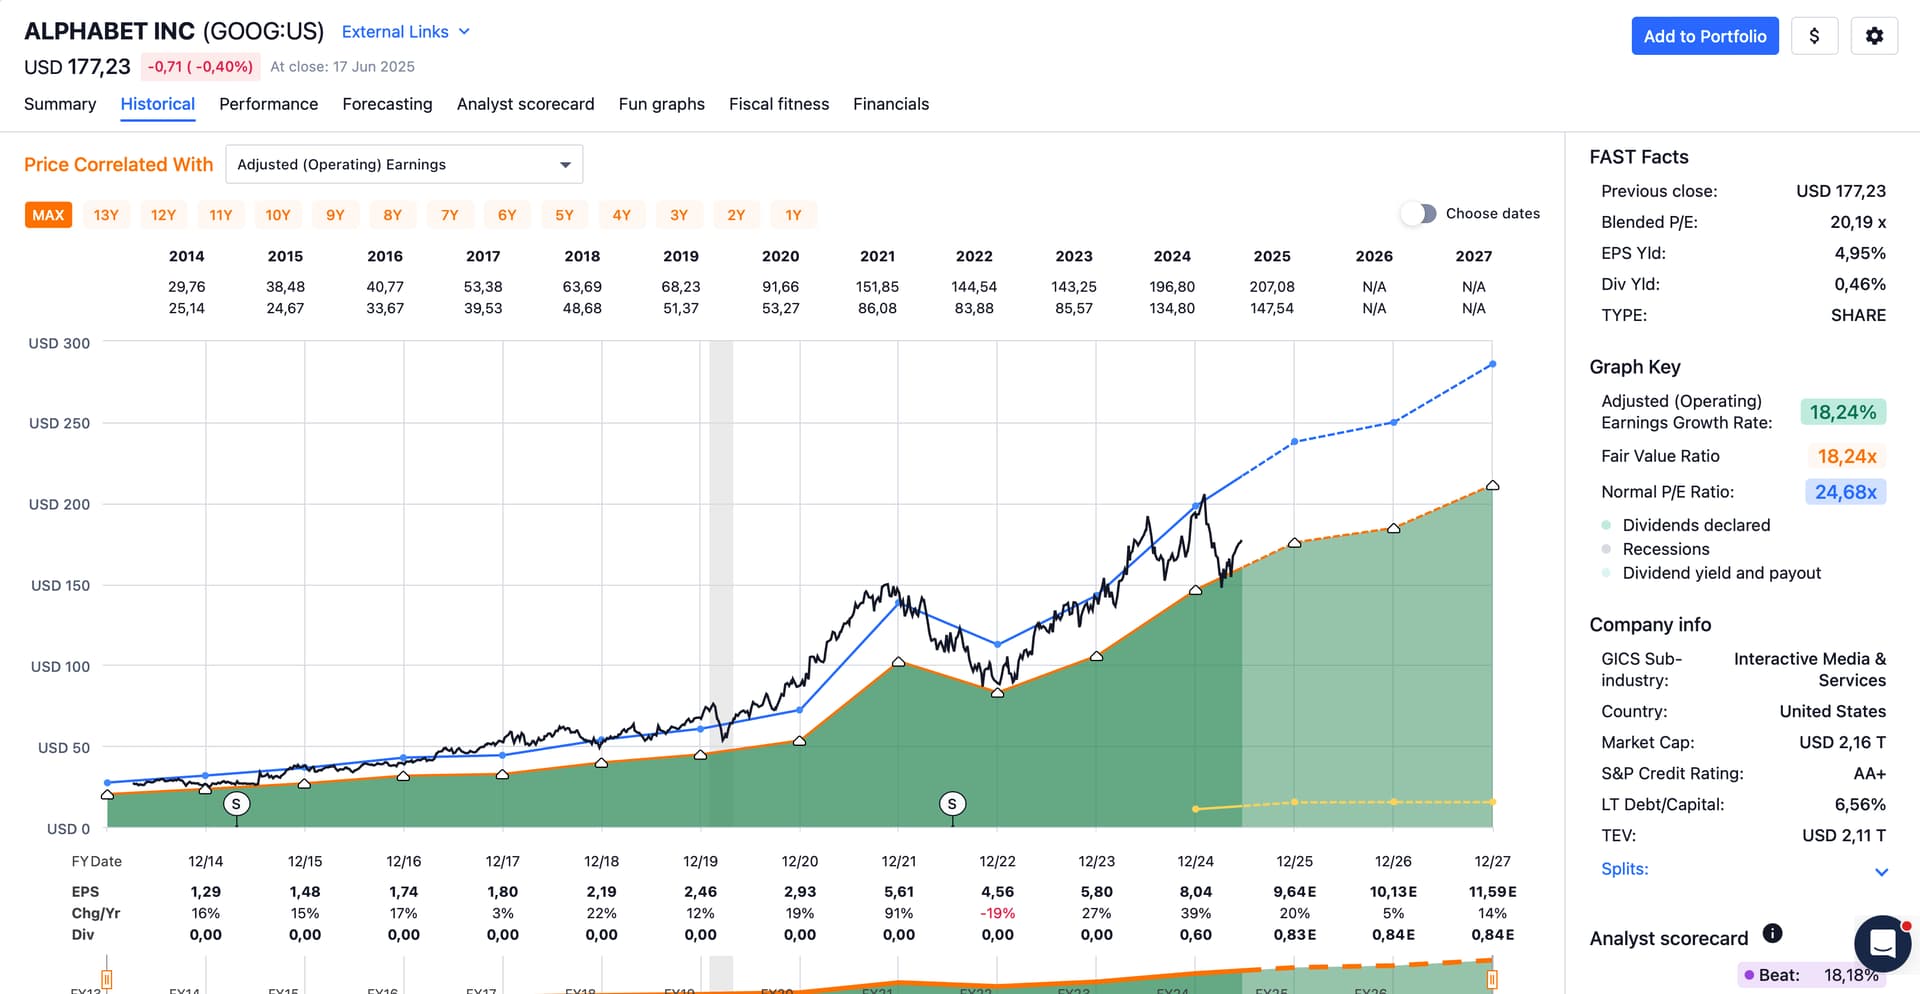
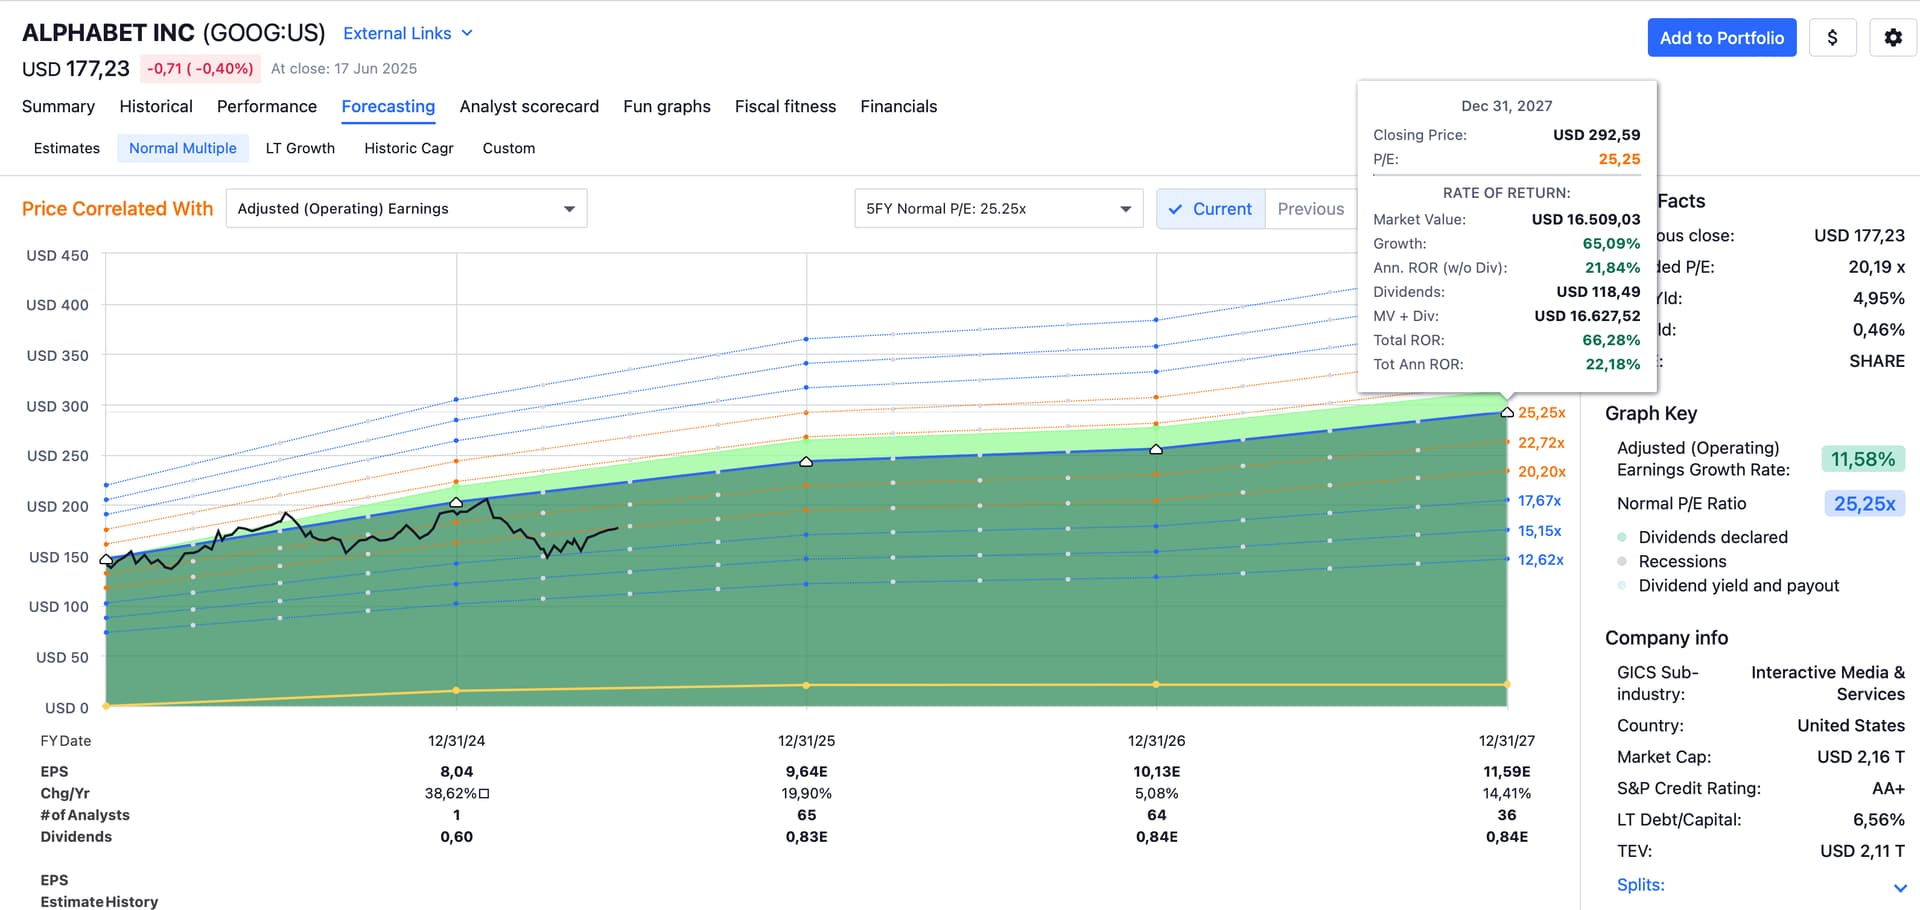
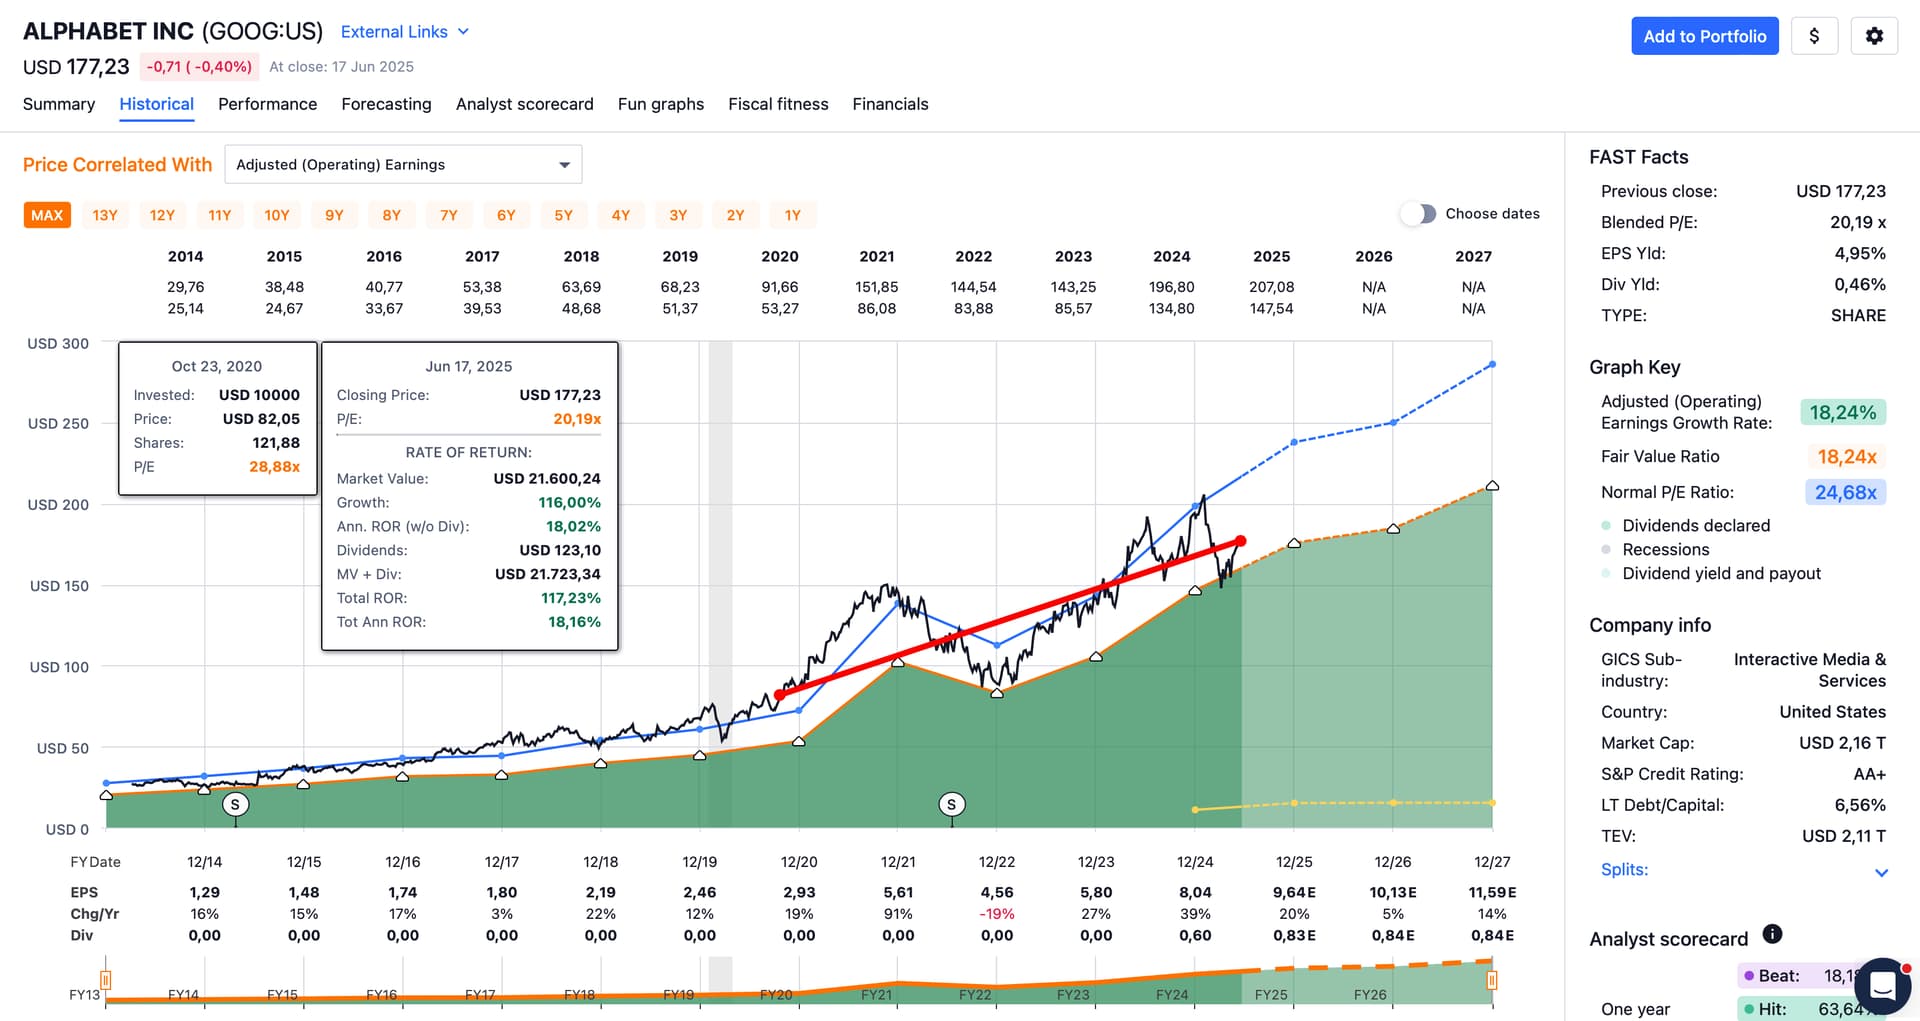
Hi @Your_Full_Name. Would it possible to post the Fast Graph for GOOG / GOOGL ? I think Gemini has improved a lot and can see them getting decent positioning in the AI space even if they are losing on other business segments. Thank you very much !!
I don’t think that will show up in any charts other than as massive capex buildout and losses.
Sure thing!
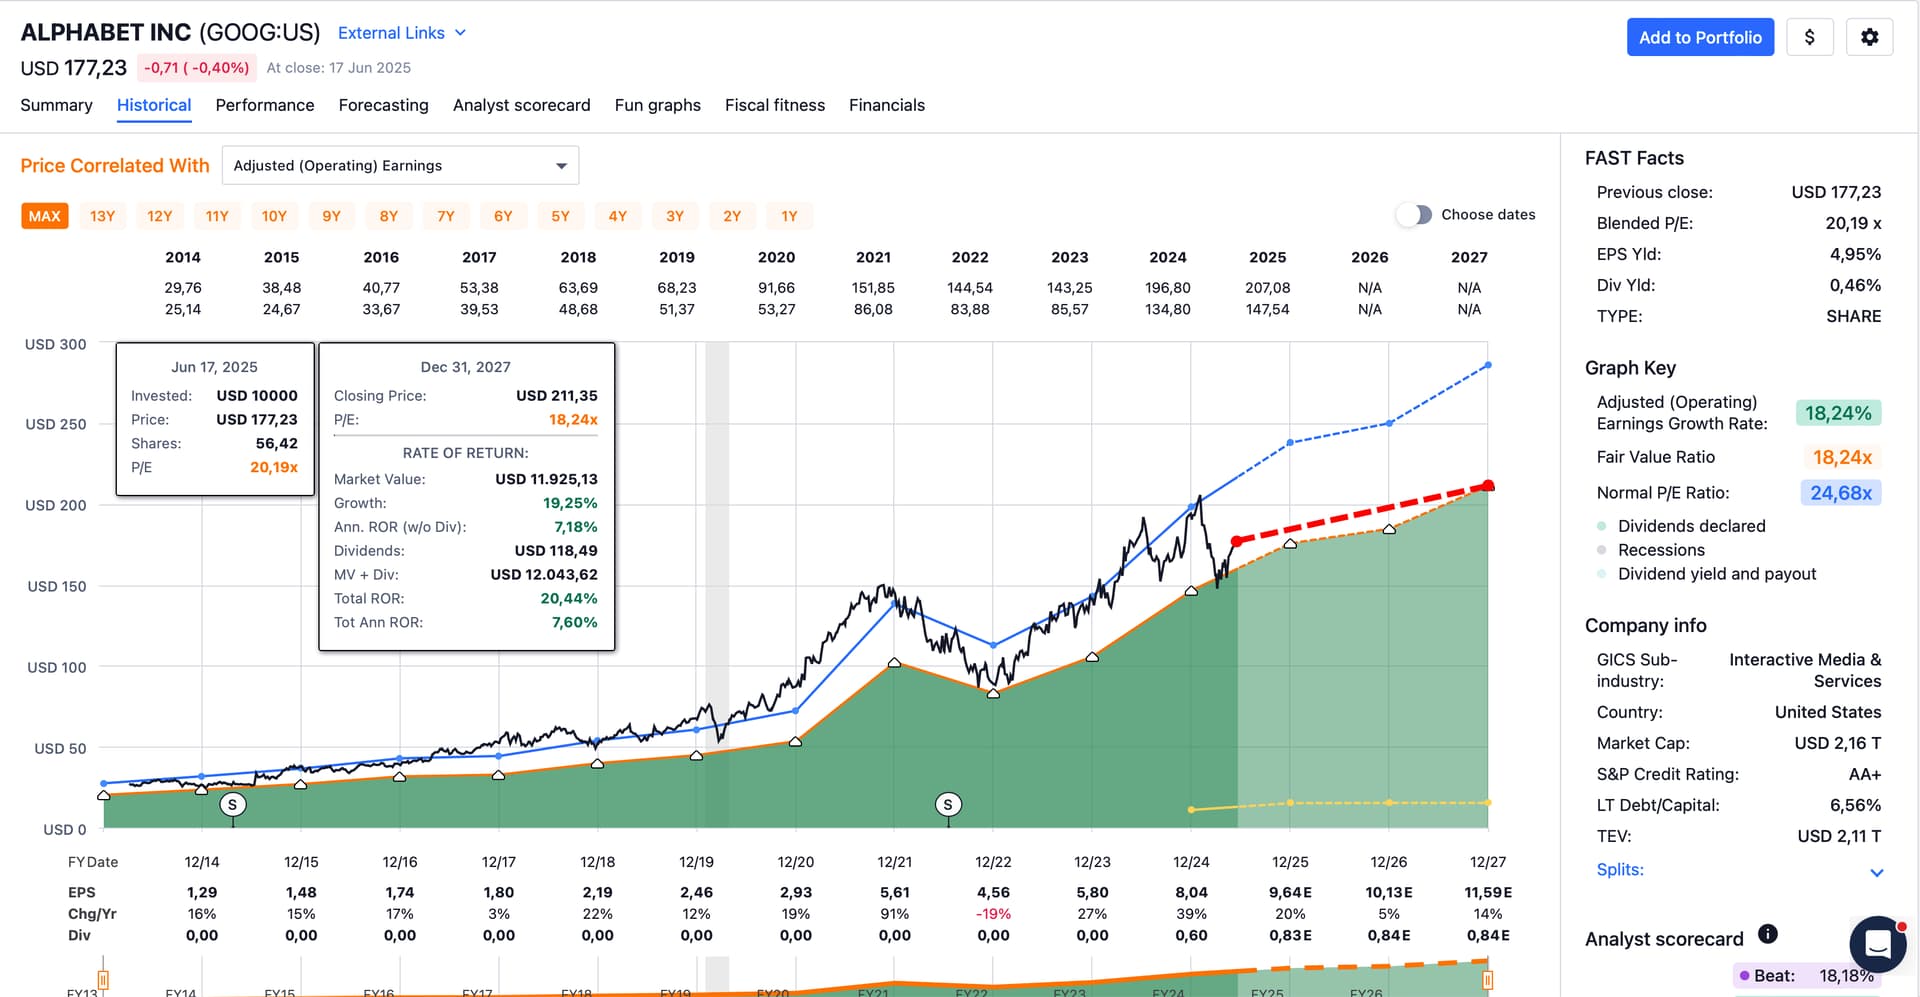
If their price went to the historic “fair”* multiple of about 18 x P/E, you’d be looking at an annualized return of about 7.6% over the next couple of years:
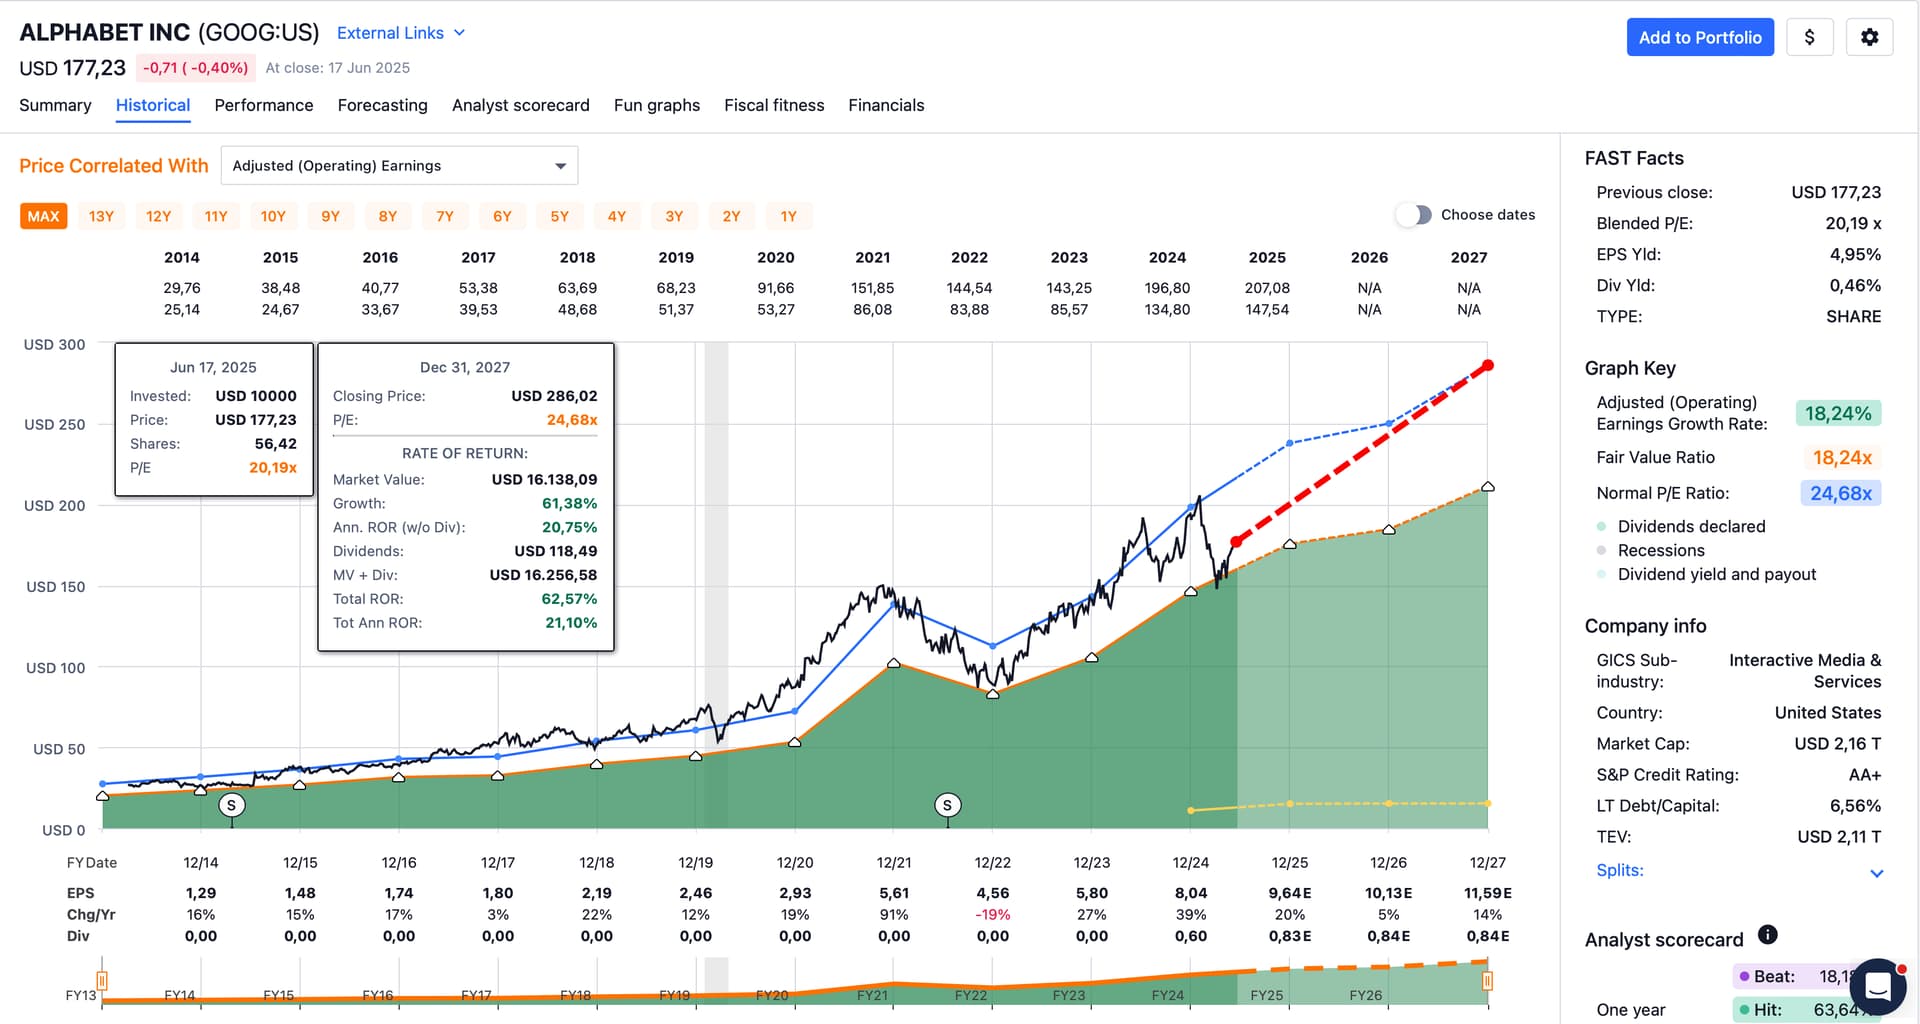
If their price went to the historic “normal”** multiple of about 25 x P/E, you’d be looking at an annualized return of about 21% over the next couple of years:
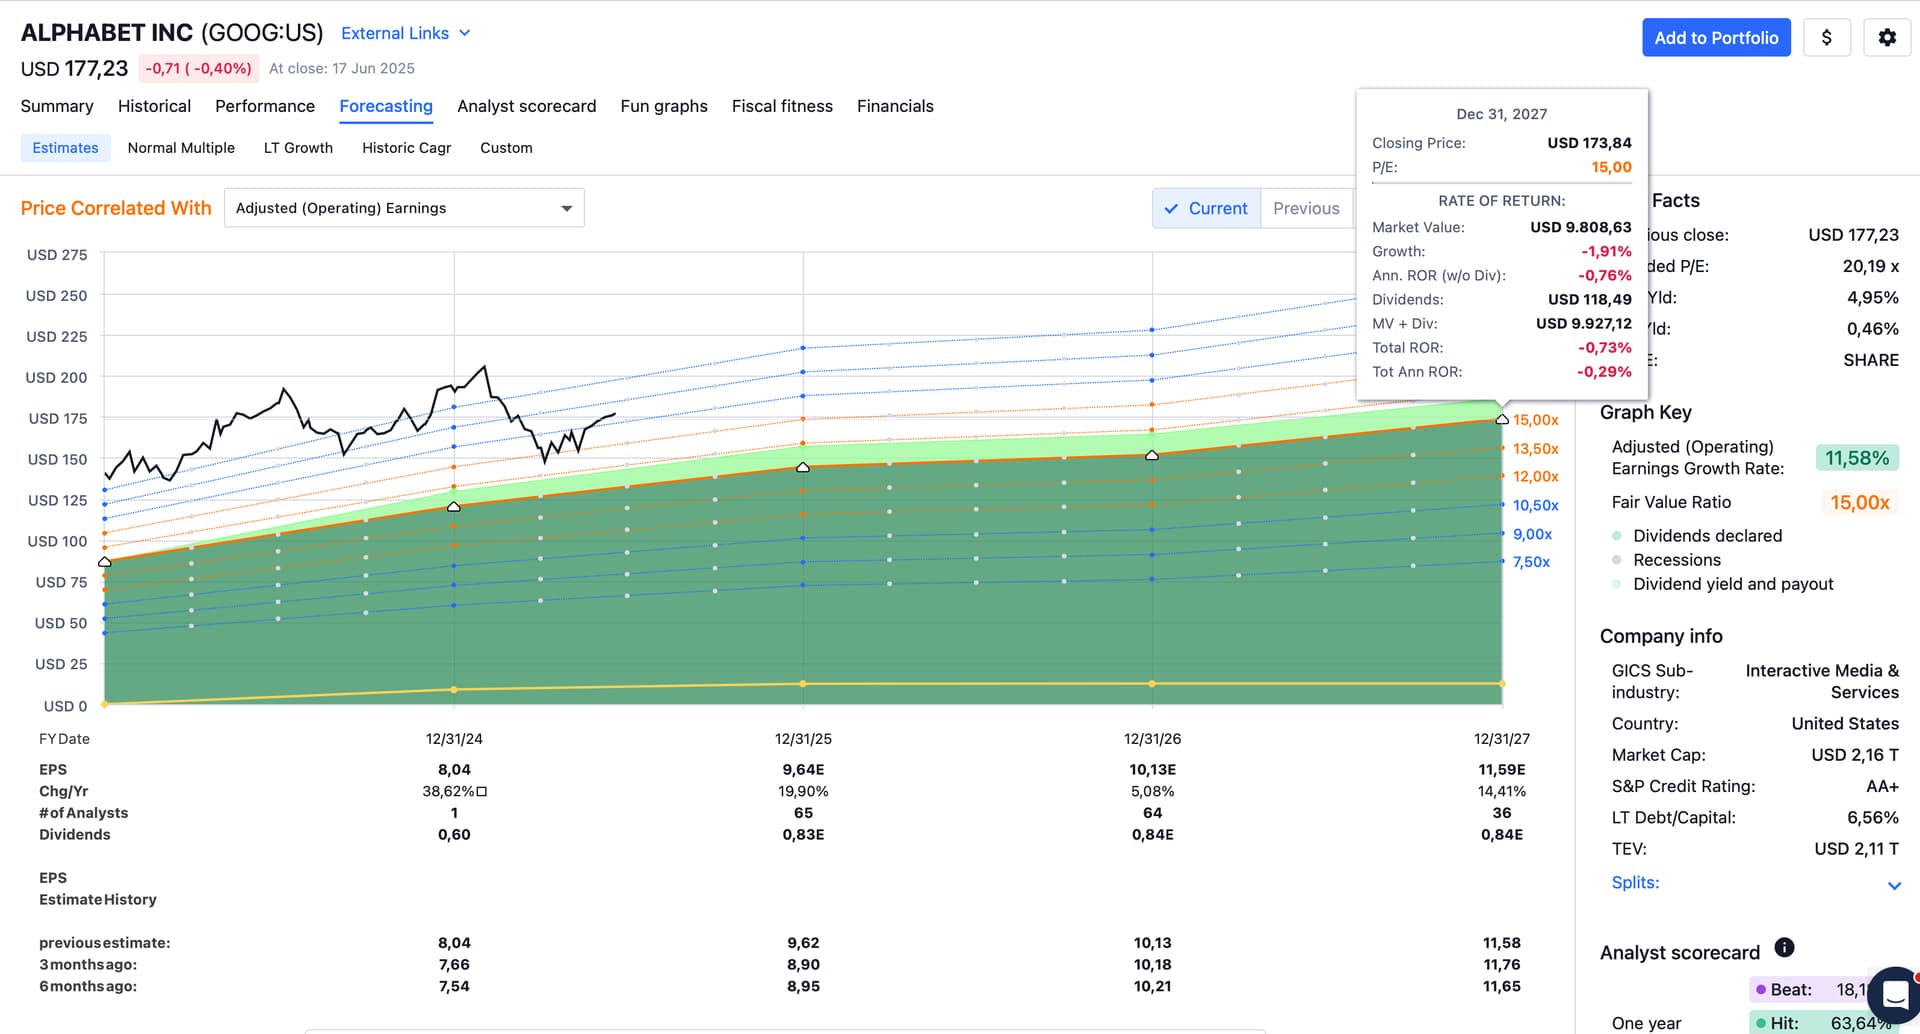
Analysts expect the company to grow about 11.5% annually looking from Jan 1 2024 to the end of 2027, and thus a “fair”* multiple of only 15 x P/E. If the company ends on at the end of 2027 with a 15 x P/E stock price, you’ll be about flat with your investment over the next two or three years.
If however the company returned to its historic multiple of 25 x P/E, you’d look at the above mentioned annualized over 20% return.
Hope this helps!
I’m not a buyer, either, but then again who am I – as a former insider – to hand out any advice on GOOG when I sold my last vested grants sometime around late 2020 …
… had I held on to them, my net worth would be about double what it is now.
Hätte hätte Fahrradkette as we say in German.***
[*] “Fair”: shows the multiple used for the orange valuation line. One of four possible formulas is used, either:
This multiple also represents the P/E ratio of the orange line. When the black price line touches the orange line it is trading at that specific P/E multiple.
In Google’s case I believe formula 2 was applied, i.e. the company grew their earnings by about 18.24% over the selected time period, hence the “fair” multiple is P/E = G, the average growth multiple (over the selected time period).
[**] “Normal”: shows the average multiple the for the blue valuation line. This line and ratio represent the calculated P/E multiple at which the market has tended to value the company over time. Calculated by a trimmed average of annual p/e values for the period shown on the graph with one high and one low removed.
[***] Shoulda, coulda, woulda.
Wow thank you so much for all the charts and your take on them!! Really appreciate it!
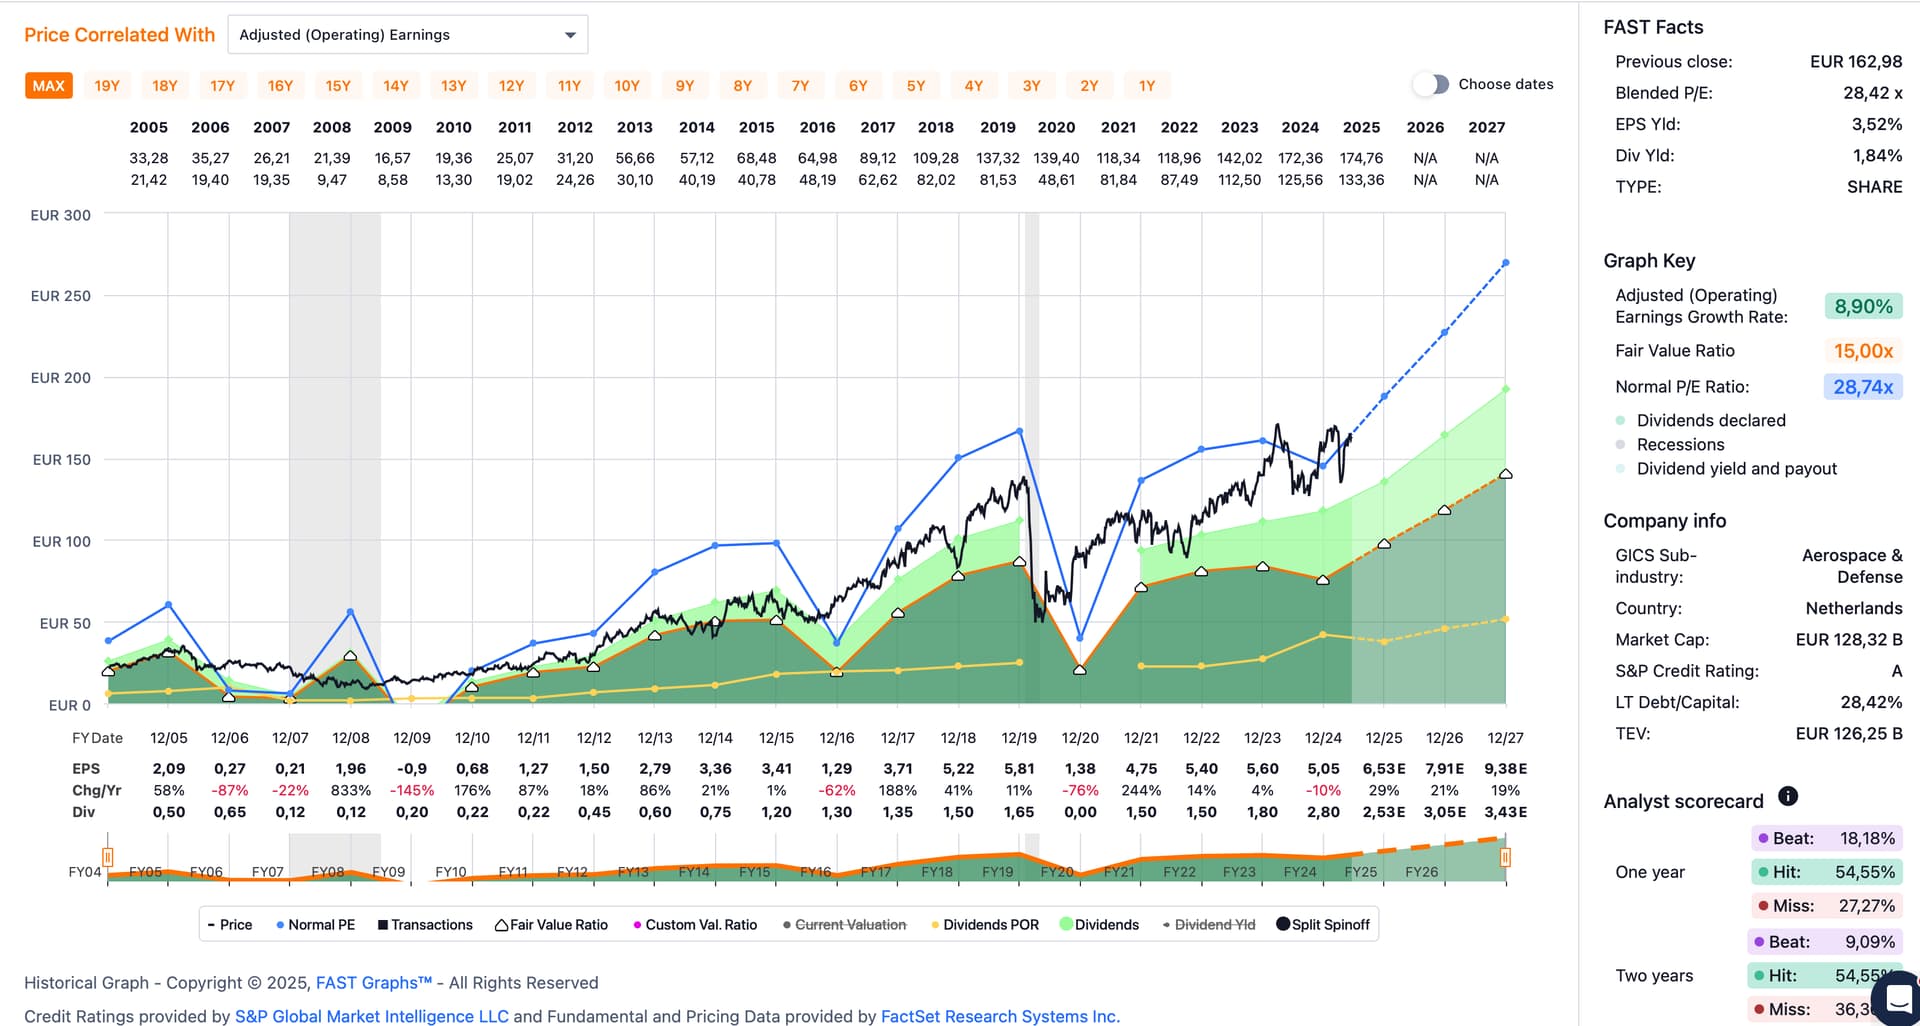
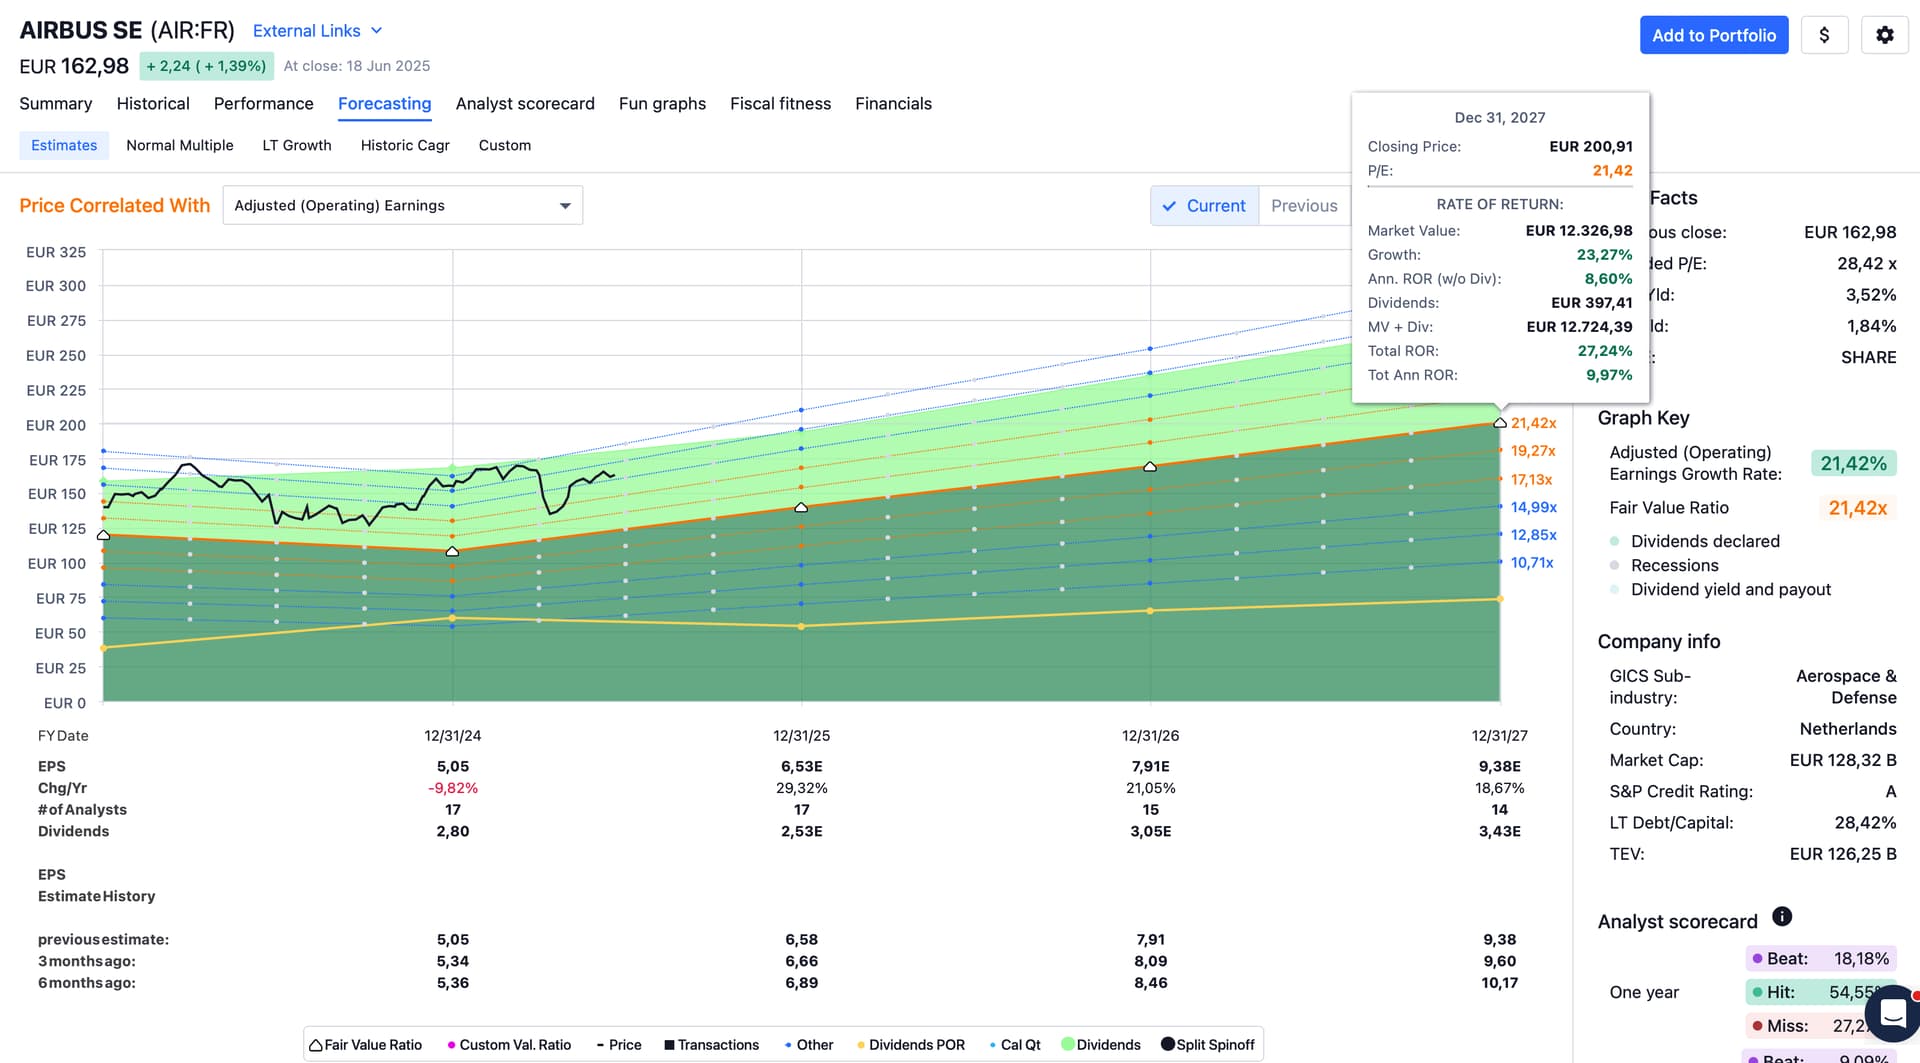
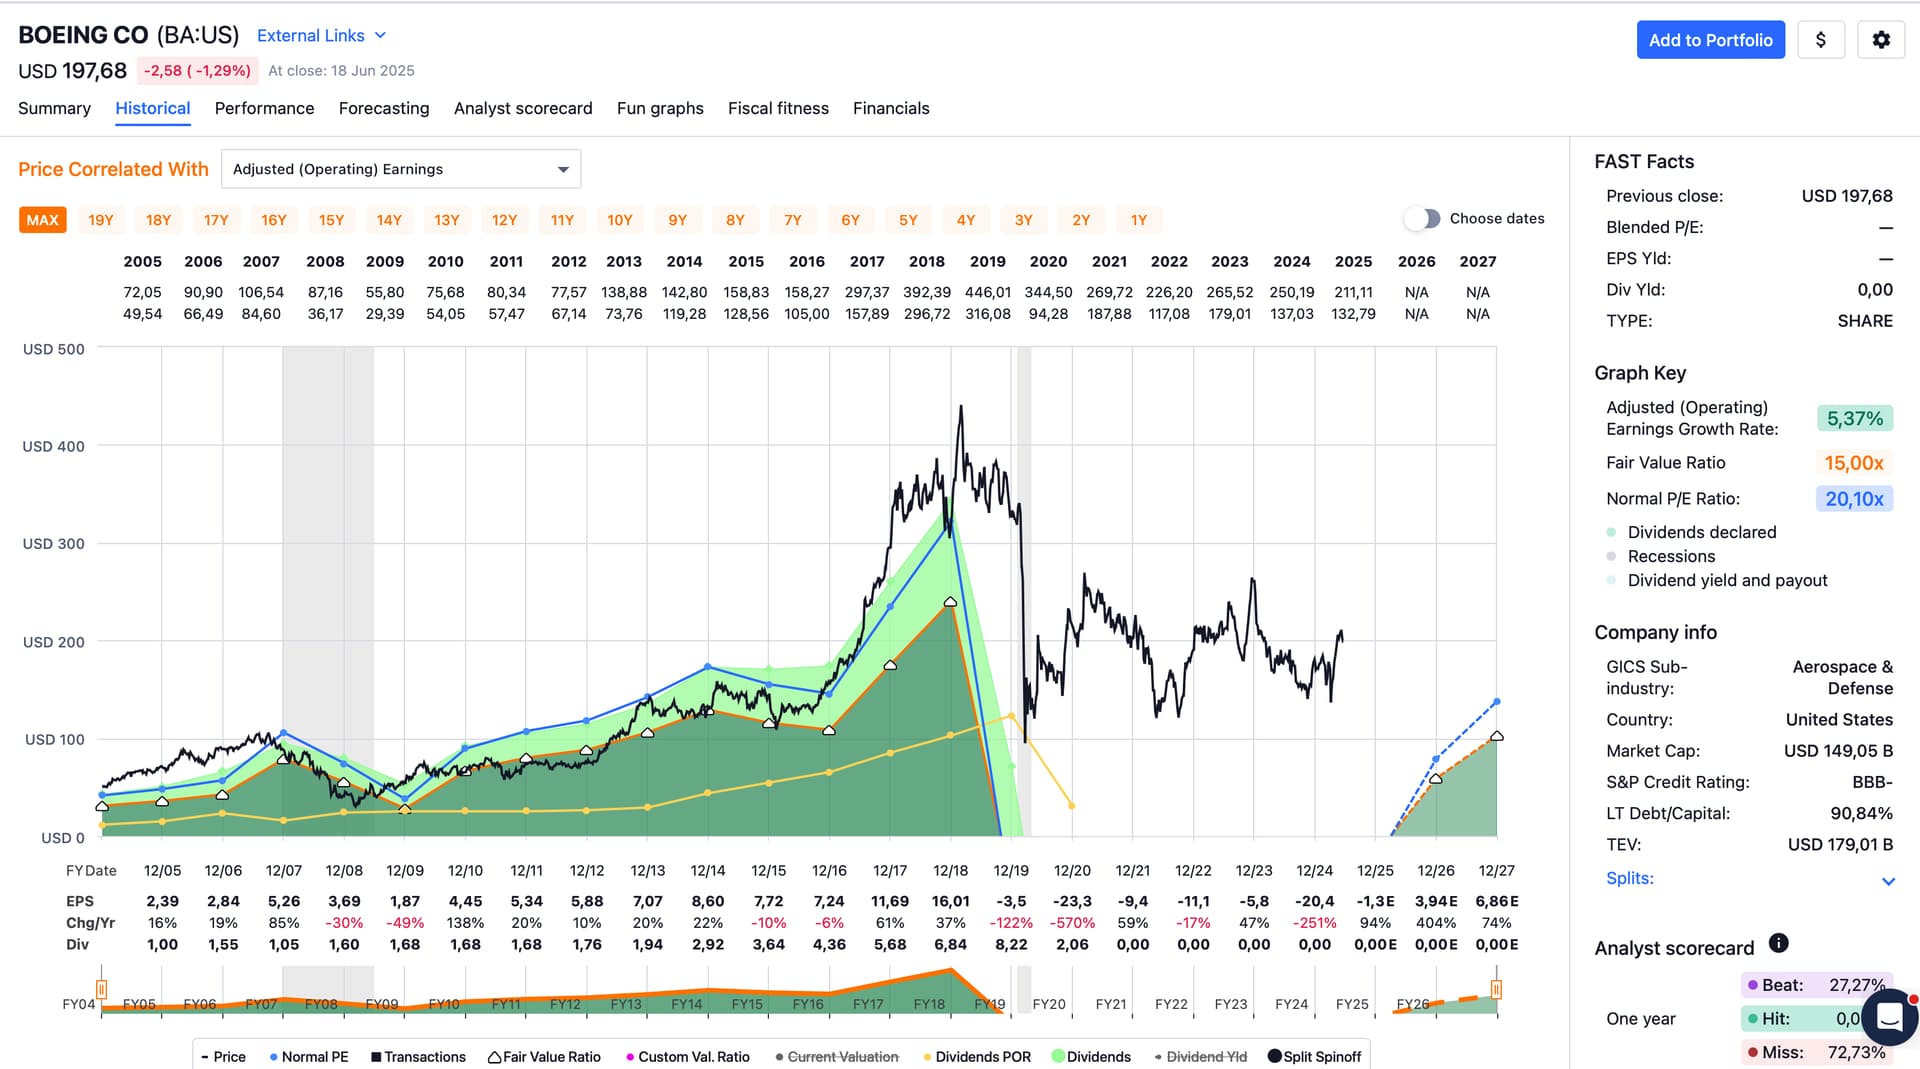
How do our gurus feel about Airbus? I wonder if it’s another no brainer I slept on ever since the bean counters ruined “the jewel of American engineering” (as an American Friend put it).
Disclaimer: not a guru! Let alone a flying guru!
Expected forward earnings growth certainly looks impressive and nice, uh, tailwind from Boeing.
Still won’t, ahem, fly for me, though.*
[*] Unsteady dividends, still a little expensive for Goofy since Uncle Scrooge told him to always look for a margin of safety if possible.
Would take it hand over fist if I had to choose between Airbus and Boeing, though:
Thanks, I doubt I’ll get it but certainly looks like a healthy company, I was actually thinking about it more than a year ago, just got reminded today where I saw some tweet that last quarter AirBus got ~450 orders for planes to Boeing’s ~50, so there’s a moat too.