Adding All-Country-Equal-Weight tilt to portfolio

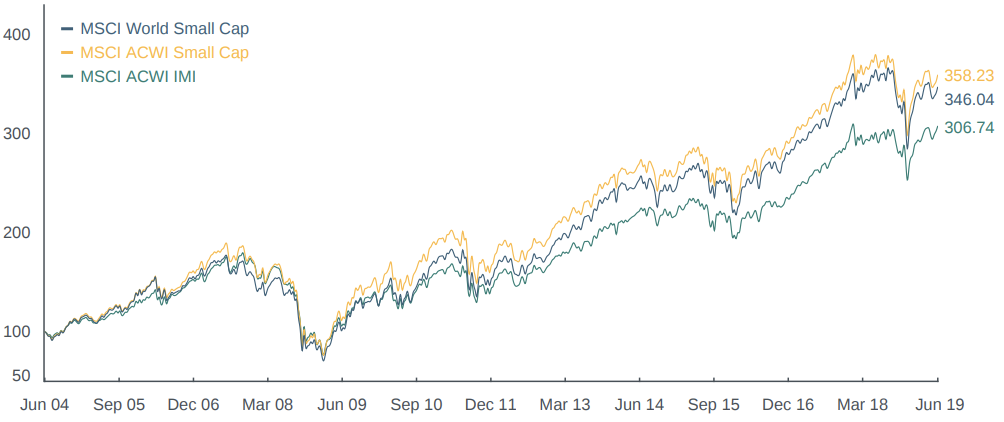
According to this research, an Equal Weight All Country portfolio generates superior long term returns to typical Market-Cap weighted portfolio:

A possible explanation to this outperformance lies in rebalancing of emerging market countries, which show more volatility and less correlation then developed countries, which is plausible.

I have found other online references to this notion, however authors usually came to the conclusion that costs associated of running such a portfolio are likely to eat up any gains, which is why it remains mostly academic.

What if we use a low cost broker, such as IB, and low cost ETFs to approach equal weights while keeping costs reasonable?

My start case is a portfolio based on:

  • Vanguard Total US (VTI),
  • Vanguard Developed Markets ex-US (VEA),
  • Vanguard Emerging Markets (VWO)
    in Market-Cap proportions of 55%+35%+10%.

Top three constituents of VEA (Japan, UK and Canada) amount to 45% of its total.
Top three constituents of VWO (China, Taiwan and India) amount to 60% of its total.

In other words, US + Japan + UK + Canada + China + Taiwan + India amount to 76% of All Country World Market cap weighted portfolio. Add 2 more countries by Market Cap and we are at 85+%.

I wont spend too much effort on Developed Markets ex-US, as they tend to be pretty slow moving and correlated. For Developed ex-US I now hold:

  • VEA (TER 0.05%)
  • CSEMU (Ishares MSCI Eurpoean Monetary Union, TER 0.12%)
  • VDPX (Vanguard FTSE Pacific ex. Japan, TER 0.22%)
    in 25:5:3 value proportions for a weighted average TER of 0.07%.

There are some underrepresented non-eurozone “victims” here, notably Switzerland (which I hold in excess through VIAC), Sweden, Denmark, Norway, Poland and Israel. I may add some of them with single country ETFs (EWD, EDEN, ENOR, EPOL, EIS) or MSCI Nordic ETF (XDN0) later on, but probably wont bother due to added cost, complexity and no signs of above average performance. My main objective was to reduce overall exposure to Japan and the UK, while preserving regional exposure and this is achieved.

Emerging Markets are where it gets more interesting and more difficult.

Here is a table with the current allocations of VWO and a corresponding ETF ticker for most liquid ETF with corresponding country exposure:

VWO 07.19	weighting	ETF Ticker
China		33.50%		FXI
Taiwan		13.70%		EWT
India		12.10%		INDA
Brazil		8.50%		EWZ, IBZL
South Africa	6.60%		EZA
Russia		4.20%		ERUS, CSRU
Thailand	3.90%		THD
Malaysia	3.00%		EWM
Mexico		3.00%		EWW
Indonesia	2.30%		EIDO
Philippines	1.50%		EPHE
Qatar		1.20%		XGLF, QAT
Chile		1.10%		ECH
Saudi Arabia	0.90%		XGLF*,KSA
UAE		0.90%		XGLF*, UAE
Kuwait		0.90%		KUW8, DX2Z*
Turkey 		0.70%		TUR, ITKY
Greece		0.40%		GREK
Colombia	0.40%		GXG
Hungary		0.30%		LEER*
Peru		0.30%		EPU
Czech Rep.	0.20%		LEER*
Egypt		0.20%		EGPT
Pakistan	0.20%		PAK

*XGLF = MSCI GCC
*LEER = MSCI Eastern Europe ex. Russia
*DX2Z = S&P Select Frontier 40

For my purposes, I defined a fixed unit of +5% overweight. For every 10000 USD in VWO, the unit would be then 500 USD. I found it is easiest to apply the same unit (or natural multiple) for every country I buy, therefore lifting the smallest ones most and making it easier to monitor and rebalance my portfolio.You can do as you see fit, the world is your oyster. This is not passive investing anymore.

Rebalancing this has to be hell, you say? Not necessarily. A simple Google Sheet constructed to show existing and desired allocations can facilitate this. Then again, my core portfolio is still the entirely passive VTI+VEA+VWO combination which keeps the overall cost low. All overweights are active plays although indexed to the passive core. My basic rule for rebalancing is to take profit at +20% of desired allocation, and buy at -10% below desired allocation, therefore minimizing the amount of transactions. Not that this is a problem with 0.30$/transaction at IB.

I would most certainly not recommend equally weighting the US and Pakistan, although something around 40%:30%:30% (US/Developed/EM) sounds pretty reasonable to me


Other references:

Comparision/summary of Market-cap weighted, GDP-Weighted and Equal-weighted All Country allocation:

Vanguard on alternative indexing approaches:

Bogleheads Wiki on equal weighted indices:
https://www.bogleheads.org/wiki/Equal_weighted_indices

Master thesis on GDP-Weighted market allocation:

8 Likes

Question: why equally cap countries and not individual constituents? I guess I can answer myself: it’s not doable :slight_smile:

I guess ideal for your strategy would be something based on MSCI ACWI Equally Weighted. It puts 3000 largest companies in the World with the same weight and rebalances every quarter. In my short research I found out that there used to be an ETF offered by Guggenheim Investments, but it was closed in 2012 due to
 lack of investor interest.

The biggest equally-capped ETF to date is Invesco S&P 500 Equal Weight (RSP). It also crushes the regular S&P 500.

Here’s an article bashing RSP and equally weighted ETFs. It basically says that they offer higher returns, but at a higher risk. Funnily enough, this article was written in 2013 and the RSP kept on beating the market capped S&P500 ever since. I guess where the RSP gets hit hard is during market crashes, which we have not seen in a long time.

2 Likes

No, honestly I don’t think I’d like that. Having equal weight of Amazon and some random Indian cement manufacturer just seems wrong.
I do however feel fairly confident betting on dynamic Asian economies (Thailand, Indonesia, Philippines) as a whole, posting 6-7% GDP growth year after year. If I were to stick to their market cap, at 0.1-0.3% of ACWi, I wouldn’t even notice if they rallied 500% overnight.

1 Like

But why?

Amazon has been an exception, in my opinion, due to their innovative, customer-focused culture and strong leverage of size and economies of scale.

But looking beyond those few internet behemoths, what about about other S&P 500 heavyweights, such as Bank of America or Exxon Mobil? For all I know (without in-depth research), why shouldn’t some random Indian cement manufacturer outperform them?

Also, in the case if a market-cap weighted investment, I would assume that if BoA failed/went bankrupt, the fallout to extend to a bigger proportion of my portfolio (U.S. and other banks) than some random stock from the other side of the world. Random Indian cement manufacturer‘s stock price might suffer short-term, due to general market reaction and sentiment. But fundamentally, their business is probably less affected, and thus less correlated in the longer term.

1 Like

I wouldn’t care about a single company in a blend of 3000. And probably the performance of both indices (country & constituent) would look quite similar.

In fact, I think your equally weighted index is a convoluted way of saying: I want Small Caps! Because it would be mostly small caps. So instead of devising a complex method of how to put this index together and have a nightmare rebalancing, why not just invest in a Global Small Caps ETF (like VB + VSS)?

Starting from a 100 in 2004, the ACWI Equal Weighted grew to 327 and ACWI Small Cap grew to 358, so it’s even better!

1 Like

Valid point, but not a solution to avoid overconcentration in single countries. The goal was to diversify away from political risk as well as invest in countries which show less correlation with the broad market. I’m fairly certain this strategy helped reduce volatility without sacrificing profits in my portfolio.

Maybe your personal approach to building an index would make you sleep better at night, but just look at these curves, they’re exactly the same, both are just slightly amplified versions of the global equity market.

The Equal Weighted clearly has higher volatility than World, otherwise it’s a copy of it. The same goes for small cap. For small cap the return is even a bit higher, so the volatility is probably also slightly higher. Anyway, I’m sticking to the VT :slight_smile: .

2 Likes

Again, true, but for very obvious reasons. If you equal weight world small caps, you still get a majority from the US (1408 stocks in VB) and 50% of the VSS is from only 4 countries (Japan, Canada, UK, Taiwan). Country exposure remains similar to MSCI World which is why it looks the same.

1 Like

If you’ll creat a tracking spreadsheet at Google Docs, could you share it?

BTW. This strategy seems to be just overweighting EMs that have low market cap. You add risk, you get more return. Long term it’s reasonable, if you can bear the risk. The only problem I see is the rebalancing. Seems like to be a lot of effort.

While I may be ok with the second statement, I don’t agree with the first one. I don’t see how going away and reducing quota for the most advanced economies with stable stock systems, while increaseing participation in extremely unstable countries/regimes with a minimum of tradition for capitalismus/stock market will reduce political risk. In fact I think you are more exposed to political risk when investing in immature economies with very young democracy / dictatorial regimes. In fact one of the few instances where the stock market went to 0 was Russia in 1917, and this may happen again in certain frontier country. So yes, higher risk and less correlation make for an attractive divestment, but not fool yourself that put your money in unstable countries reduces political risk. It exposes you to much larger risk than concentration. And as bojack pointed out, everything is correlated anyhow.

2 Likes

To be precise it was confiscated by the socialists without compensation. Number of firms were nationalised with little compensation in UK after the war and in France couple of times during socialist rule. I agree that it’s bigger risk in EMs, but DMs, especially in Europe, are not completely immune from criminal socialists.

1 Like

Market Cap is not proportional to political stability. The UK is a good example here. My goal was to diversify from overconcentration in heavyweights. China is 33.5% of EM, leaving the remaining 66.5% to 23 other emerging countries. There is always room for risk-diversification.

1 Like

UK is not a good example, it’s an exception - a black swan. How many military governments last 50 years you had in UK and how many in Turkey? How many defaults and devaluations in USA and how many in Argentina? If anything, EM gives a premium for lack of political and economic stability.

I agree though with second part of your comment. Over-concentration makes a rare black swan more painful, if it hits your main component of portfolio. In theory diversification should give us some protection but due to more and more correlation between markets it’s less and less effective.

BTW. There was interesting discussion about this strategy at bogleheads:
https://www.bogleheads.org/forum/viewtopic.php?t=118873

Pretty much what I’m doing with my EMs. My basic allocation unit is 1k.

“Why the difference in rebalancing effects between the emerging and developed markets? First, the volatility of the emerging markets is much higher than the developed markets, with SDs averaging about 50%. Since the rebalancing bonus is proportional to the variance of the asset, a doubling of SD results in a quadrupling of variance, and thus of rebalancing benefit. Second, correlations are much lower in the emerging markets arena—typically about half of those in the developed world, providing yet another margin of benefit.”

The author did an investigation from 89 to 99 and returns are (much) higher, 5.7% annually. See above for my calculation for 2003 to 2012. It was also (much) higher, 3% annually.

Emerging markets are much less correlated to each other than developing markets.

The individual risks might be greater, but overall it depends on the correlation between them.

One of the main reasons being exactly that: Political instability in some of these countries.

Me too. I am roughly equally weighting a couple of EM markets with country ETFs.

1 Like

I wonder what is the TER on those country ETF?
The only sure thing with this approach is that you are increasing TER. With globalization coming the anticorrelation will slowly go away. And who do you think will be making most money in 10 years in this countries such as Nigeria etc? Companies like Apple etc. Investing in the developed market means very little. Most of nestle profit comes from India and Asia. So you may even overweight frontier /em if you are not careful. You should look into from where the money comes from in the dev market largest stock.

2 Likes

0.45% to 0.65%, Frontier Markets higher.

Maybe. But then, what’s for sure investing?
Also, I’m pretty sure I’m diversifying geopgraphically.

Remains to be seen. Apple is expensive, and seem to be getting more expensive lately. They might be too expensive for (nowadays’) Emerging Markets, compared to the Chinese competition.

How so? :thinking:

I looked it up, and their annual reports to me don’t really seem to support that:

Nestlé had sales of 1.5bn USD in India, and a total 23.5bn USD in East/South East Asia, Oceania and sub-Saharan Africa (which includes China, India, Indonesia, Pakistan and Bangladesh, as well as most of the African continent).

On the other hand, one single developed country, the U.S. accounted for higher sales, at 27.6bn USD alone.

Operating profit ratios were comparable for Asia/Africa and the Americas.

That’s what I explicitly intend to do.

Thank you, I was wrong on nestle and trusted something I read somewhere. As always I should go to the source.
Did you account for dividend withholding on top of TER? I don’t think Switzerland has lots of tax treaties with frontier EM, but I have never bothered to search. That could mean an additional 0.30 of expenses pa if dividends are high.