A small stab at modern portfolio theory

I was reviewing my portfolio the other day and I noticed an amusing fact that goes against modern portfolio theory, so I thought I’d share it.

Investors care for risk-adjusted returns - on this I think everybody agrees. Given two investments providing similar expected returns, investors will prefer the one with the less risk.

Where modern portfolio theory and practitioners disagree however, is in how you should measure risk. MPT states that risk should be measured as the volatility of the stock price. In particular, William Sharpe (one of the founders of the MPT, who later got a Nobel Prize for his work) introduced the Sharpe Ratio, defined as:

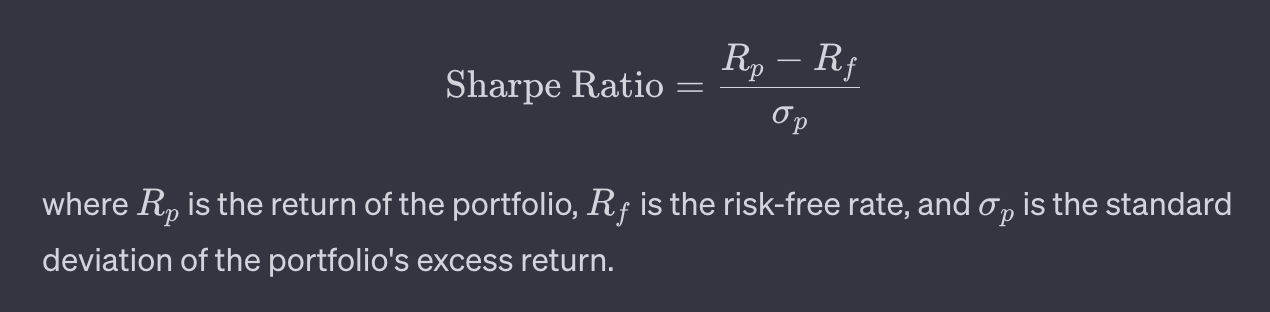
In other words, the numerator is your excess returns (how well the asset has performed), and the denominator is the risk you have taken, i.e how volatile the asset has been over the measuring period.

Now another tenant of modern finance is that markets are efficient: if a given asset has a high sharpe ratio superior to 1 (i.e a lot of excess returns for the risk that was taken), market participants should bid up the price of the asset so that prospective excess returns decline and the ratio converges back to 1.

In plain english, that means that investing opportunities with low risk and high returns should be very rare, and quickly arbitraged away because everybody would rush to them.

The other day, I was reviewing one of my biggest positions, Constellation Software (CSU). The goal here is not to present CSU’s business or investment merit (and this is definitely not investment advice).

I was amused to notice that since its IPO in 2007, CSU has had very long periods where its Sharpe ratio was very elevated.

Current Sharpe ratio is 2.86, which means that according to MPT, for each unit of risk taken, CSU has returned almost three times the returns of the average stock investment.

If you look back over times, there have been really a very few times where the ratio has been below 1. Here is the chart compared to a good diversified index, the S&P500:

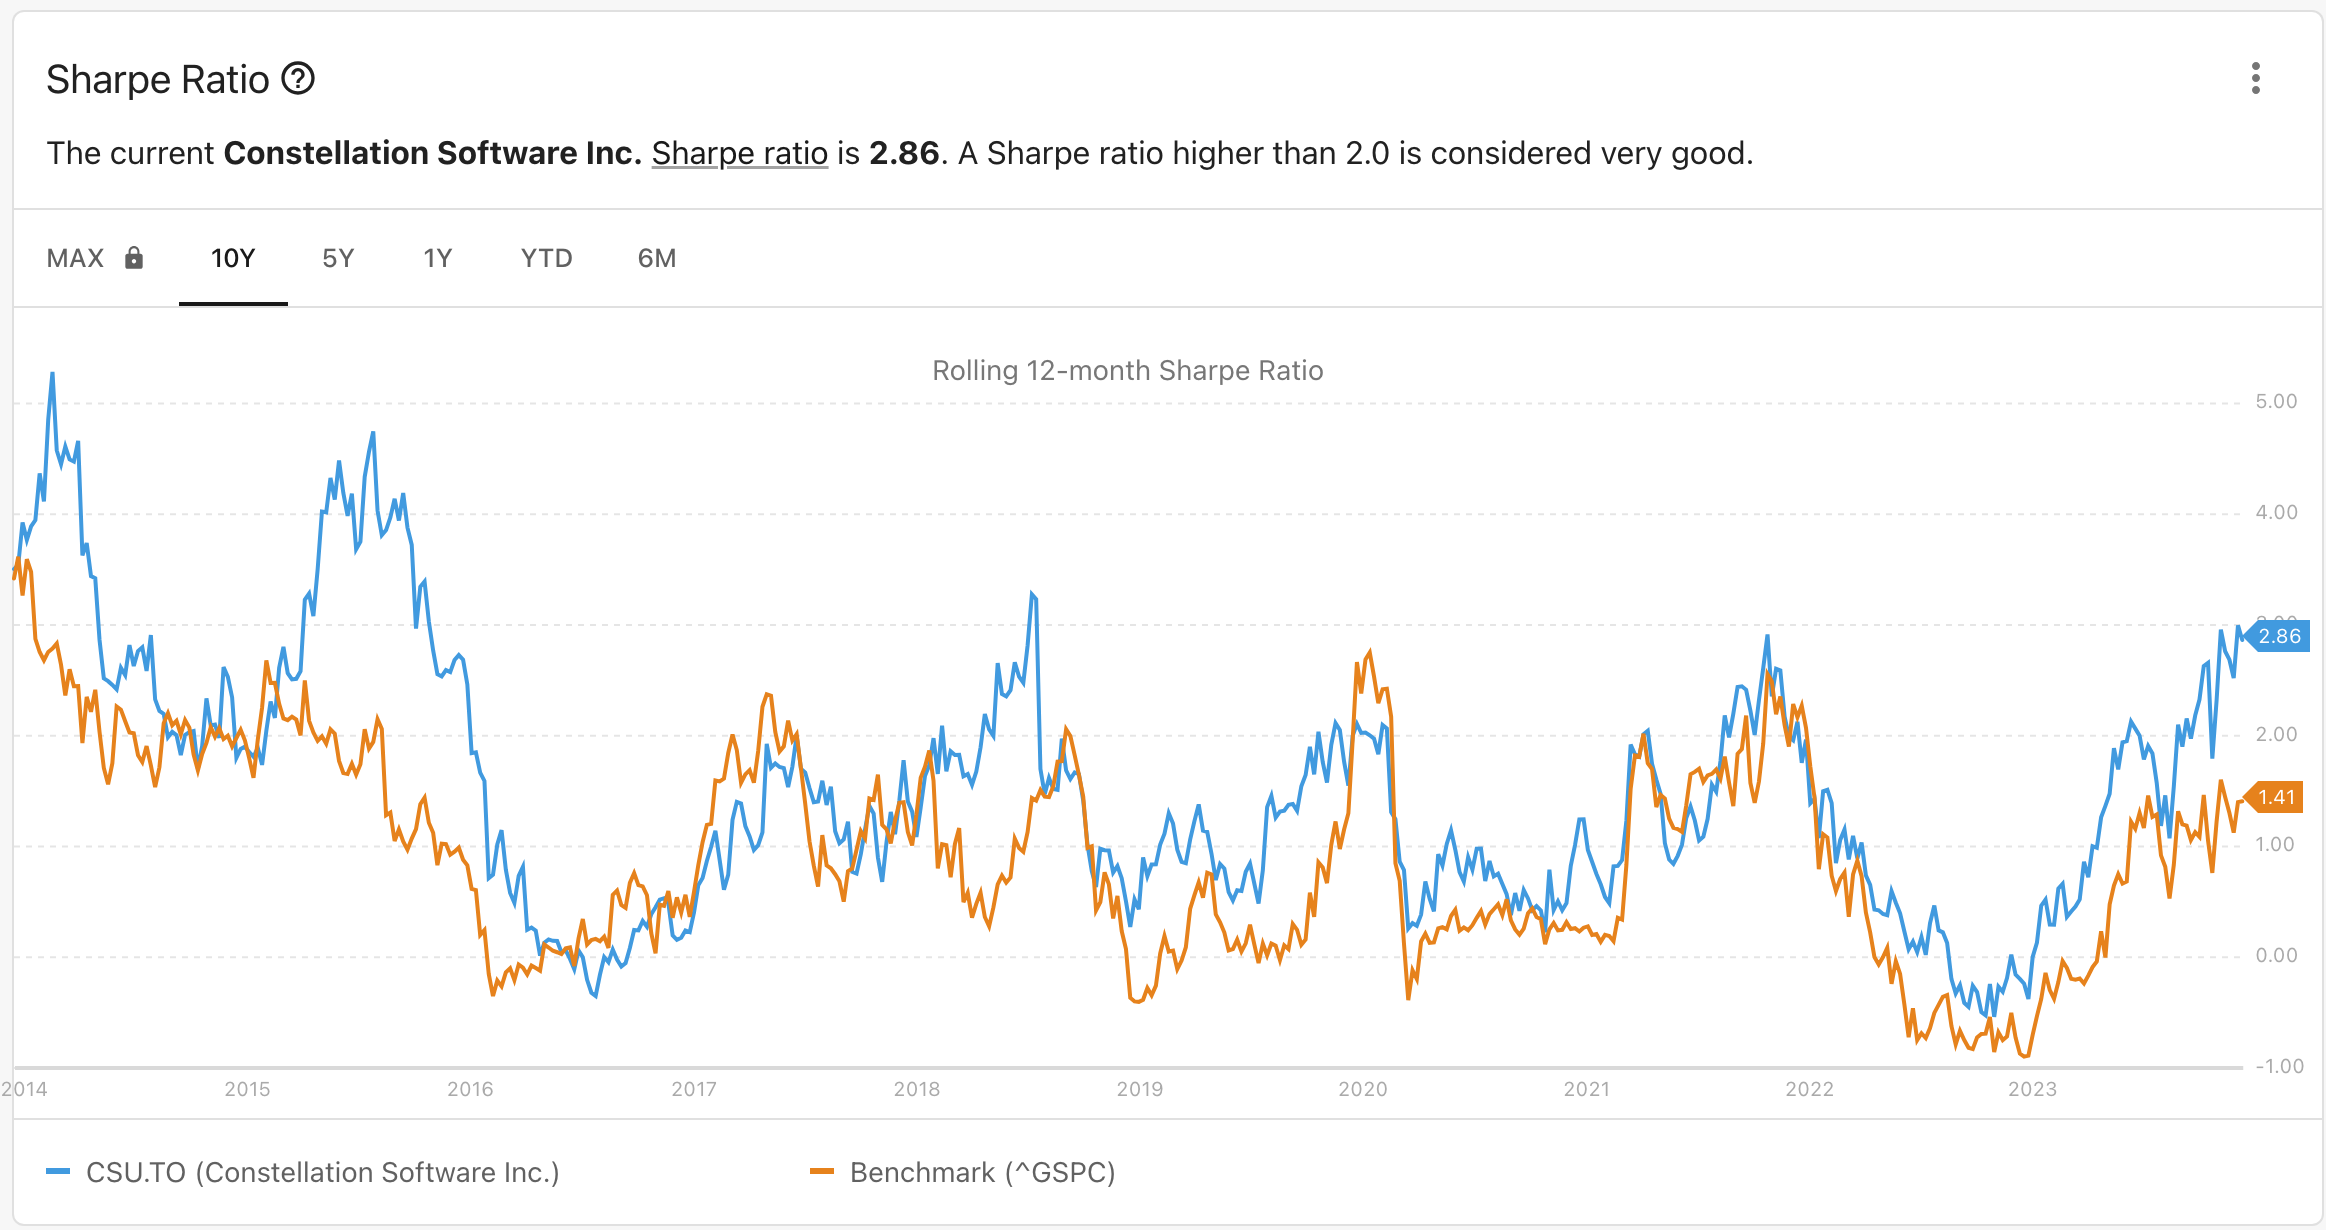
What the graph shows is that over the last ten years, CSU has had more returns and less risk than a whole index of 500 diversified businesses, at least according to MPT. One stock vs 500 businesses.

What does it look like from an investment point of view? Let’s compare it to the S&P500 again (i took the stock price of the SPY ETF, which should be a good proxy (but maybe is missing reinvested dividends).

Since 2007, CSU stock price went from 18.30 CAD to 3’300 CAD today. That’s a 34.3% CAGR.

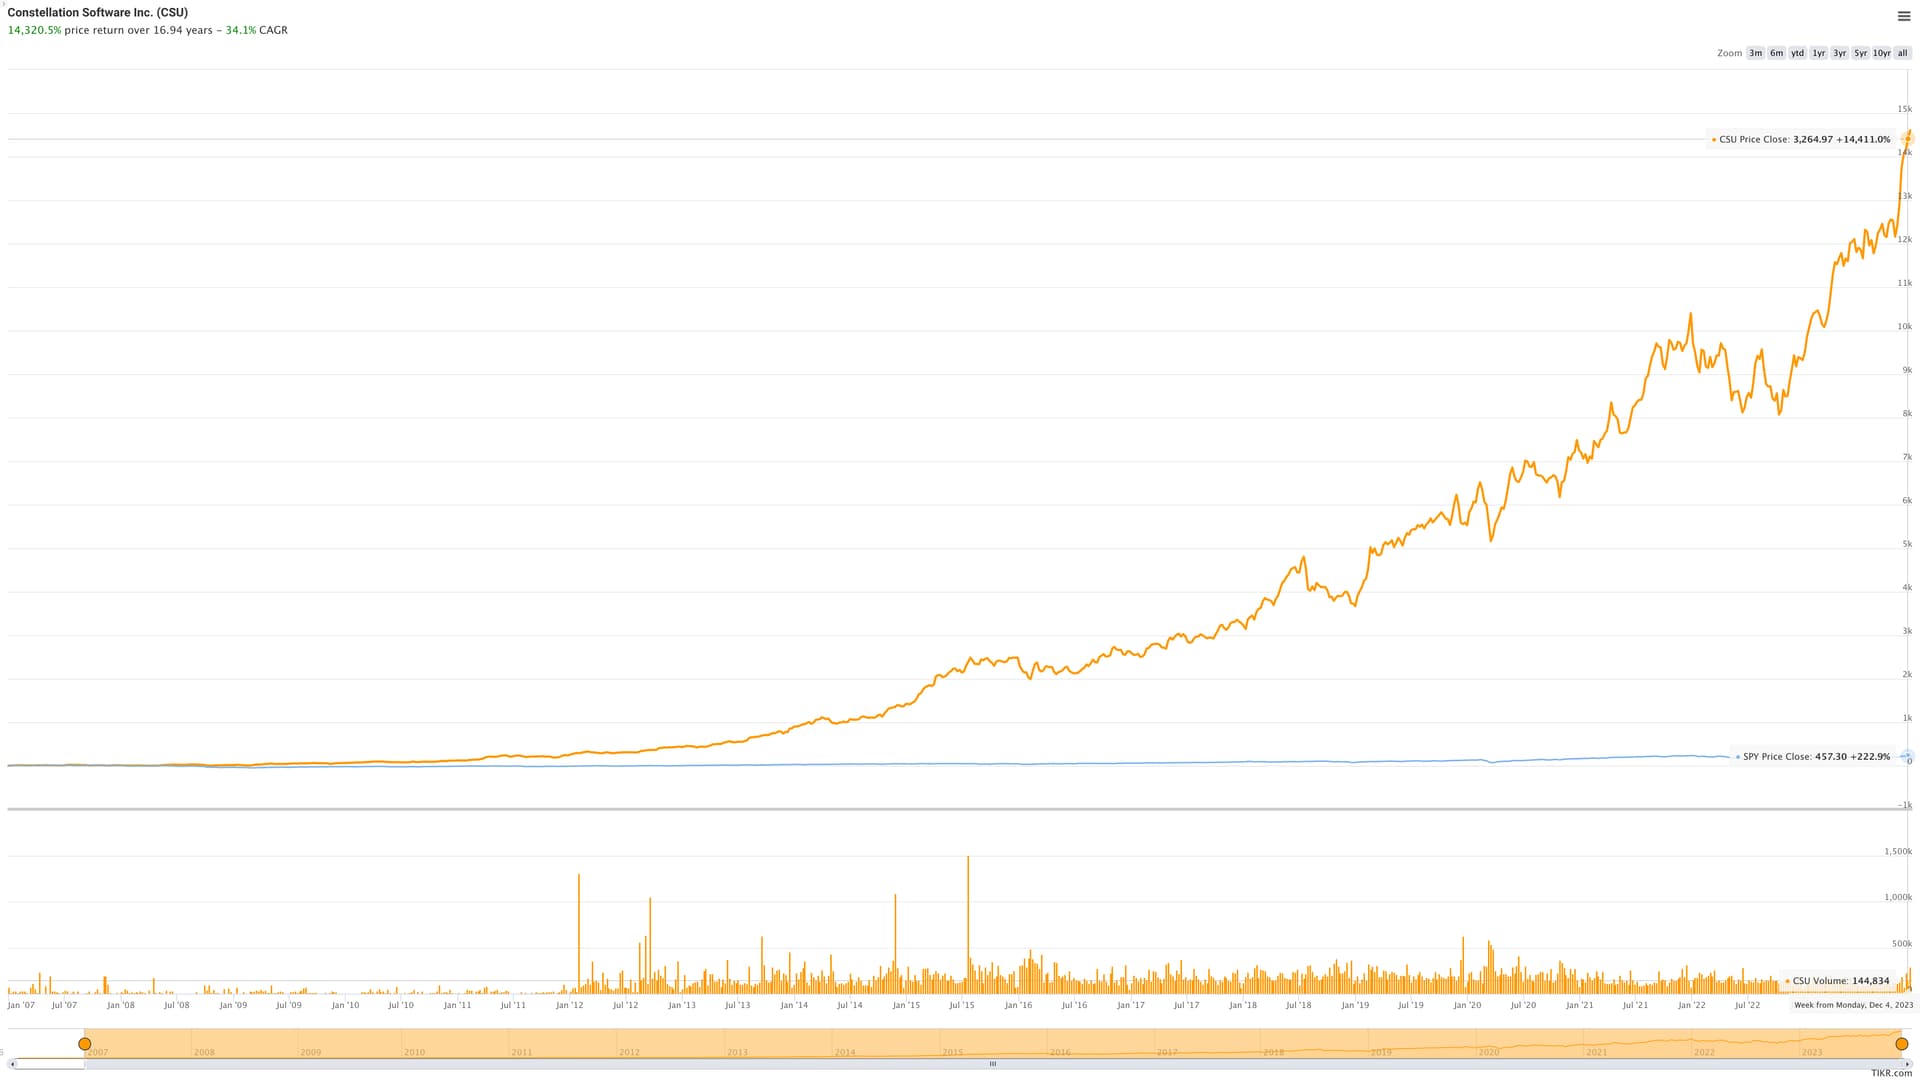
Tthe blue line is the S&P500 (it returned 282% over the same period) and the orange line is CSU.

In terms of downside, the worst drawdown was -25.9% in 2018. And 2022 was the only year in 15 years of being publicly listed where the annual performance was negative (-2% for the calendar year).

Again, the goal of this post is not to pitch CSU as an investment thesis. Just to point out the inconsistencies of Modern Portfolio Theory. Given 15 years, a stock like CSU should not exist. Its risk/reward profile should have been arbitraged away.

Either volatility is not the same thing as risk, or markets are not efficient, or another piece is missing from the puzzle.

That’s all for today.

2 Likes

Isn’t this very often being mentioned?
I don’t think it is an equality, but I guess people take it as the only “numeric” measure of risk.
Because “true risk” would need to be assessed through a detailed analysis of each individual company, and the chart hunters ain’t got time fo dat. :sweat_smile:

I always refer to Mark Howards book “The most important thing” for a great definition on risk and why risk =/= volatility :slight_smile:

1 Like

Volatility is not risk. Also Sharpe measure downside AND upside volatility. I guess real (long) investors don’t find upside movements to be a bad thing. See also Sortino ratio.

What @Burningstone and @PhilMongoose say.

Stab again at the Modern Portfolio Theory (MPT) and/or the Sharpe ratio, @Julianek, but instead of using your dagger I would recommend taking a swing with a two handed sword like this one:

Even the first time I read the reference text on MPT (for me the 9th edition of Modern Portfolio Theory and Investment Analysis by Elton, Gruber, Brown & Goetzmann, e.g. see here), my immediate reaction was that they are just using volatility as a measure of risk simply because you can calculate it (using historic data) and then use it in nice looking equations and formulas to calculate the efficient frontier and what not.*

I don’t want to dismiss volatility as a risk entirely - it’s e.g. useful to reason why a diversified portfolio will have less variance - but it’s IMO less important than the other two main risk vectors that I see. In fact, I see volalitity more as a chance than as a risk: it allows for picking reasonable entry points in good businesses that are otherwise expensive most of the time.

I would instead categorize risk in these three buckets, in order of importance (blatantly stolen from a SeekingAlpha article by one of Chuck Carnevale’s associates):

There are three kinds of risks all equity investors face.

  • fundamental risk: what can impair cash flow, put the payout in jeopardy, and potentially result in total losses (Buffett’s definition of risk)
  • valuation risk: so overpaying for a quality company that even if it grows as expected you might suffer years or decades of weak or even negative returns (one of Chuck Carnevale’s key risk definitions)
  • volatility risk: becoming a forced seller out of financial/emotional reasons even of quality companies bought at reasonable or attractive valuations

CSCO would be a great example for illustrating “valuation risk”. Buy this great business in March 2000 and then wait 20+ years until the share price is back at when you bought it.

(to be fair, you’d have collected some dividends from CSCO since they initiated one in 2011, but your total return would have been abysmally negative for a good two decades).

You can come up with examples for category “fundamental risk” by yourself (ranging from whale oil producers to horse carriage producers to say … Tesla … hm, ok, let’s pick something less controversial, say, instead … GameStop? Or AMC?).
At any rate, I think you can intuitively understand the risk of “potential total losses”.

And we’ve already discussed the volatility risk. Which IMO is more of a chance, unless your investment approach is wreckless (no safety fund/cash cushion).

Ok, I’m mostly done. Except …

I think there was also a reference to the Efficient Market Hypothesis (EMH) in your initial post, @Julianek, but I’ll glance over that tonight except for stating that it it a hypothesis even as stated by itself.
I would have lots more commentary to add here, but I don’t want to further test your patience. :slight_smile:


* I have further pet peeves with how math is used in MPT (and many other finance “math” pieces) like e.g. the use of variance (or standard deviation) instead of mean absolute deviation. Sure, they’re related, but the former tends to overvalue larger deviations (because of the squaring of differences in the variance). The choice boils down to using the simpler one to calculate rather than the more accurate one.
Maybe using the simpler one (calculation wise) made sense at the time MPT was conceived because of computational constraints, but nowadays when my iPhone (SE) is more powerful than maybe all the compute power at the time the MPT was modelled? C’mon …

4 Likes

Well I am glad to see that I am not swimming against the current anymore :slight_smile:

I remember the first few years on the forum (let’s say 2016-2020) where criticizing academic finance would seriously raise some eyebrows…

I just took the opportunity where I had a concrete example under the hand to show how MPT and EMH do not make always sense.

@Your_Full_Name I like your bucket-based definition of risk. It certainly looks a lot like Buffett’s definition in his 1993 letter:

And you don’t have to convince me about EMH either, I actually wrote much in detail about its shortcomings in a former article

2 Likes

This is the biggest joke of all. People use EMH as if it was some kind of fundamental law. Just look at the assumptions of EMH and you can barely use it even for academic purposes!

1 Like

The share probably had 5x the bancrupcy risk, vs. A market cap weighted, average broad market company. Considering what they do - that probably feels about right. So why does the 5x Performance disqualify EMH?

The only thing we disprove is Volatility as a proxy for risk. The Problem with such shares is that they mainly come with hefty long tail risk. Such risk is there - but it just doesnt reflect itself in the Volatility.

You can compare such share with the once famous short VIX trade that delivered amazing returns - until the risk materialized. Is the share bound to go down to zero? No, you can be on the lucky side of the risk momentum until the company matures and becomes less risky. Then, the gamble payed off. But if you end up on the unlucky side… you know why you got the amazing return the prior years.

2 Likes

Hey, don’t touch efficient market hypothesis!

As for risk-reward profile, I don’t see why someone would use MPT for individual stocks. It is for asset classes.

Your example is pure cherry picking. I would find you examples of all kinds of combinations of return and volatility among individual stocks if I would care. Anyone can run stocks screening software and found such.

But what I completely agree is that risk is not volatility. That’s why your example is not valid: in case of individual stocks, volatility does not capture all types of risk. Like it was already described in this thread.

3 Likes

This risky company with risky stable revenues mostly coming from risky reccuring revenues using risky debt like deffered revenues uses a risky strategy of diversification in different subsidiaries that have different activities and has a risky high net income on total asset

Me touching EMH …

ezgif-1-2ec9418c33

the E stands for “efficient”

1 Like