More interestingly I find that dividends are higher than before the whole Corona phase.
So businesses seems to be highly profitable but do not even have opportunities to invest in further growth ?
More interestingly I find that dividends are higher than before the whole Corona phase.
So businesses seems to be highly profitable but do not even have opportunities to invest in further growth ?
Why that large?
Sounds like a lot of cash sitting aside.
I understand our “emergencies” might differ, but this is quite an amount.
Which ones can you envision?
I keep 3 months of expenses (not salary), but then again I live alone without any dependants yet.
I believe I’d at least double that if I had a family and if I was the only one earning.
Can you please elaborate a little bit on the bold marked words? You say that you held 60/40 portfolio, with CHF cash as a big part of the non-risky asset. But then you say this:
Not sure if I understand your thoughts here. Didn’t you buy more stocks after 30% loss with CHF cash?
I know you are getting a lot of questions to your post, but here’s more…
Have you reduced this to 35% recently in preparation for a bear market? As it’s very low for a long-term investment such as 3a is, no?
And the rest 65% in 3a, is that cash, or bonds, re, gold? Waiting to be deployed/ shifted back into shares within 3a near to a market-bottom?
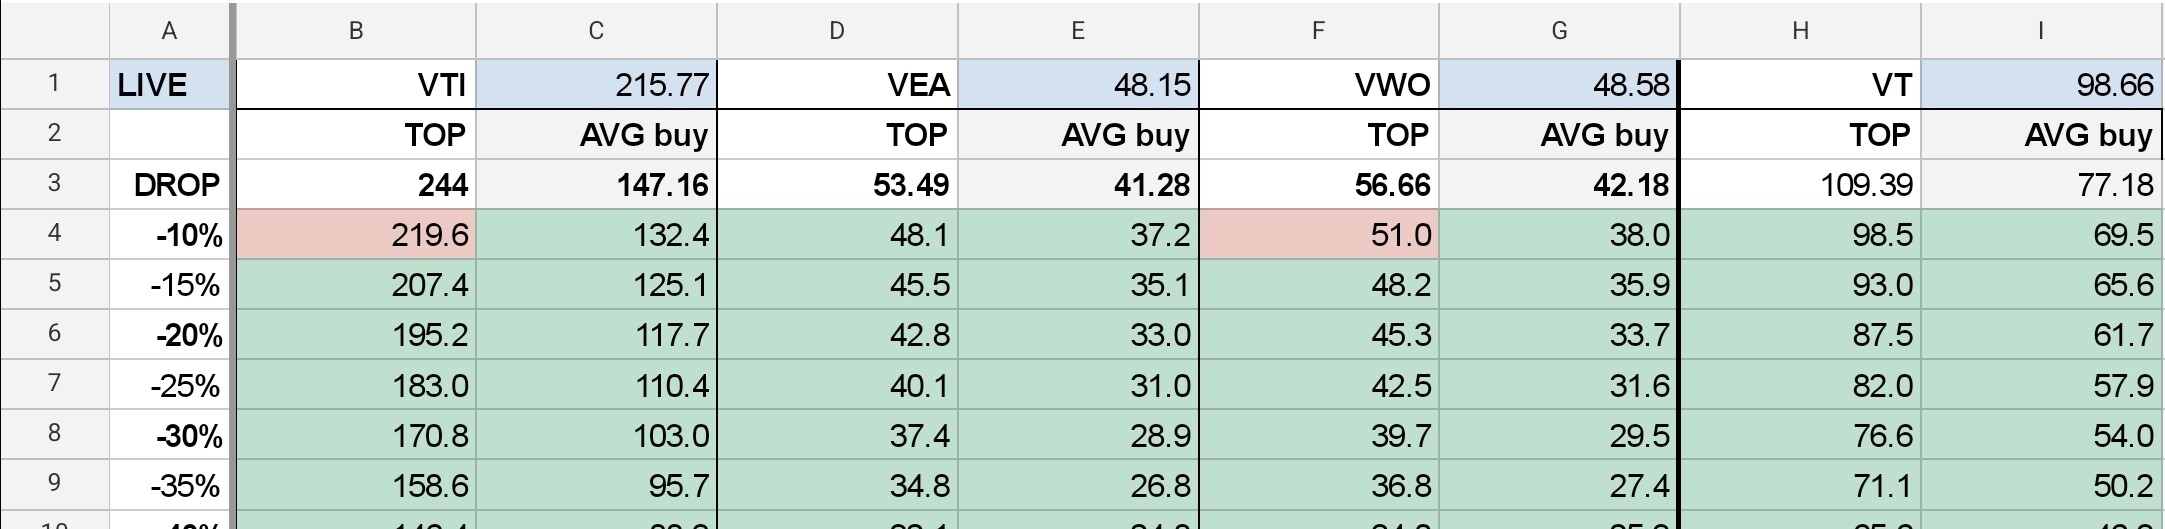
I have a shopping list of 1 or 2 blue chip funds that I would have been happy to buy at ATH price and rules how much and when I will buy: at -5% vs ATH, -10%, -15%, -20%, etc…
My asset allocation will change as a result (will involve some incremental margin but to safe levels).
Without these rules I behaved sub optimally in past crashes
This is certainly not supported by efficient market theory, but during crashes rational behaviour seems to fly mainly off the edge off a cliff… 
Similar to this, I built myself a tiny “dashboard” for a few tickers.
Looking forward to bit more reds. ![]()
Except cash is also an asset class. Keeping a certain % of cash on the side can be a sound strategy.

During tech bubble worthless companies skyrocketed…AMD, MSFT, APPL… are not going to disappear tomorrow
Wondering what happens after the FED.
Unclear to me, are the market reacting to the FED or to the situation in Ukraine. I’d have thought the FED is already pretty well priced in, while Ukraine is more volatile.
When is the FED doing its thing?
My feeling, following daily charts for US stocks since a few months, is that institutions (or some big players) have started selling gradually some time ago. While there has been an upward trend during the days for some time (no idea who was buying “the dip”), it seems the volume of stocks waiting to be sold outclasses the volume participants are willing to buy.
My take is that big players didn’t want to crash the market by selling their stocks all at once but have tried to do it gradually to get the most value they could out of it. It fits with a narrative where they would be reacting to the policies anticipated from the FED but it’s taking time to get that (big) adjustment priced in. The situation in Ukraine may add another layer of pressure on that, especially today (and in recent times).
The issue with Evergrande is also coming to some potential effects, as defaults would have to be acknowledged and the balance sheets of the bond holders take a hit.
That’s just my read. Positive news on either the FED’s or/and Urkaine’s front could funnel a quick turn up. It’s still early to call a crash.
Wednesday: The Fed - Meeting calendars and information
Precisely, and lucky tomorrow is pay day… Looking forward to buying some VT below 100$, longtime we didn’t see that now, and next month maybe even cheaper ![]()
Hi @dbu
I’m intrigued by you excel table, but not sure I understand.
Could you explain a bit more?
Thanks
Not too complicated:

I use it for a quick sneak peek to see where we are at the moment, and to remind myself to buy as we reach certain “discounts”.
how to feed live values to xls?
still don’t get it. what is the condition for color change?
could you replicate a formula for -10 and -15? tx!
If live price is lower than the value in the cell → red
0.9 * top value
0.85 * top value
thanks!
to the topic. - the dip is not even in the observed horizon.
What I don’t get is why Vanguard bonds drops along? should be vice versa, or regulators delay interest raise artificially?
I’m also a believer in consistency.
That said, it’s the 25th of the month, and my day-to-day account’s balance has been down to 20 CHF for a week or so. I always keep 20 CHF as an emergency fund. I still have about about CHF 2500 in savings elsewhere, though those are fully earmarked for the upcoming tax payment.
Rather than keeping a big emergency fund, I’d just allow myself a “savings holiday”. A month (or the 13th salary) where I’d just save less, if I feel I need to take an expensive holiday or need to replace anything at home.