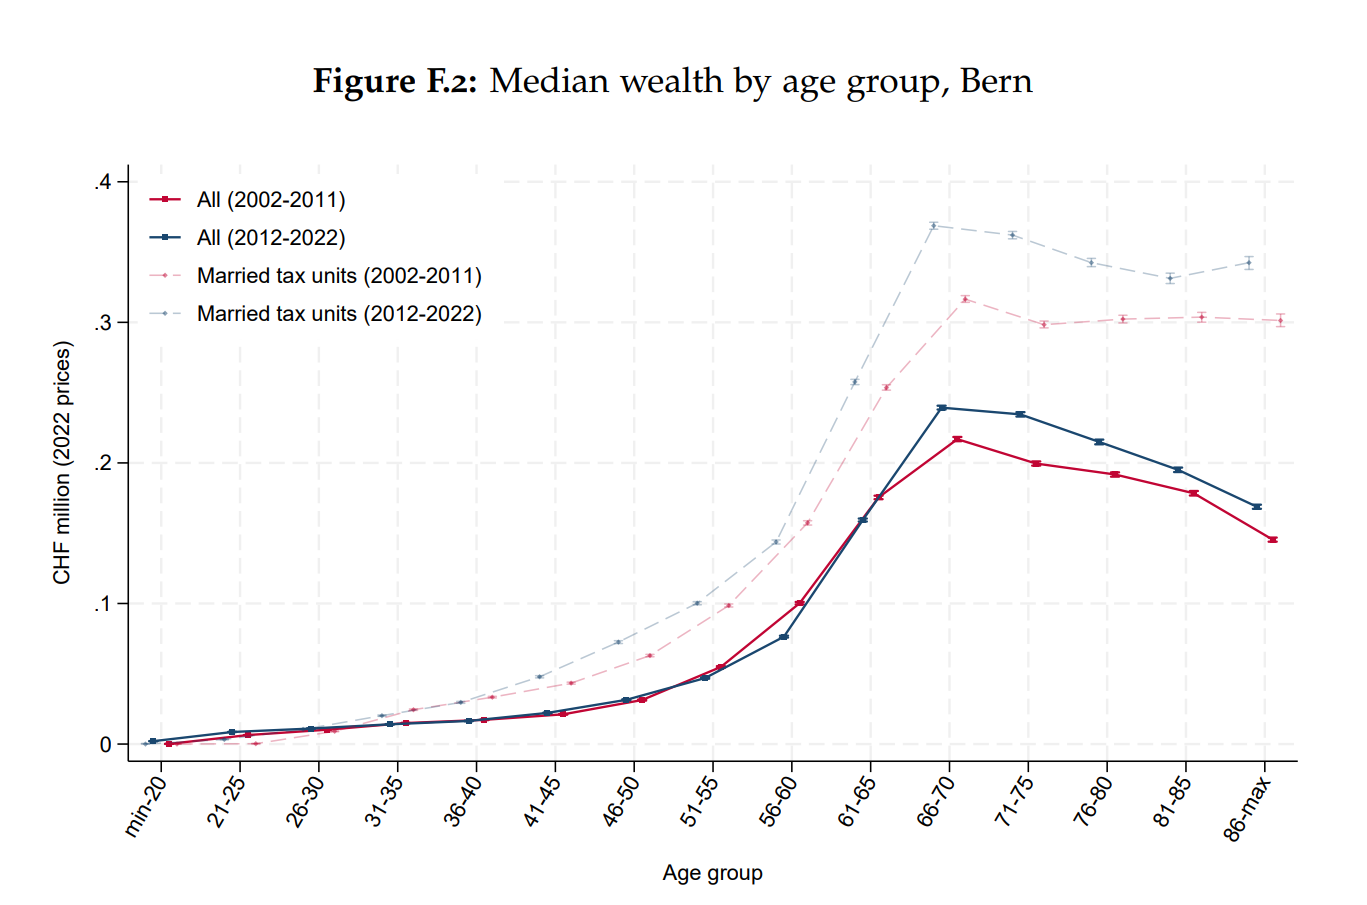
I just found this report that presents an interesting picture of wealth in Switzerland by age group, gender and inheritance. I knew that wealth (and income) increases rapidly with age, but the curve is quite steep. Half of the population aged 56–60 are millionaires.
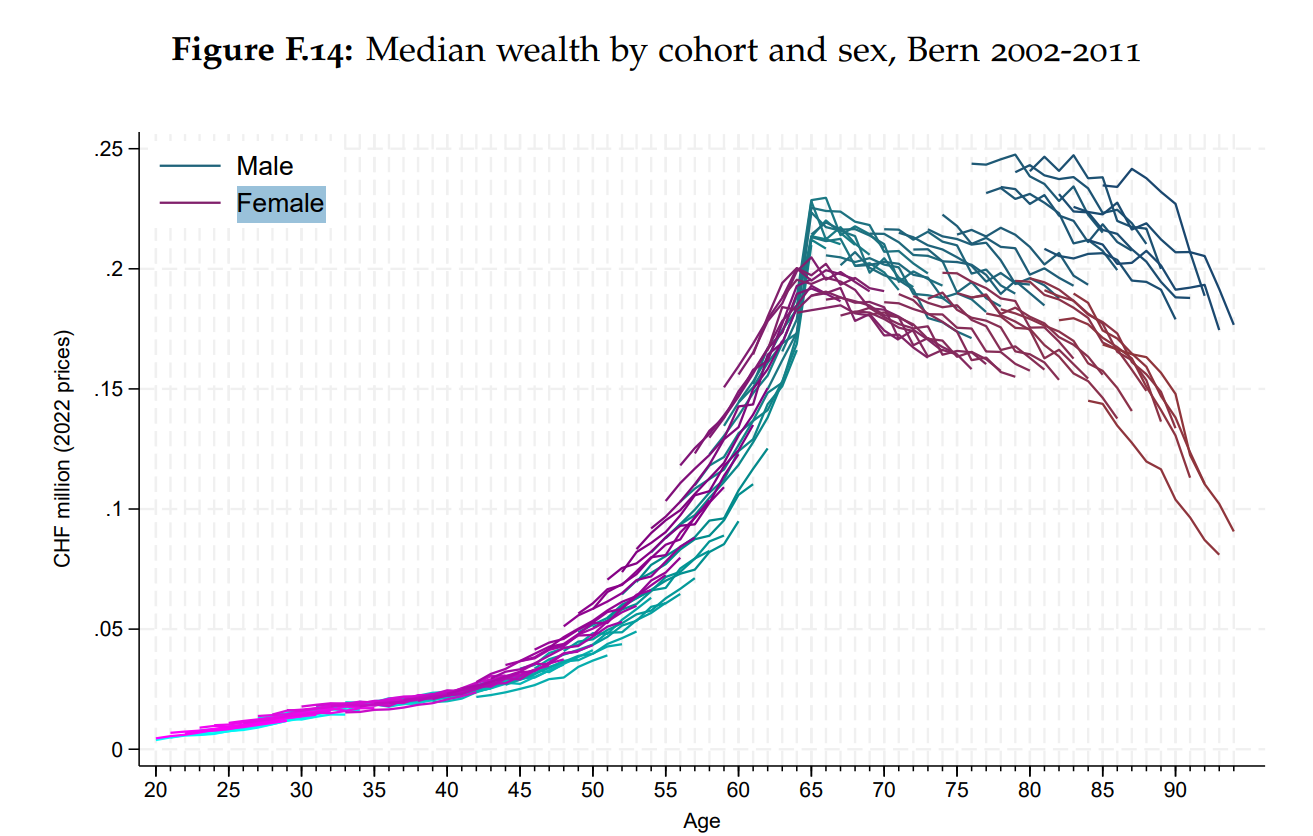
I would be curious to better understand the small but consistent wealth gap between males and females shown in the second graph, which indicates slightly higher wealth among females.
Doesn’t the first chart show that the median is only 100k (.1 million)? Or rather, was 2002-2011, it’s even lower 2012-2022.
They don’t count pillar 2 capital before withdrawal, as far as I can tell. So the rapid increase is likely a combination of pillar 2 withdrawal and inheritances (and maybe people catching up on retirement savings as retirement gets closer and the higher income allows it).
Yeah no pillar 2 or 3 and taxable real estate value…
it’s also based on current age cohorts. One would be unwise to treat this graphic as in any way representative of the future evolution of wealth for someone <40
Hmmm, I misread the graph haha a median of 100K of taxable wealth (excluding 2nd pillar and 3a) at 56 is not as much as I expected. But 1M would have been totally off too… so it makes sense. As they said in the executive summary “Nationwide, millionaires (taxable wealth ≥ CHF 1m) represent 7% of taxpayers but own some 71% of total wealth.”
It is surprisingly low then, at 40yo half of the population has saved barely 20k (mean around 100k)?
Note that they consider taxable wealth. This excludes pension assets like pillar 2 & 3a, which I’d expect to be the majority of financial assets for people around the median, as well undervalues real estate (but doesn’t undervalue mortgages). So if someone is mostly house & pension rich their taxable wealth could be very low (though <= 100k would be running really lean in my opinion, but then again I make enough to not be so constrained)
Sounds about right to me, most of my acquaintances live “paycheck to paycheck” and their savings are mostly 3a (and 2nd pillar) and potentially real estate. With real estate low taxable valuations and mortgage deductibility, the wealth accounted for for real estate is likely to be rather low (in Valais/Wallis at least, might be different in Zürich).
Which is more in line with what I seem to remember from other data.
… Also, how do you come from a mean at 100k to “half of the population has saved barely 20k”? A mean of 100k literally means half of the population has saved less than/up to 100k. ---- sorry, I mixed up mean and median! I guess the median is somewhere in the paper then.
Guess the lower half aren’t as active posters in this forum. While I don’t talk money in real life, the observation from comments is similar to @Wolverine: Lower income households just don’t have the means, and others spend and rely on 2nd and 1st pillar. Or don’t even care yet.
The labeling is confusing. It’s 100k median for all and 20-ish for 40 year olds. Well, why say 20k when you can say 0.02m.
People have more wealth as they get older, and more than previous cohorts at that given age?
For example, a median 40 year old today has more than s/he had at 35 (no surprise). And more than today’s 45 year old did 5 years ago at 40 .
I have the impression that excluding 2nd and 3rd pillar to such an analysis is completely skewing the results. Like, for 40 years a person working is contributing to that pot (and the study doesn’t track it), and then suddenly at 65 it becomes “visible”. Why? Yes, taxes are different but it would give much a cleared view.
Also imagine someone doing large buy-ins to his 2nd pillar every year, they will look “poor” until 65…
I feel the y-axis scale is confusing (isn’t much cleared to write 200k, 300k?).
What about the AI generated (and even a bit sloppy) image in the first page: 3 left hands and the coin melting with the fingers.
Mit dem Lesen und der Teilnahme an diesem Forum bestätigst du, dass du die Forum-Richtlinien gelesen hast und damit einverstanden bist sowie den Haftungsausschluss auf http://www.mustachianpost.com/de/ akzeptierst.