Here, no one should be interested in daily or even yearly phenomena affecting the stock market, but decadal phenomena do deserve some of our attention…
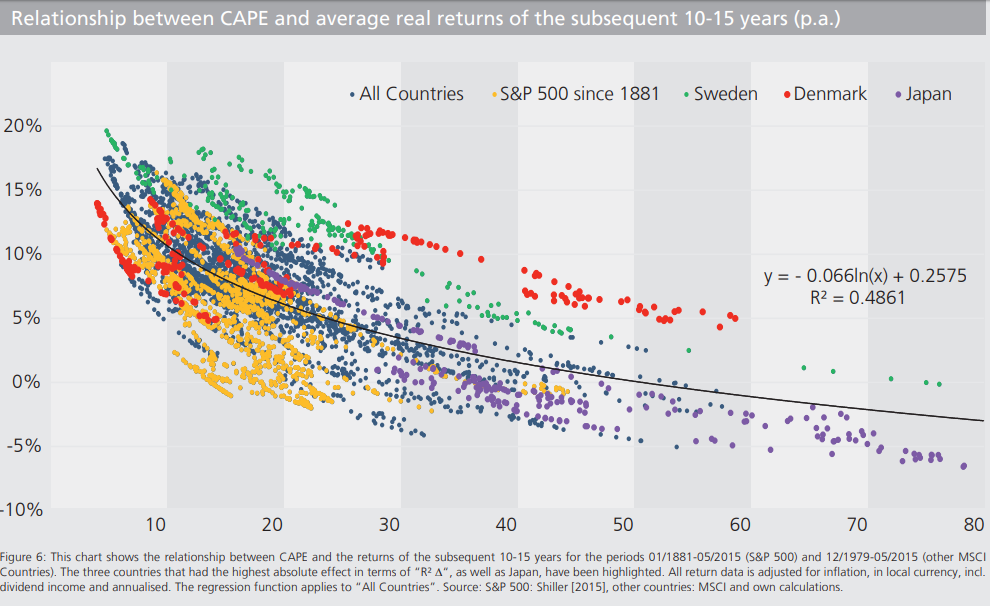
I would suspect many here sometimes get hesitant or nervous when investing large sums of cash, particularly those of us who may have recently had a financial epiphany and are transferring a large amount to equities. The Shiller CAPE ratio is the metric here (basically ratio current price to average earnings over past 10 years). USA is currently at ~30 and Switzerland ~26. For fun, lets take 28 and put it into their regression formula. We get 3.76% real annual return over next 10-15 years. This is quite far short of what most people throw into their projections (typically 5-7%) when planning for FIRE.
Of course, this is only one side of the equation… the more one saves now, the more one will have in the future, regardless of the strategy.
You can have a look at this neat document from Yardeni research:
Some key takeaways:
US and Switzerland are indeed expensive, but not at their peaks
There are some world markets which appear inexpensive as compared to their own averages and global averages
There are several cheap markets, which have been cheap long term due to high political risk, low investor interest (see Russia). They may stay this way so beware.
MSCI World indexes show that what was previously well correlated (US to EAFE) has recently decoupled.
Not to be seen in the linked document, but you will also find out that cheapest markets by P/E ratios pay most dividends. Google for MSCI Nigeria, MSCI Pakistan, MSCI Russia and look inside the PDFs. It’s not totatlly unreasonable to invest there.
Staying out of the market is not an option, therefore two possible courses of action would be:
Invest in MSCI ACWI (or FTSE Global) and let the market sort itself out. It always tends to find the average
Place your bets by reducing exposure to expensive assets, and increasing exposure to underpriced assets. Stay diversified to reduce volatility. Do not totally avoid expensive assets, as they may just as well get twice as much expensive before reverting back to average.
How do you decide which stocks are “expensive”? Based on some commonly known measure, like CAPE? The rest of the World also knows it, and yet the prices are where they are. So I guess you’re just smarter than these suckers . Naah, that’s nothing for an investing noob like me…
Well to sum it up, look at the graph! R2=0.4861 which means for me that the model poorly describes the complexity of the reality.
By reading and partipating to this forum, you confirm you have read and agree with the disclaimer presented on http://www.mustachianpost.com/
En lisant et participant à ce forum, tu confirmes avoir lu et être d'accord avec l'avis de dégagement de responsabilité présenté sur http://www.mustachianpost.com/fr/
Durch das Lesen und die Teilnahme an diesem Forum bestätigst du, dass du den auf http://www.mustachianpost.com/de/ dargestellten Haftungsausschluss gelesen hast und damit einverstanden bist.