So for context my revenu recently increased and what I could deduce decreased … so I got bullied by my canton (NE) with taxes
I know that NE as among the cheapest rent in switzerland but at this point I cannot believe that Neuchâtel is the cheapest canton in Neuchâtel.
Therefore I did some research using a few tools like that beautiful fiscal calculator there : Swiss Tax calculator
That allows you to simulate how much you are going to pay based on your geographical position !
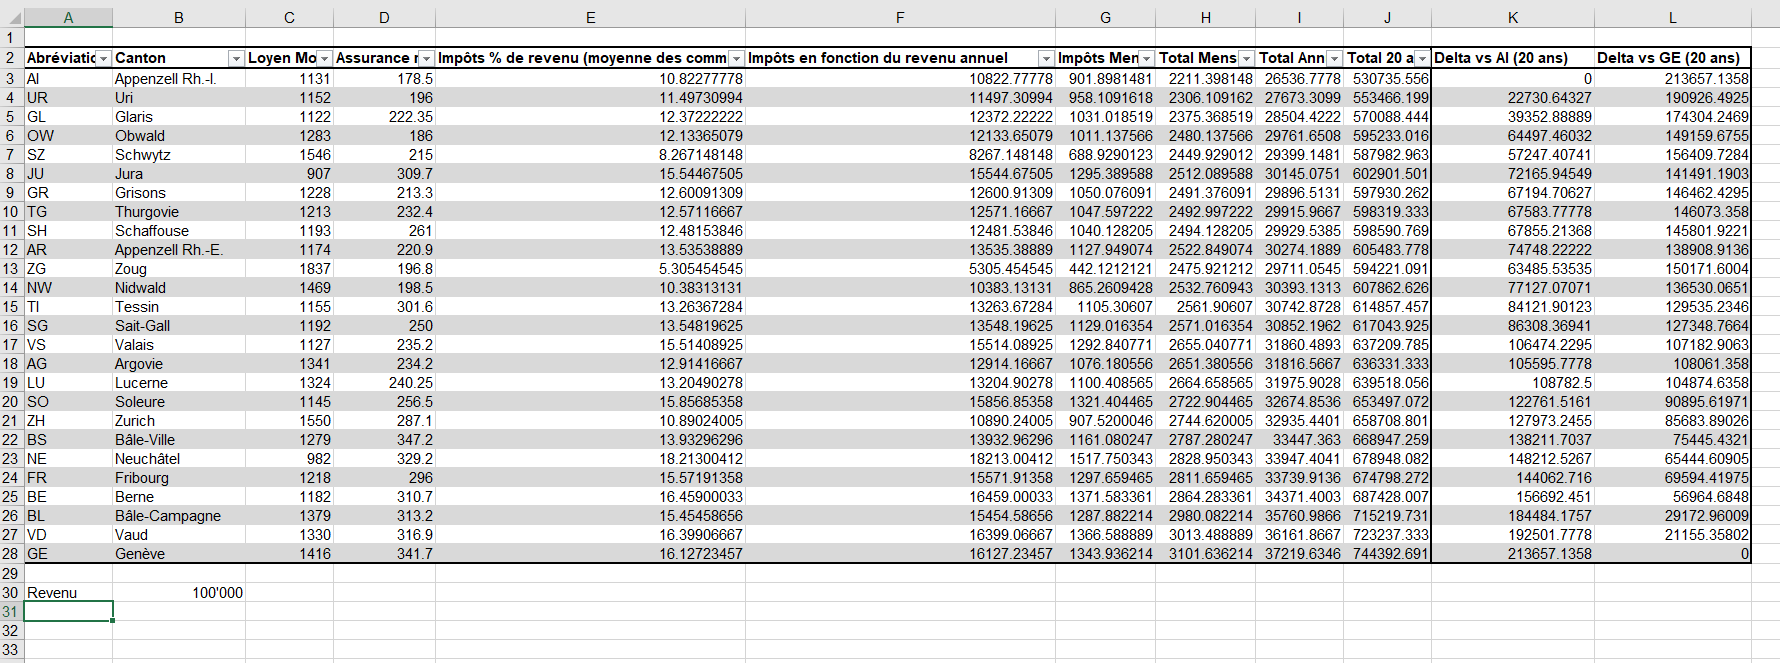
I then put it in an excel table with “average rent price per canton” and “lowest health insurance price per canton”. Summed everything over 12 months and 20 years !
I figured out that living in Appenzel interior will save you 10k a year compared to living in geneva with a revenue of 100k !
Here attached is the raw table. i’m looking to plot it in a more dynamic figure to make it more enjoyable to play with but from now on you can have a look in the raw data. Feel free to contact me so I can send your the raw excel file and you can change your revenue level in cell B30 ! It’s very experimental still …
Looks good. It could help géo tax arbitration.
But hard to do once you are married or you have kids as it will be more difficult to move.
Once you secured a daycare you won’t move before the next 4 years.
You could format the number with round 2 as financial number to be more readable.
You could also include transportation cost, parking, car maintenance vs train ticket subscription to commute to your work place.
Sorry I don’t know why I left so many days witouth connexion lol.
Well I didn’t include train ticket because GA is the same price wherever in switzerland but of course it wouldn’t make sense to live in Appenzel and work in Geneva … (except with a lot of home office and only one or two days a week at office) On the more GA is the sane price wherever in switzerland. You can go down to your local yearly abo if you live in the very same city as you work but then it wouldn’t make sense to move …
Gasoline if you drive is also a function of the distance to the reffinery super cheap in “Crissier” and more expensive in cities out of main axis and far … basically gas is cheaper in Zurich than in “La Chaux-de-Fonds” and is very variable …
Then when it comes to “car maintenance” I guess that if you go to your generic VW/Audi dealership (big brands) price will be harmonized ? Is it ?
I would definitely format the numbers but what would be interesting is to plot a function depending of revenue and have one line for each Canton
Well I wanted to improve it before but here you have a first version.
I really hate google sheets because it has 0 compatibility features with excel, plus i’m currently using my professional computer so every sharing features are blocked.
But the table is quite simple (you’ll find it hereafter)
The first five rows until "impôts % de revenu (moyenne des communes) is raw data you can juste copy and paste it.
The code for next rows are :
“Impôts en fonction du revenu annuel” : =E7/100*$B$30 where $B$30 is the annual revenue at the bottom
“Impôts mensuel” is : =F7/12
“total mensuel” is : C+D+G
Also it’s important to recall that imposition percentage also elvolves with the revenue so plotting it is not straightforward …
Hope it helps and really sorry for the mess ! I’ll share again when it shows nice curves !
Abréviation
Canton
Loyen Moyen
Assurance malaide moyenne
Impôts % de revenu (moyenne des communes)
Impôts en fonction du revenu annuel
Impôts Mensuels
Total Mensuel
Total Annuel
Total 20 ans
Delta vs AI (20 ans)
Delta vs GE (20 ans)
AI
Appenzell Rh.-I.
1131
178.5
10.82277778
10822.77778
901.8981481
2211.398148
26536.77778
530735.5556
0
213657.1358
UR
Uri
1152
196
11.49730994
11497.30994
958.1091618
2306.109162
27673.30994
553466.1988
22730.64327
190926.4925
GL
Glaris
1122
222.35
12.37222222
12372.22222
1031.018519
2375.368519
28504.42222
570088.4444
39352.88889
174304.2469
OW
Obwald
1283
186
12.13365079
12133.65079
1011.137566
2480.137566
29761.65079
595233.0159
64497.46032
149159.6755
SZ
Schwytz
1546
215
8.267148148
8267.148148
688.9290123
2449.929012
29399.14815
587982.963
57247.40741
156409.7284
JU
Jura
907
309.7
15.54467505
15544.67505
1295.389588
2512.089588
30145.07505
602901.501
72165.94549
141491.1903
GR
Grisons
1228
213.3
12.60091309
12600.91309
1050.076091
2491.376091
29896.51309
597930.2618
67194.70627
146462.4295
TG
Thurgovie
1213
232.4
12.57116667
12571.16667
1047.597222
2492.997222
29915.96667
598319.3333
67583.77778
146073.358
SH
Schaffouse
1193
261
12.48153846
12481.53846
1040.128205
2494.128205
29929.53846
598590.7692
67855.21368
145801.9221
AR
Appenzell Rh.-E.
1174
220.9
13.53538889
13535.38889
1127.949074
2522.849074
30274.18889
605483.7778
74748.22222
138908.9136
ZG
Zoug
1837
196.8
5.305454545
5305.454545
442.1212121
2475.921212
29711.05455
594221.0909
63485.53535
150171.6004
NW
Nidwald
1469
198.5
10.38313131
10383.13131
865.2609428
2532.760943
30393.13131
607862.6263
77127.07071
136530.0651
TI
Tessin
1155
301.6
13.26367284
13263.67284
1105.30607
2561.90607
30742.87284
614857.4568
84121.90123
129535.2346
SG
Sait-Gall
1192
250
13.54819625
13548.19625
1129.016354
2571.016354
30852.19625
617043.925
86308.36941
127348.7664
VS
Valais
1127
235.2
15.51408925
15514.08925
1292.840771
2655.040771
31860.48925
637209.7851
106474.2295
107182.9063
AG
Argovie
1341
234.2
12.91416667
12914.16667
1076.180556
2651.380556
31816.56667
636331.3333
105595.7778
108061.358
LU
Lucerne
1324
240.25
13.20490278
13204.90278
1100.408565
2664.658565
31975.90278
639518.0556
108782.5
104874.6358
SO
Soleure
1145
256.5
15.85685358
15856.85358
1321.404465
2722.904465
32674.85358
653497.0717
122761.5161
90895.61971
ZH
Zurich
1550
287.1
10.89024005
10890.24005
907.5200046
2744.620005
32935.44005
658708.8011
127973.2455
85683.89026
BS
Bâle-Ville
1279
347.2
13.93296296
13932.96296
1161.080247
2787.280247
33447.36296
668947.2593
138211.7037
75445.4321
NE
Neuchâtel
982
329.2
18.21300412
18213.00412
1517.750343
2828.950343
33947.40412
678948.0823
148212.5267
65444.60905
FR
Fribourg
1218
296
15.57191358
15571.91358
1297.659465
2811.659465
33739.91358
674798.2716
144062.716
69594.41975
BE
Berne
1182
310.7
16.45900033
16459.00033
1371.583361
2864.283361
34371.40033
687428.0066
156692.451
56964.6848
BL
Bâle-Campagne
1379
313.2
15.45458656
15454.58656
1287.882214
2980.082214
35760.98656
715219.7313
184484.1757
29172.96009
VD
Vaud
1330
316.9
16.39906667
16399.06667
1366.588889
3013.488889
36161.86667
723237.3333
192501.7778
21155.35802
GE
Genève
1416
341.7
16.12723457
16127.23457
1343.936214
3101.636214
37219.63457
744392.6914
213657.1358
0
Revenu (mensuel)
100’000
By reading and partipating to this forum, you confirm you have read and agree with the disclaimer presented on http://www.mustachianpost.com/
En lisant et participant à ce forum, tu confirmes avoir lu et être d'accord avec l'avis de dégagement de responsabilité présenté sur http://www.mustachianpost.com/fr/
Durch das Lesen und die Teilnahme an diesem Forum bestätigst du, dass du den auf http://www.mustachianpost.com/de/ dargestellten Haftungsausschluss gelesen hast und damit einverstanden bist.