Hey !
I’m working on a tool to analyse the evolution of my portfolio on Interactive Brokers, which contains ETF, shares and cash.
As a prototype, I’m writing it in Python programming language, using the Jupyter Notebook framework and some data files in YAML standard. To me the requirements are:
- dynamic computation of the portfolio content (dynamic = updated with the last data for the products),
- manage
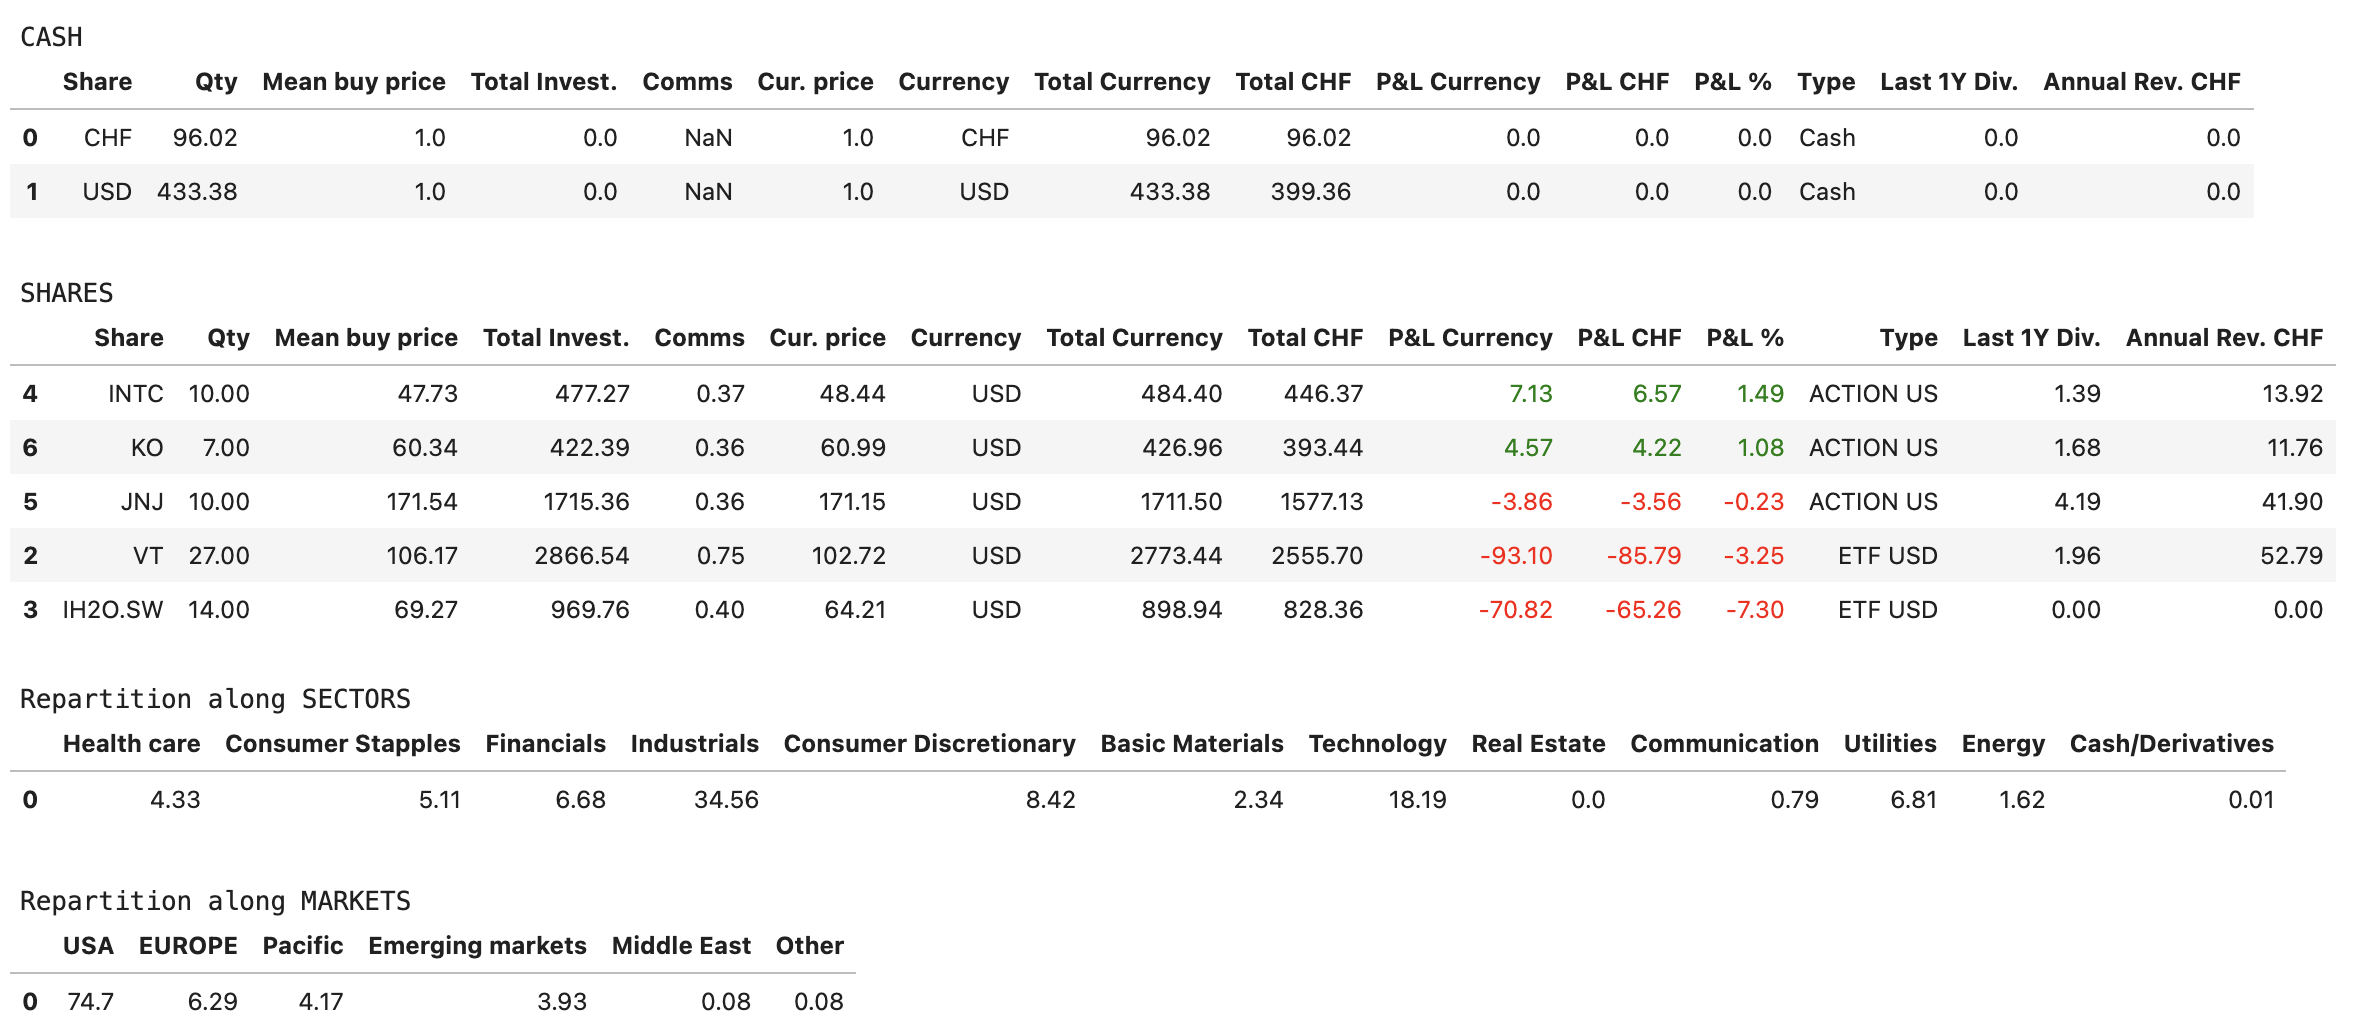
CHF,USDandEUR, - one global view the content as a table with:
- product symbol,
- quantity,
- mean buy price (mean computation if I buy the same product at different times),
- last known value,
- P&L (CHF and %),
- dividende estimate for the year,
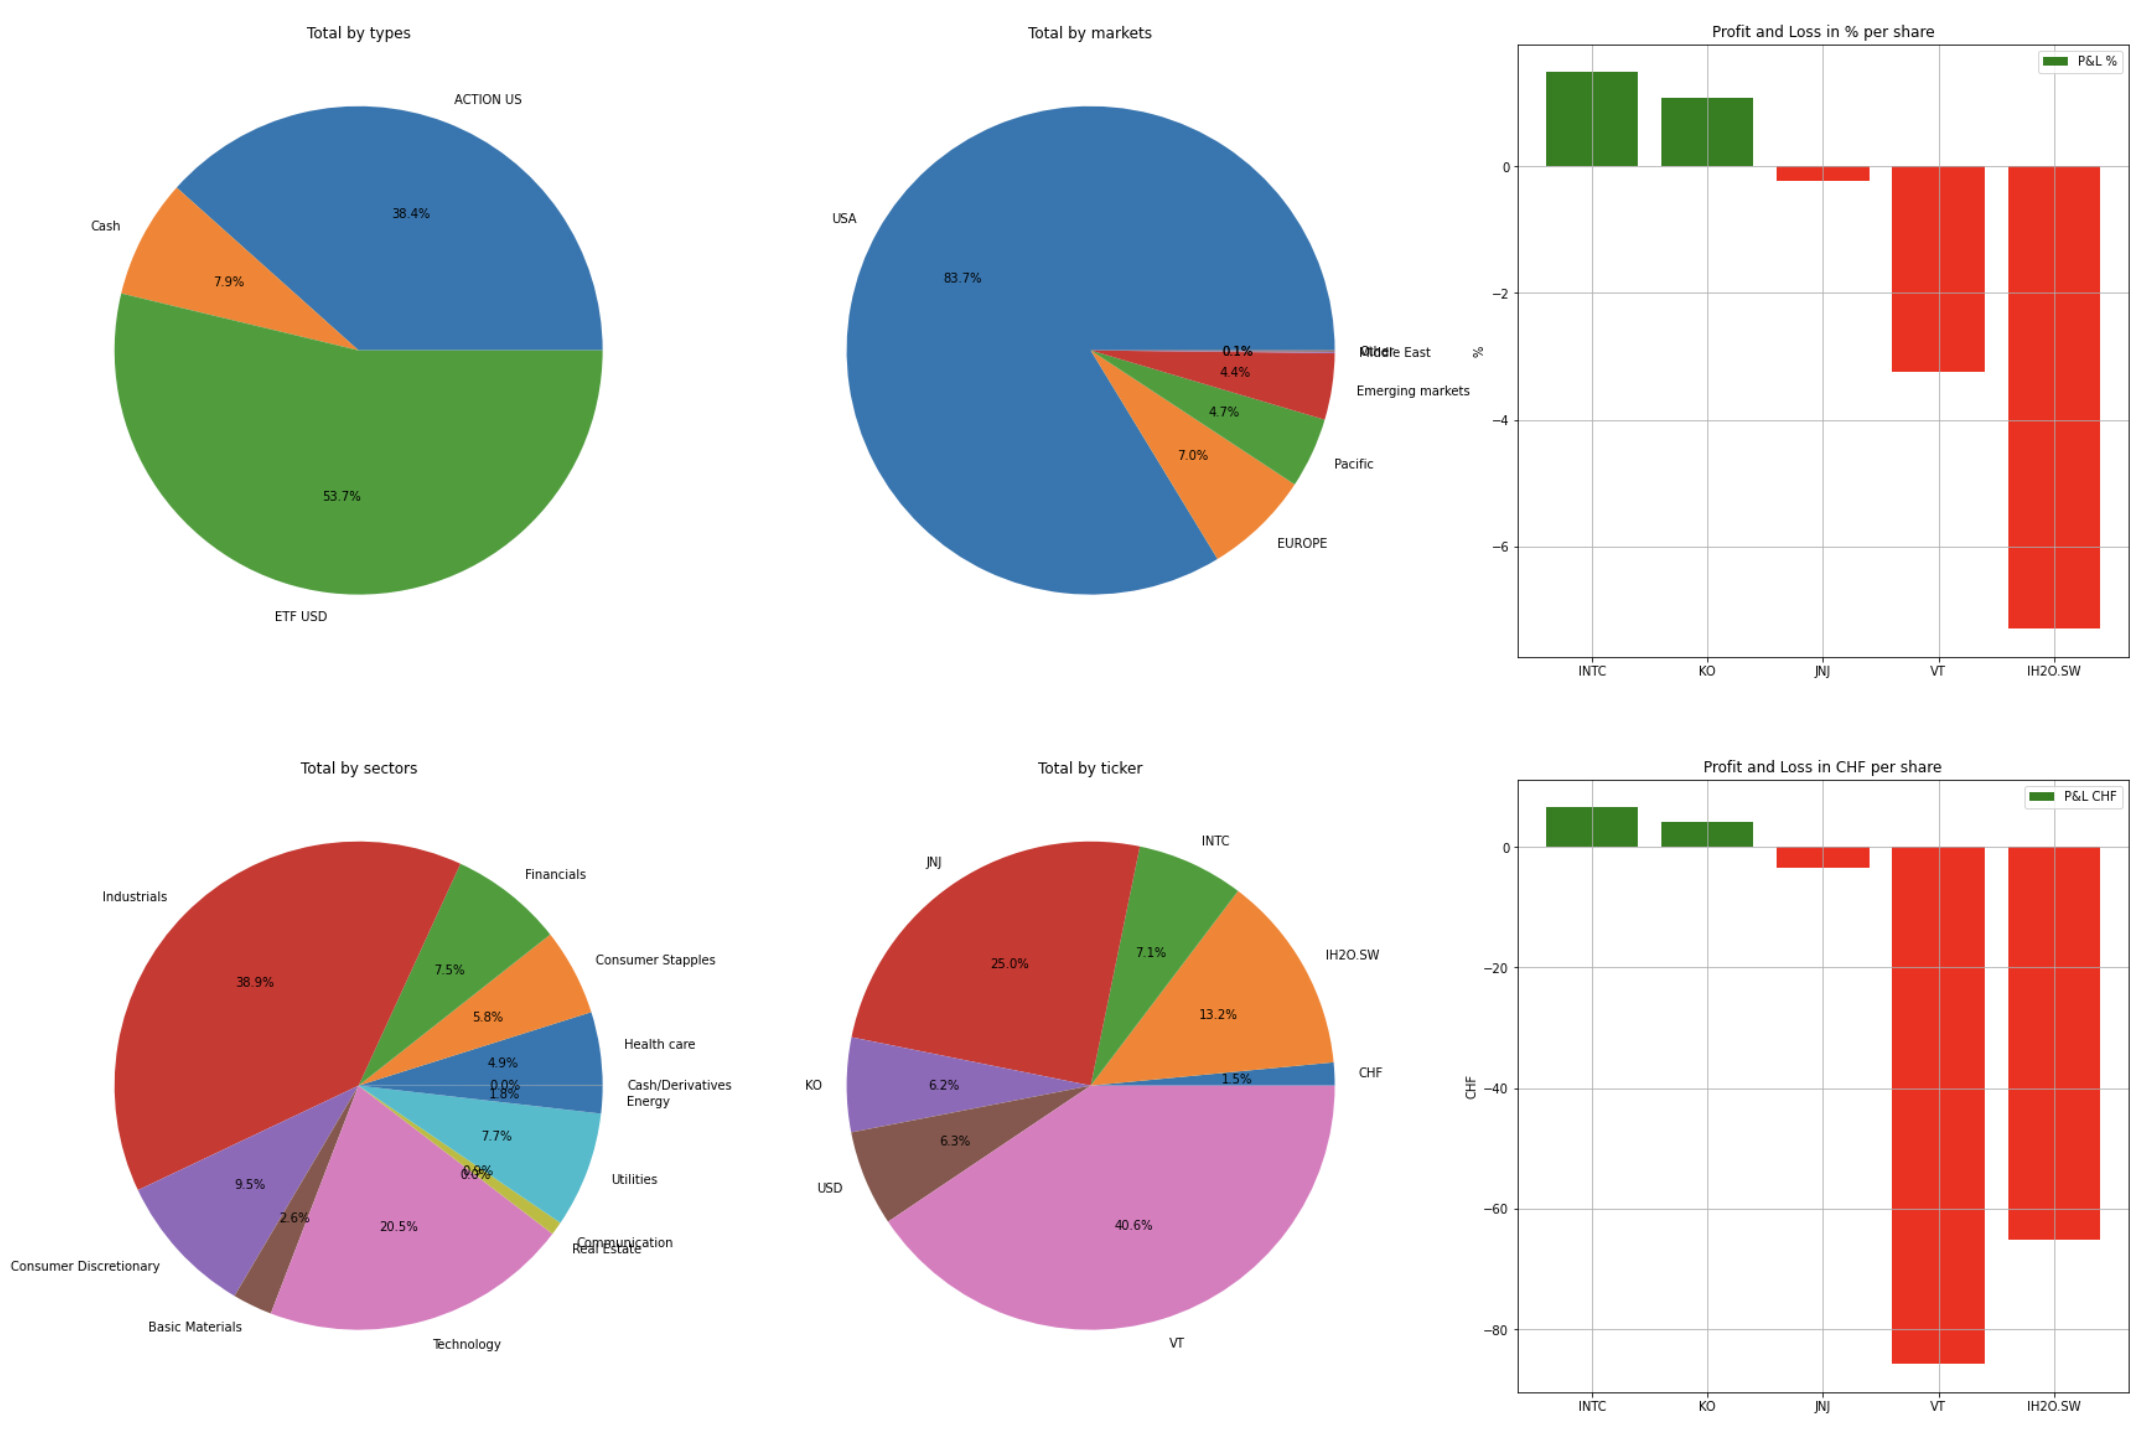
- one detailed pie by ratio (%) with the markets repartition (USA, EUROPE, EMERGING, PACIFIC, MID. EAST),
- one detailed pie by ratio (%) with products types (CASH, ETF, SHARE),
- one detailed pie by ratio (%) with sectors (TECH, FINANCIALS, ENERGY…),
- one detailed pie by ratio (%) of products in the while portfolio),
- a graph of positive/negatives P&L in % and CHF for each product.
To feed the tool, the data to process must be ‘easy’ to setup. I choose a text format (YAML):
- a file for products descriptions (tickers.yaml): it contains the definition of each product (symbol, description, geographic repartition, sectors repartition)
- a file for transactions (transactions.yaml): it contains the list of the whole transactions I have made for the portfolio. It could be:
INSERT_MONEYwhen I move money from by bank account to IB in CHF (qty, date),BUY_CURRENCYto convert CHF to USD (from/to currencies, qty, rate),BUY_SHAREto buy a product (symbol, qty, rate, commission, date).
The technology behind this uses: yahoo finance for dynamic products information, pandas for dataframe manipulation and matplotlib for graphs.
Afterwords, I’m not really convince in the way I manipulate the data and it may be more powerful to setup a real database (SQLite?) to increase the modularity.
Have a look here to view the files (still in development ![]() ). The
). The transaction.yaml contains data for testing.
Example of outputs:
My questions:
- any of you has already think about a kind of tool ?
- do you already use something DIY or on the shelf ?
- any constructive comment ?
Thank you for your attention.
πR