Big picture:

Although not nice to buy in 1929, nearly a 20yr wait to break even! I hope we are not in a similar place right now ![]()
Big picture:
Although not nice to buy in 1929, nearly a 20yr wait to break even! I hope we are not in a similar place right now ![]()
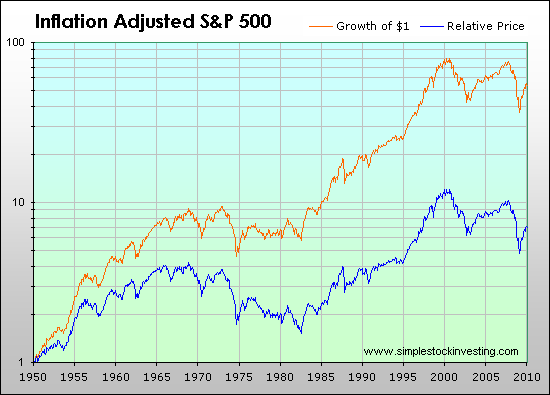
Whenever looking at performance chart, it should have two things factored in:
And it’s also nice if it’s logarithmic. Your chart is missing the dividends (or both?).
This site has the right chart:
If you think 1929 was awful, what do can you say about 1968-1984? It wouldn’t seem like such a bad period, but inflation was just terrible!
Thanks. Do you have a preferred tool to check inflation rates?