Thanks.
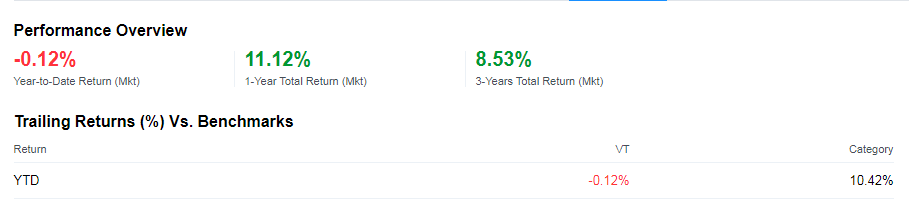
The negative one has been fix for a while, so it’s weird imho.
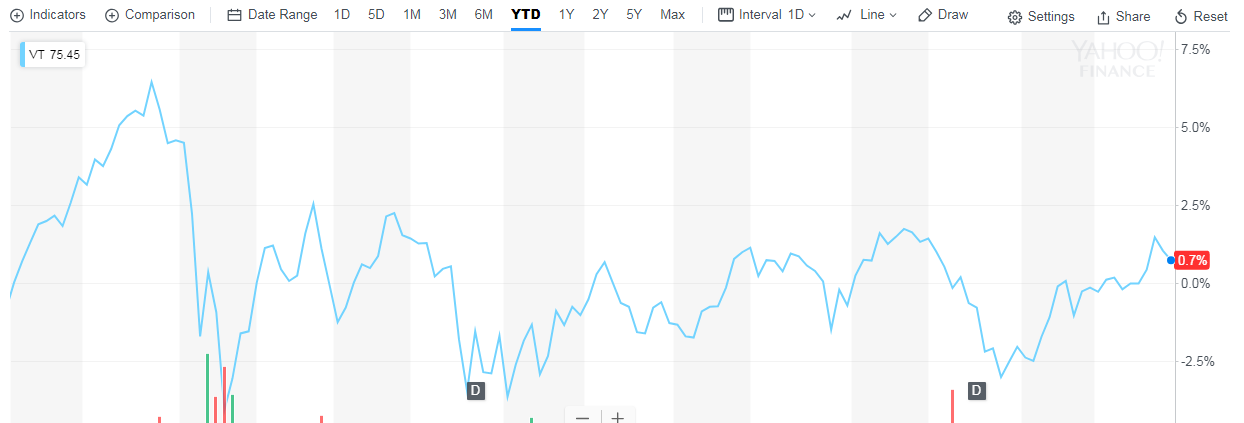
YTD should mean “today” (or yesterday evening ), so I suppose should be very similar if not the same in both cases.
My calculation is none of the above. I just check them for fun and don’t use them for my decisions at all.
Well if i compare Open price at beginning of the year = 74.55 and close price last friday = 75.45, I get a 1.2% YTD performance, without dividends.
By reading and partipating to this forum, you confirm you have read and agree with the disclaimer presented on http://www.mustachianpost.com/
En lisant et participant à ce forum, tu confirmes avoir lu et être d'accord avec l'avis de dégagement de responsabilité présenté sur http://www.mustachianpost.com/fr/
Durch das Lesen und die Teilnahme an diesem Forum bestätigst du, dass du den auf http://www.mustachianpost.com/de/ dargestellten Haftungsausschluss gelesen hast und damit einverstanden bist.