We are all interested to see how other people earn and spend their money. The numbers can’t get more representative than this. So, the average Swiss household of 2.12 persons earned CHF 9,800 and spent CHF 8,100 per month in 2020.
Some interesting insight into changing spending patterns of Swiss households throughout the Covid-19 pandemic.
Tracking and sharing our expenses on this forum, we might look into the categories of the official statistics for ease of comparison. Here they are:
Mandatory transfer expenses
Social security contributions
Taxes
Health insurance funds: Premiums for basic insurance
Other insurance, fees and transfers
Health insurance funds: Premiums for supplementary insurance
Other insurance premiums
Fees
Donations, gifts and invitations
Consumer spending
Food and non-alcoholic beverages
Alcoholic beverages and tobacco products
Hospitality and lodging (aka restaurants and holidays)
I find it particularly interesting that premiums for basic health insurance are listed as mandatory transfer expenses, just as social security contributions (1st/2nd pillar) and taxes. This might change the way I will calculate my savings rate, i.e. not treat the premiums as expenditure but as a reduction of income.
Keep in mind that, unlike pillars 1 and 2 and taxes, health insurance premiums are not really income-dependent. While there are premium reductions for people with a low income, this does not apply to people that retire early (disqualified due to net worth). I.e. it will remain a fixed cost even after (early) retirement, and premiums possibly increasing faster than overall inflation.
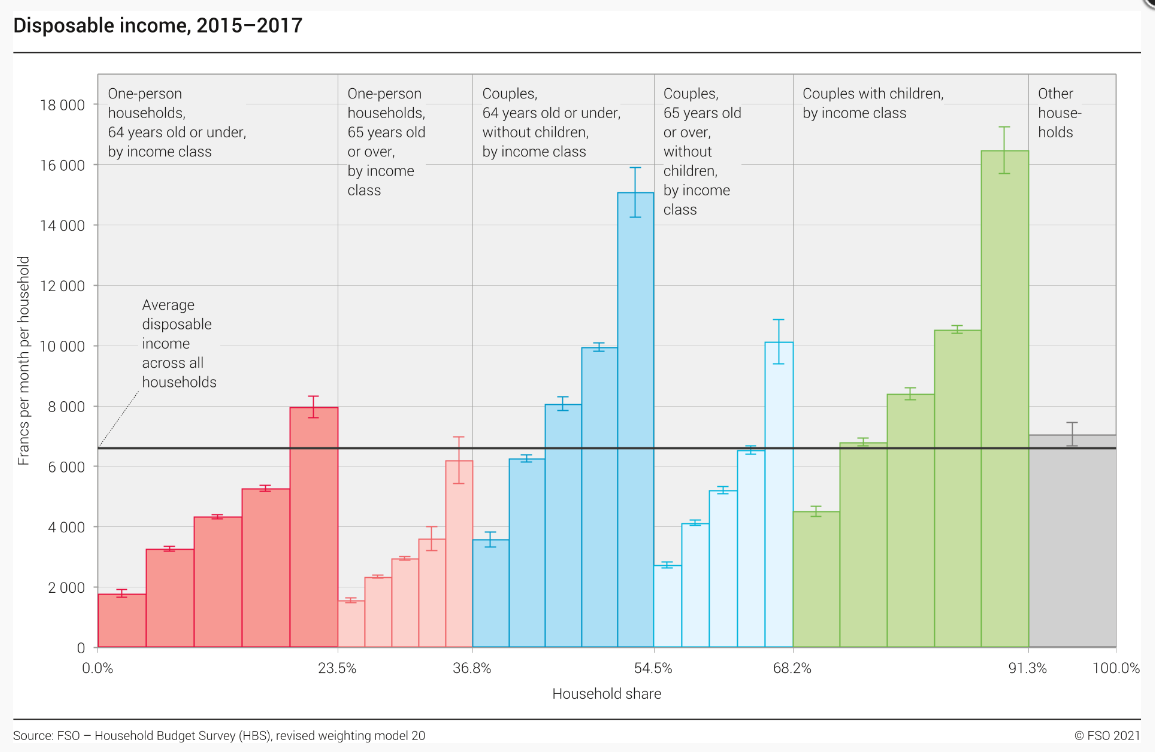
Any idea where I could find median numbers, broken down by type of household (e.g., no children 1, child, 2 children ,etc.)? I searched a bit in the Federal Statistical Office website without luck.
Thanks, I did see that graph but at first sight I didn’t understand it. Now I think I get it: it means e.g., that couples with (any number of) children represent 23.1% (91.3-68.2) of the population. Each category is then broken down into 5 classes of income, then the mean + variance is shown for each class, so the 20% richest couples with children earn on average a bit more than 16K CHF after taxes.
What I was looking for though was stats on expenditure, i.e., disposable income minus savings.
Mit dem Lesen und der Teilnahme an diesem Forum bestätigst du, dass du die Forum-Richtlinien gelesen hast und damit einverstanden bist sowie den Haftungsausschluss auf http://www.mustachianpost.com/de/ akzeptierst.