Hello,
Could you explain to me what “Total return gross” means on this etf and why in the technical information they talk about “SMI” and sometimes “SMIC”.
And when I compare a chart of the SMI to this ETF, the ETF performs much better for what reason?
I also found this ETF with accumulation: LU0943504760 what do you think?
2 Likes
Could you point to the ISIN of the first ETF you’re speaking of?
Edit:
To start answering your questions: the SMI is the cap weighted price returns index (without dividends) of the 20 largest swiss companies by market cap, the SMIC is the cap weighted total returns index (with dividends reinvested) of these same companies.
An accumulatig fund (with dividends reinvested) compared to a price returns index would widely outperform it because of the dividends that are not counted in the index. The proper benchmark for your fund would be the total returns version of the index it tracks. You could probably use the SMIC as a rough substitute if you need a more readily available one.
Edit 2:
What are you searching to achieve (goals, allocation, type of returns, etc.)?
1 Like
Hello thanks for your answer,
ISIN of the first ETF is : CH0017142719
Okay now I understand better.
But then the etf (CH0017142719) is distributing but the chart looks more like the SMIC and not SMI is what I do not understand.
Here the SMI :
Here the SMIC :
And here the chart from the ETF looks like the SMIC why ? :
What am I searching : I try to understand the different types of Swiss ETFs before investing and also because I am curious and want to learn more about finance.
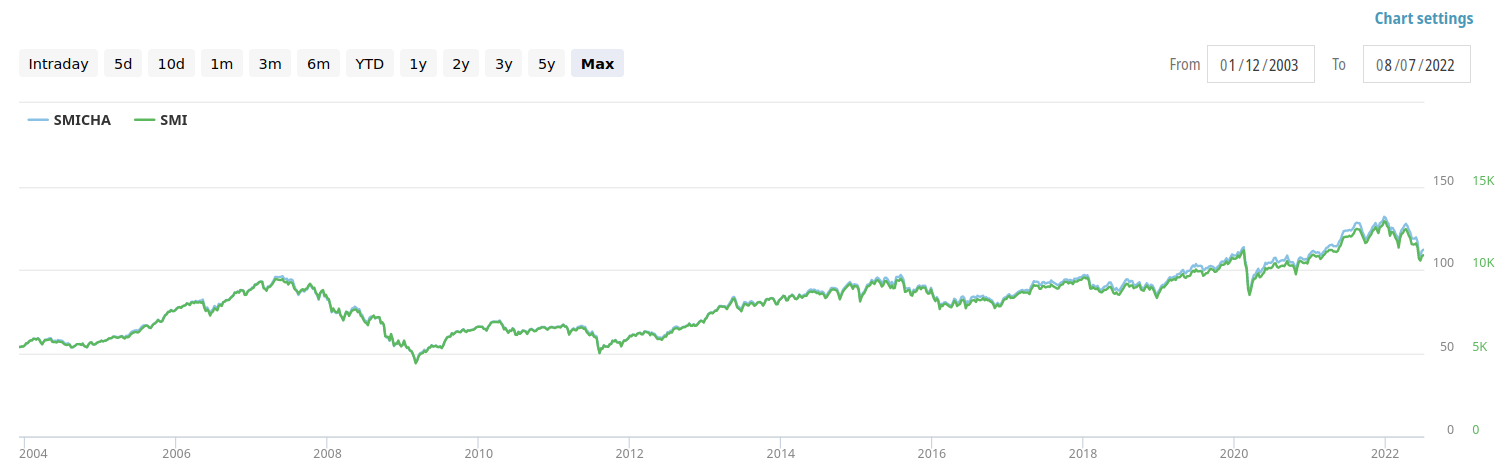
I’m not sure you’re comparing apples to apples, the chart UBS displays on their fund information page seems to take into account reinvesting dividends. The Six viewer comparing SMICHA to the SMI index gives me that:
Seems pretty similar to the SMI to me.
1 Like
Neither the SMI nor the SPI index are very diversified. SMICHA (CH0017142719), the fund you’ve pointed to, holds close to 19% of Nestlé, 19% of Roche and 18% of Novartis. SPICHA (CH0131872431), the SPI tracking UBS ETF, holds roughly 21% of Nestlé, 15% of Roche and 13% of Novartis.
One solution is to add into the mix a mid/small cap fund tracking, for example, the SPI Extra or the SMIM index. An alternative, that can be combined with it, would be to use a fund tracking the SLI index, that caps the 4 largest stocks at 9% and the others at 4.5%.
I’d ask myself why I want to invest in Swiss companies and if I want to use a Swiss fund provider for that. There are reasons for it but those matter in order to choose the right solution for you, and adding more broad diversification with more global funds (which might be what you are doing already) might be interesting for you too, depending on your goals and self-imposed restrictions.
All in all, I personally don’t find any compelling reason to invest in a fund tracking the SMI. 20 stocks is easy enough to replicate without having to pay the fund’s fees, though it takes a tiny bit more time (rebalancing at the intervals you choose) and will have more tracking errors. That’s roughly what I’m doing for my stocks in taxable.