Actually it might be best if such a chart is plotted for earnings as well. That might help understand how much of this is valuation driven vs. earnings driven
3 Likes

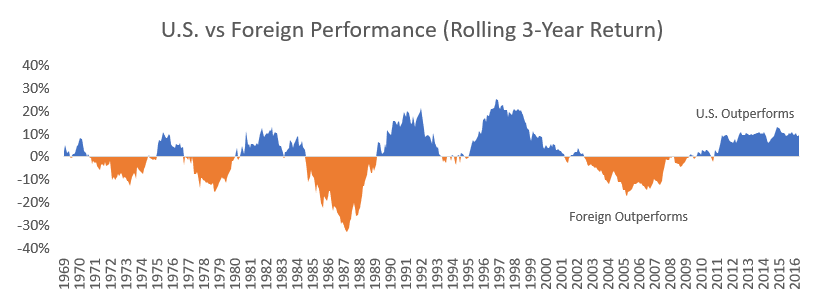
As stated by others, that is the result starting 2008.
A longer view has US and ex-US returns oscillate through periods of time:
8 Likes
I barely cannot imagine, that the rest of the world (as the author probably means by „RoW“) will putperform the US:
- Europe is basically dead, see former leader Germany.
- Africa: I do not know much about Africa, but when checking the charts, it‘s a nice roller coaster.
- Sout America: did underperform, see charts.
- Middle East: don‘t see growth there, tbh.
- Southeast Asia: okayish
- China: only competitor, I see realistic. But in my opinion, China is just like an bipolar, market-manipulating clown. I will invest as less as possible in this country. When checking the China A shares chart for iShares ETF, the performance was not that good.
The music still plays in the US and it will remain for a longer time, in my opinion.
International companies want to be listed at an US stock exchange. But what I am expecting is a lesser steep growth.
1 Like
That’s all priced in, already ![]()
Historical thesis: Japan will outpace the West and end US dominance
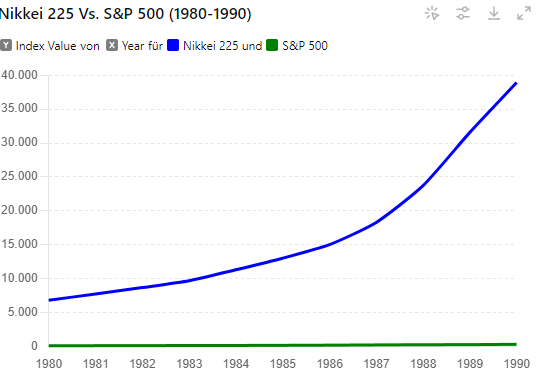
Or is it China?

edit: Another look at the US excluding FAANG Magnificent Seven. Likely no coincidence these are all US companies, though.
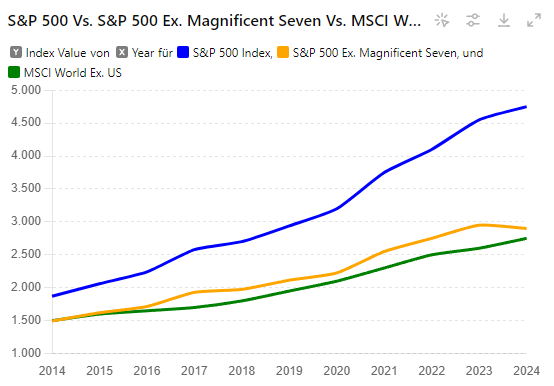
(charts at the courtesy of ChatGTP. No guarantee, but look plausibel enough)
1 Like
I think you are right but you are missing one element.
If the price of the asset is already expecting what you mentioned in your comment; then US cannot outperform. To outperform , US companies need to achieve more than expected performance
I am not saying it’s not possible. I am just saying that is where outperformance comes from.
For example -: if NVDA is priced at 58 times PE then it’s expected that it grows much faster than many companies. But as an investor if you buy stock today , then for you to make any profit (higher than market average) with NVDA, NVDA need to exceed expectations. Or else you will most likely have same return as any other company.
One interesting example
Abercrombie and Fitch was considered dead 5 years back. Google, Apple, Amazon were considered awesome. And this was more or less correct assessment at that time.
In last 5 years ANF has outperformed all three companies. Because ANF had a turnaround story
ANF -: 854%
AMZN -: 122%
Googl-; 167%
APPL -: 297%
3 Likes
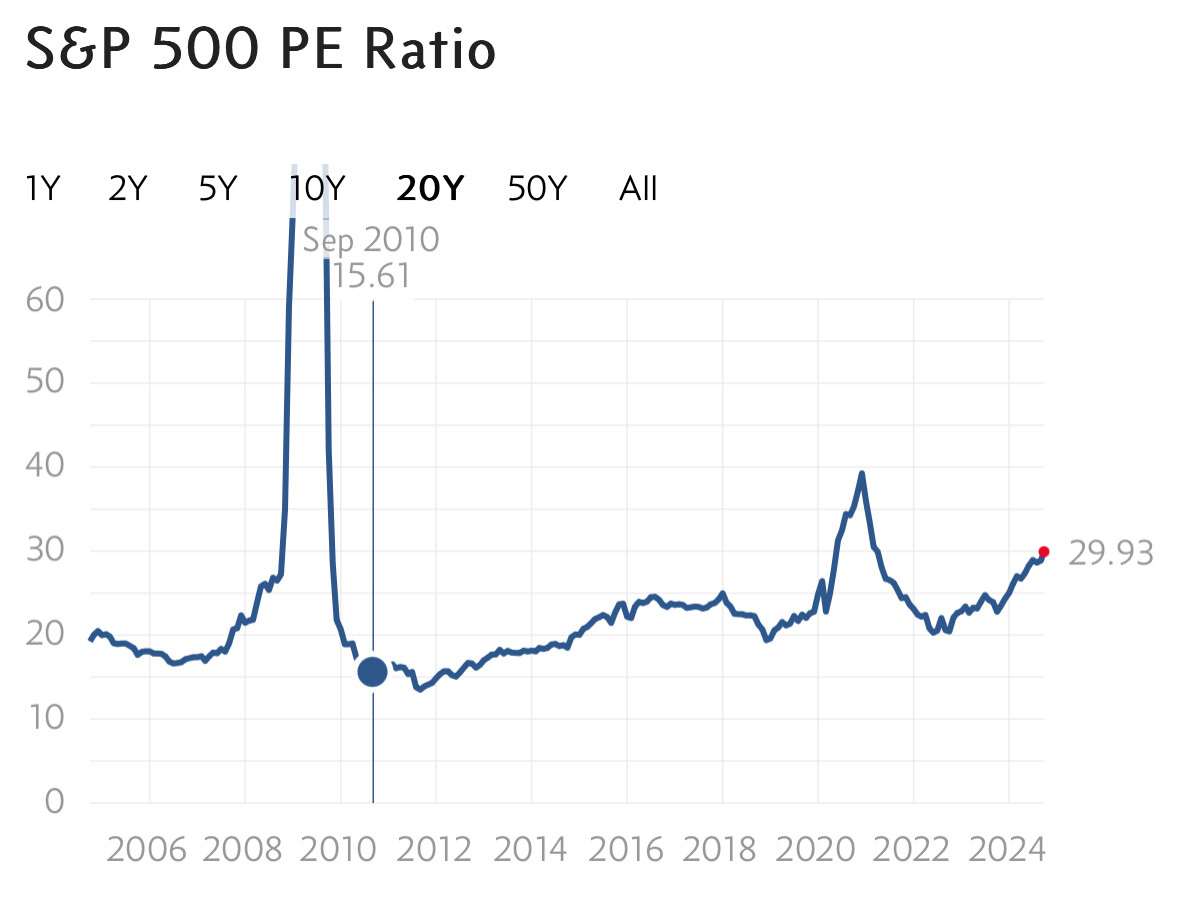
Is Shiller CAPE a right metric when we are talking about future? Shouldn’t a metric which is forward looking be considered
I think something like Forward PEG ratios which includes 5 years of forecasted earnings
Exactly. The whole point why I find geographic division, except of maybe Developed vs. Emerging, a rather artificial construct. It’s good to do tax optimization, otherwise there’s not much in it. “American” companies earn all over the world, Swiss companies earn in US, …
4 Likes
Shiller cape is normally the go-to metric . Although there is argument that it’s not as good anymore today. Also buybacks play a role, that it does not reflect as much. It was also mainly to show how the returns came from multiple expansion and it’s the trend of the line that is important. It ha sbeen going up for over a decade, this trend also cant go on forever
Eanrings forecasts are not as reliable, and very unreliable for anything more than a year in the future.
This is unfortunately a common fallacy. There have been studies (I try to dig them up later) on stock price movements in relation to domicile. Those came to the conclusion that stocks still are very correlated to the country they are listed and located in, regardless of how international their revenues are.
I wonder sometimes how much recent overperformance of US stocks is caused by the self-directed retirement saving in US, because they tend to overweight or invest exclusively in US stocks. And how large are these investment and if they actually make any difference. I know that Vanguard Fidelity BlackRock have huge AuMs, but how does it compares globally?
1 Like
I’ve heard this described as “the relentless bid”*, i.e. the constant flow of money into 401k or IRAs.
Don’t have any numbers, either, but it must be a huge sum given the size of the US employment force and how developed it is.
* On a podcast on active vs passive with Barry Ritholtz and Mike Green.
Is this “relentless bid” expected to decrease in the coming years as the baby boomer generation retires then? I guess there must be some decent estimates of how much of this purchase flow will decrease somewhere online.
Side note: if the US stock market is effectively driven by retirement savings / withdrawal, it’s funny to think that the US market could be in the same situation as the all the problematic European pensions. i.e. maybe things seem ok now that there are more people saving for retirement than withdrawing, but once that reverses there might be a big drawdown over a decade or so.
(There are many reasons why the us stock market is not like European pensions, it’s just a thought experiment)
I also read how European economists are pissed off with European population because they don’t invest and European companies have more difficulties to get capital from the capital markets. If they would invest a significant amount of their savings, they would overweight European stocks.
This is a case when population doesn’t cooperate.
1 Like
This is a report which talks about some of these numbers
Old data but still helpful hopefully
Who owns stocks
2 Likes
Which is no surprise.
In most european countries people don‘t have much disposable income.
Also investing is basically not incentivized at all.
Imagine having 50% taxes/deductions and then investing from your net and the stuff you invest is then not even tax free.
There are basically no 3a type of investments in europe. Of course most don‘t invest anything.
I think it’s not just pension funds. We need to think of all passive funds.
As per Harvard paper, 33% of US stocks are owned by passive owners (directly or indirectly). Since these investors tend to be buy and hold, this gives continuous supply of funds “no questions asked about earnings etc”
So I think we can say as long as economy keeps growing in US and passive funds would have net inflows every year, the supply of money would continue.
I know that pension funds can be both active or passive. But I think in addition to continuous supply of money, the no questions asked money is also helping in keeping valuations high.
2 Likes
But Euro area pension funds have approx 3.3 trillion in assets. Euro area pension funds
To drive general population towards equities. It’s not just incentives but also returns that drive behaviors. For example in India, post covid the bull run has attracted so many retail investors that is fueling the growth and even more retail investors want to start systematic investment plans.
If European stocks can get some sort of sustained rally, this can change a bit the situation. Perhaps that would increase home bias too. For time being everyone thinks US outperforms so why not have higher US exposure
1 Like
But which passive funds, global or US-only? What I am saying is that US people actively overweight passive funds on US stocks ![]() .
.
Great report, thanks for linking it!
The demographics in the US is much healthier than in many other places. I don’t expect the relentless bid to decrease just because the baby boomers are going into retirement.
And even if they invest, they might prefer to invest in the US …
I recently started looking at French companies (e.g. BNP Paripas or Vinci SA). Checking out for all of Goofy’s metrics, but … dividends are taxed at source and it’s super bureaucratic to get them back. I decided not to bother.
The US are just investor friendly which also attracts capital.
Even active funds are most of the time* “hugging an index”, i.e. they have some index as a benchmark, can deviate 0.x% from the index allocation and have some (typically tiny) max cash allowance.
Meaning, they’ll mostly also just buy the index with some minor (e.g. factor driven) deviations between stock x and stock y in said index.
* Maybe with the exception of hedge funds.
2 Likes
Ahh. Only data I found is that Equity funds in US have exposure to US stocks = 74% and rest to international stocks
1 Like