justETF has a graph (in an article). Apparently, full recovery from the crash, inflation adjusted with dividends reinvested, happened in 2020 (it took 31 years). Investors in the Nikkei225 experienced ups and downs until 2012-13. Psychologically, it must have been very hard.
2 Likes
Having someone investing all the equity allocation of his portfolio at the peak and not continuing to invest his savings for the following 31 years must be very rare.
Most of the investors must have continued to purchase the Japanese market in this downturn…
2 Likes
Just in time for Covid! 
1 Like
Absolutely. Nobody invests everything exactly at the peak and nothing before or after.
The 31 years until recovery for Japan is just an interesting fact I was curious about. Some here seem to think I was trying to say or imply something with this, about expected returns, timing the market or something else, I dunno 
Sure!
They went through this:
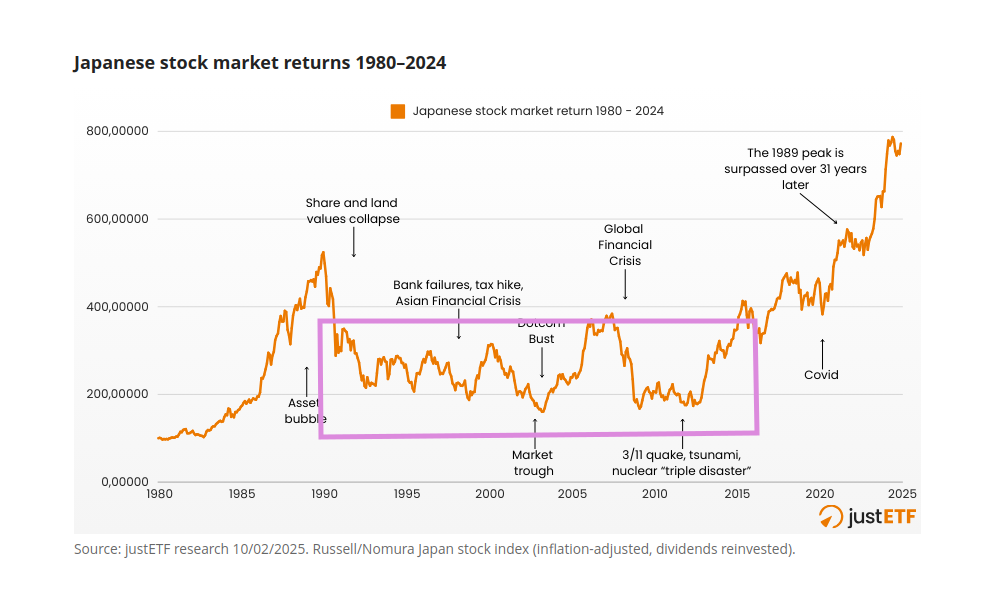
After the third or fourth time you’re back down everytime the stock market seems to go up, I’d guess you’re somehow loosing faith that it’s going to actually recover. Stocks are risky assets. Hopefully they diversified.
Actually, it’s the spiky recovery that pushed it above the threshold.
3 Likes
I think we also need to keep in mind that someone (at least majority of people) experiencing a 50% crash would definitely be vary to put more money in the market. Specially during the old times.
Japan stock market crash together with its real estate crash destroyed the economy and also caused more problems in society. People who graduated during those days couldn’t find good jobs and eventually also were not considered marriage worthy which added more problems to birth rates.
nowadays there is enough information and belief that every dip will always eventually recover. So this time a crash might have a faster recovery too due to continuous money flow and passive investments. But I hope we don’t have to face such crash  because it would definitely not be fun
30 years is a long time specially when you don’t know it’s going to be 30 years 
3 Likes
Your brokerage account won’t show the difference between new savings invested and profits/losses. So it should not be that hard.
If you had 2000 usd invested at peak then purchasing extra 500 usd of etf every month.
It will most likely look like that:
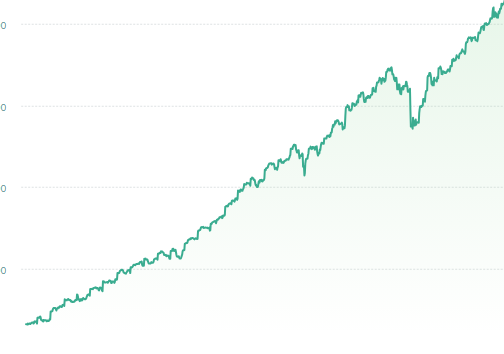
Let’s see at the next big recession how we can cope with it.
1 Like
Not only that, they might be forced to take money out. Imagine, the economy crashes, you lose your job, you can’t find a new one, you use up savings to pay for stuff and soon, start to sell down your stocks at crashed values to pay for groceries.
Most people do not have massive savings and investments. In an economic stress, they will be forced to dip into what they have and perhaps liquidate their 401ks etc.
In Switzerland, we are lucky to have a reasonably long unemployment insurance which helps to shield in the short term.
1 Like
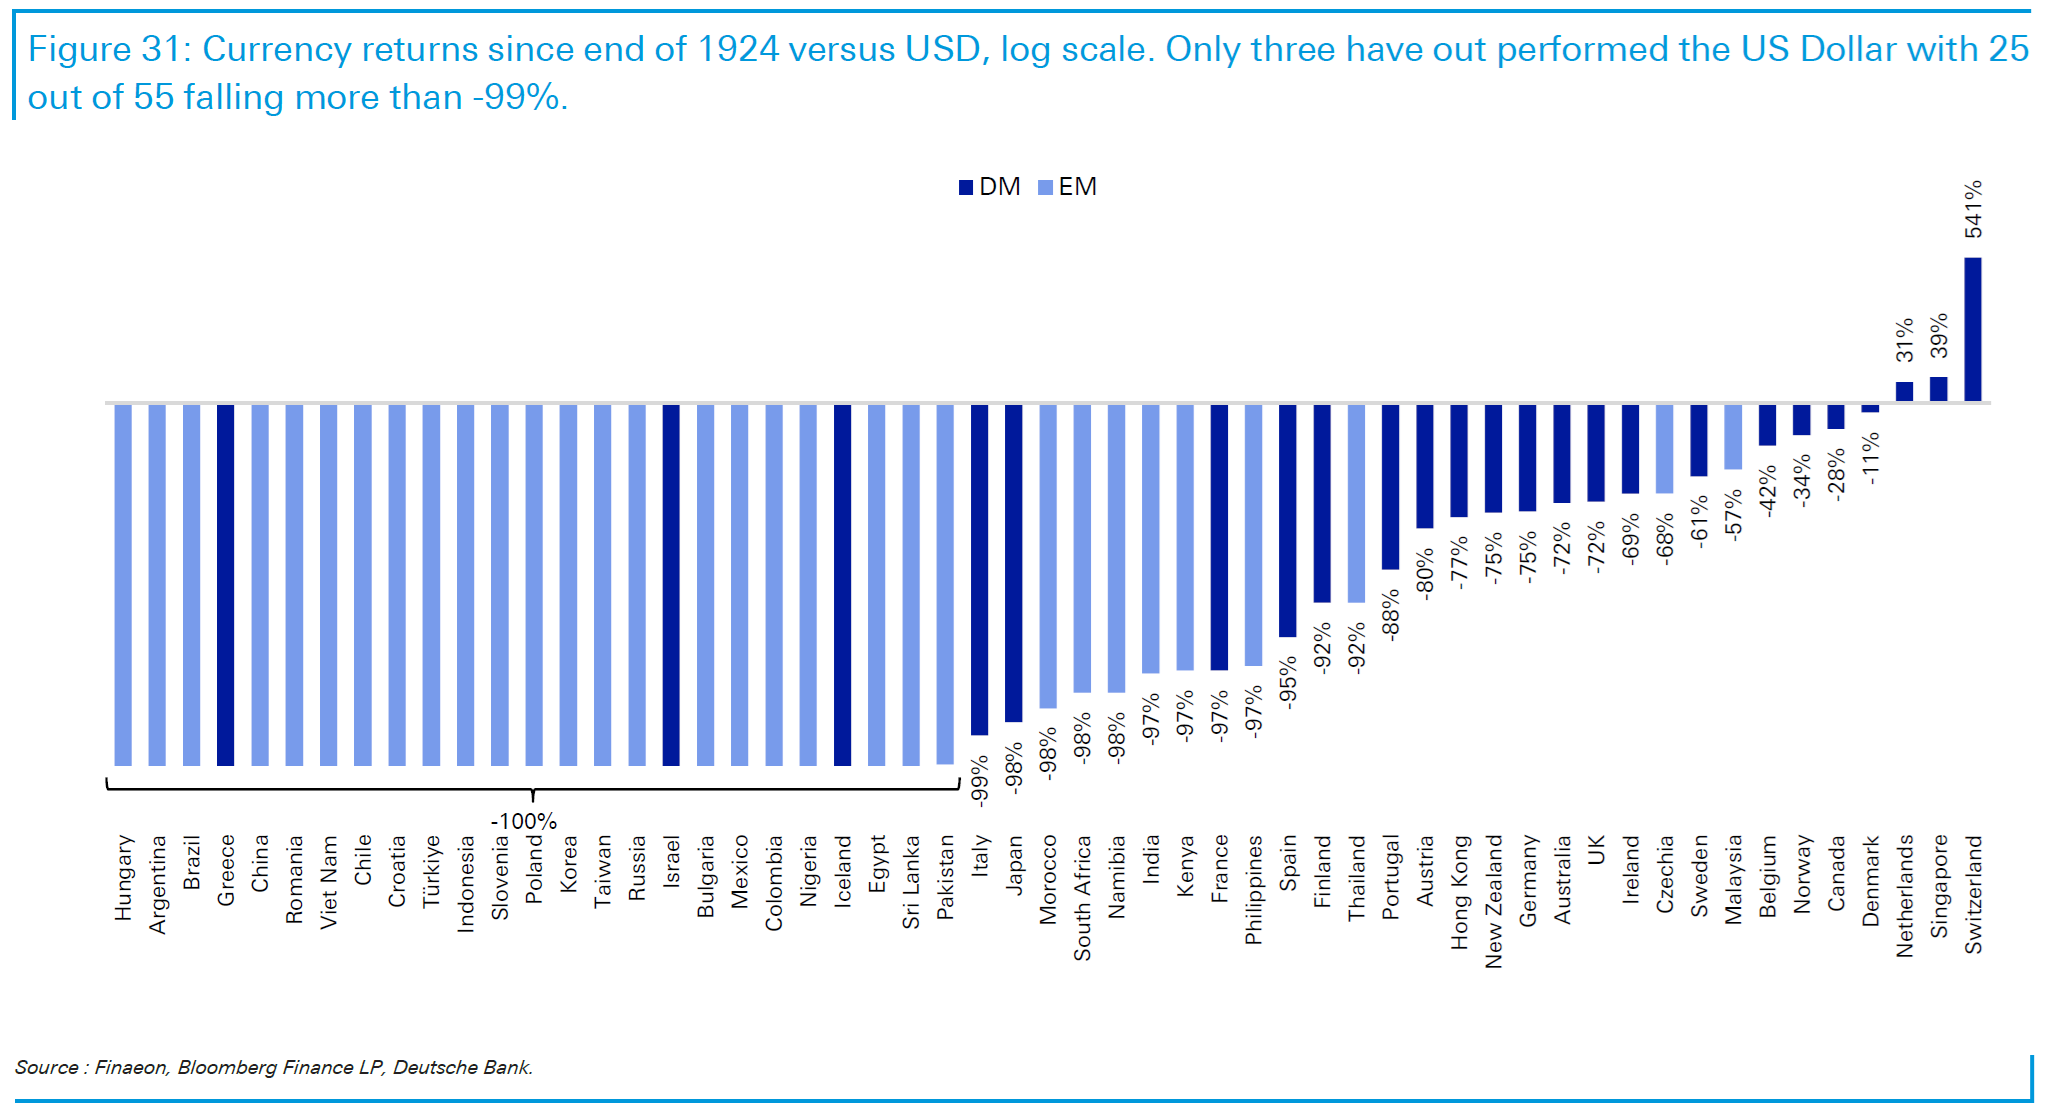
https://www.dbresearch.com/PROD/RI-PROD/PDFVIEWER.calias?pdfViewerPdfUrl=PROD0000000000607211
All questions about fixed income are answered for me.
9 Likes
Really nice, thank you. CHF 541%, but what did stocks in USD do in the same time?
Much more. AI answer:
Since 1924, the U.S. stock market (S&P 500) has delivered phenomenal long-term growth, turning a $100 investment into nearly $3 million by late 2025, averaging about 10-10.7% annually
So an investment in CHF gave you $641 and one in stocks $3 million… 
2 Likes
Is that just FX move or eg short term rate?
Sorry, are you asking about what is on the plot or the reasons for it?
What is on the plot 
Figure 31 highlights how dramatically currencies have depreciated against the U.S. dollar over the long run. Of the 55 economies in our dataset, only three — Switzerland, Singapore, and the Netherlands — have seen their currencies appreciate against the dollar over the past century. Many have been completely debased, with 25 out of 55 in our sample falling more than -99%.
Figure 31: Currency returns since end of 1924 versus USD, log scale. Only three have out performed the US Dollar with 25 out of 55 falling more than -99%.
Pure FX rate change, in my understanding. It also makes sense in context it stands: comparing equities and bonds returns across countries.
2 Likes
Are those pure fx rate developments or including short-term cash rate returns? Because pure fx is not telling you much.
e: @nabalzbhf was quicker with the question 
During lunch conversation, topic of REAL returns of Swiss residential real estate came up.. I tried to dig some data and it seems something really changed post financial crisis for 20 yr series. A mean reversion here can be quite devastating for pension funds.
Sharing numbers for reference
Please note this is only the price and not total returns which should include net rents.
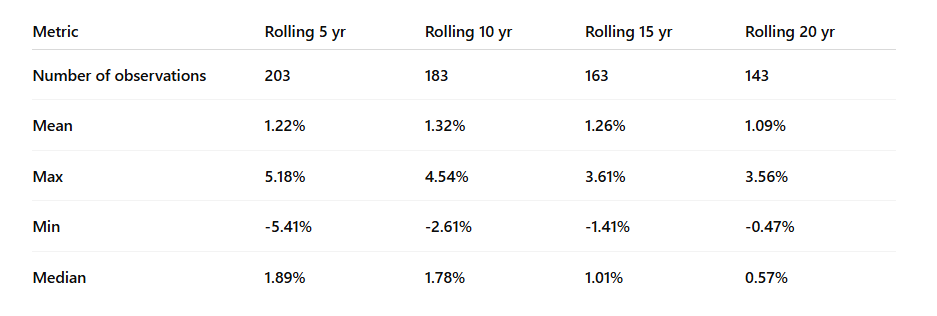
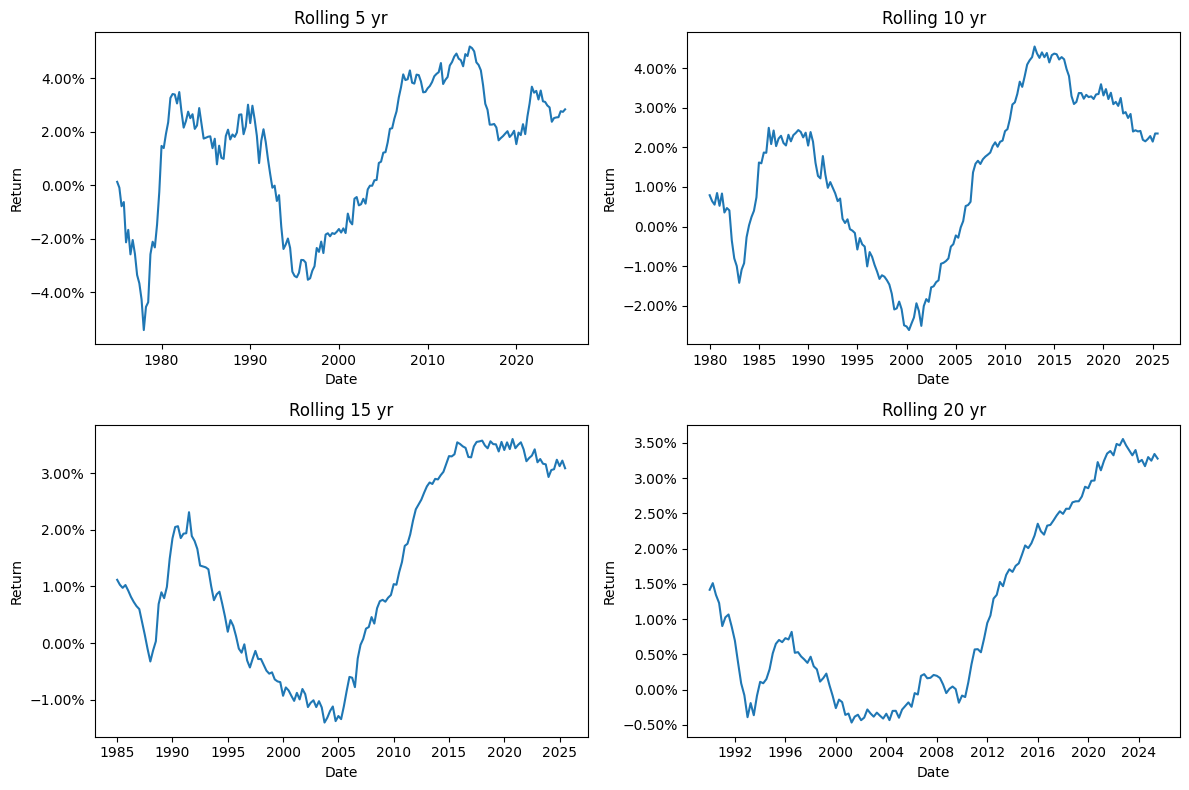
Data source -: here
1 Like
Hard to judge what the “mean” actually is with ~35 series of data on 20y rolling returns. There aren’t even 2 independent series in the data.
I’m reading it as returns starting to fall down for properties bought circa 2000. They rose sharply for real estate assets bought from 1990 to 2000. I haven’t dug on it but the 90s were a time of real estate crisis in Switzerland so starting prices may have been low.
Unless it’s mostly that mortgage rates have gone down, driving up the price of real estate, in which case it could indeed go down if rates go up again.
Or something else, I’m no real estate analyst.
1 Like
I think in past interest rates in Switzerland used to be high and that should have kept asset prices under check. But with 0 rates , everything became speculative
2 Likes
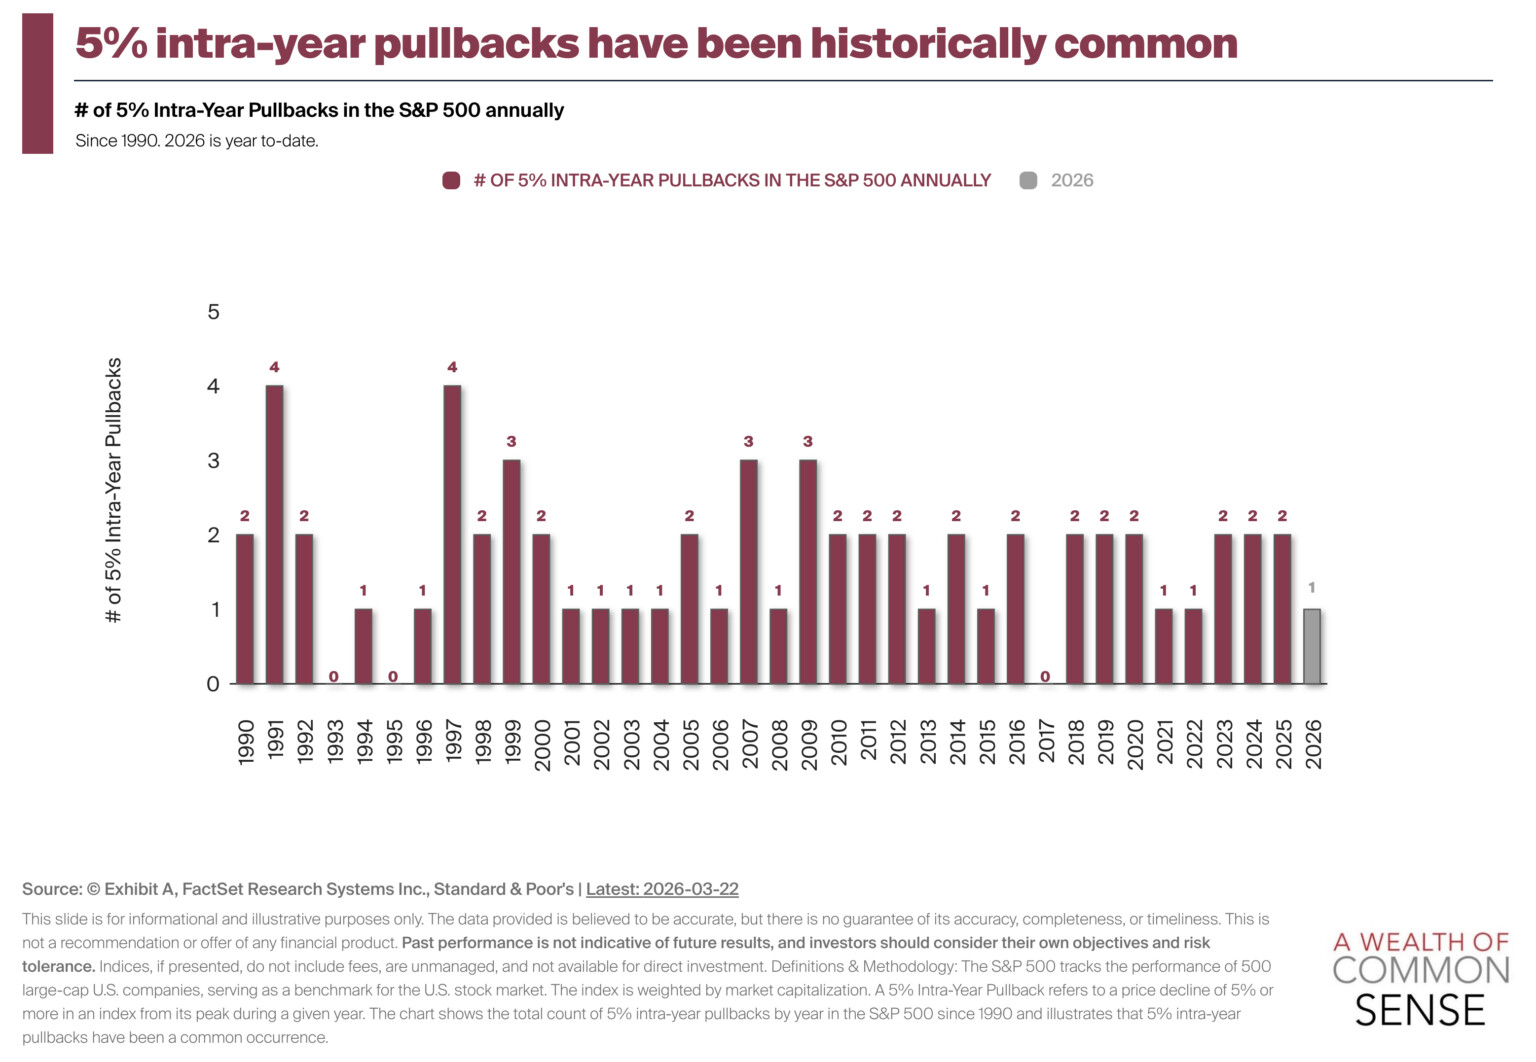
Posting it here as an illustration, although I neither like the index used nor understand exactly what is plotted.
It’s surprising if you don’t have such a pullback within a given year. I think about 50% of years have at least a 10%+ pullback.