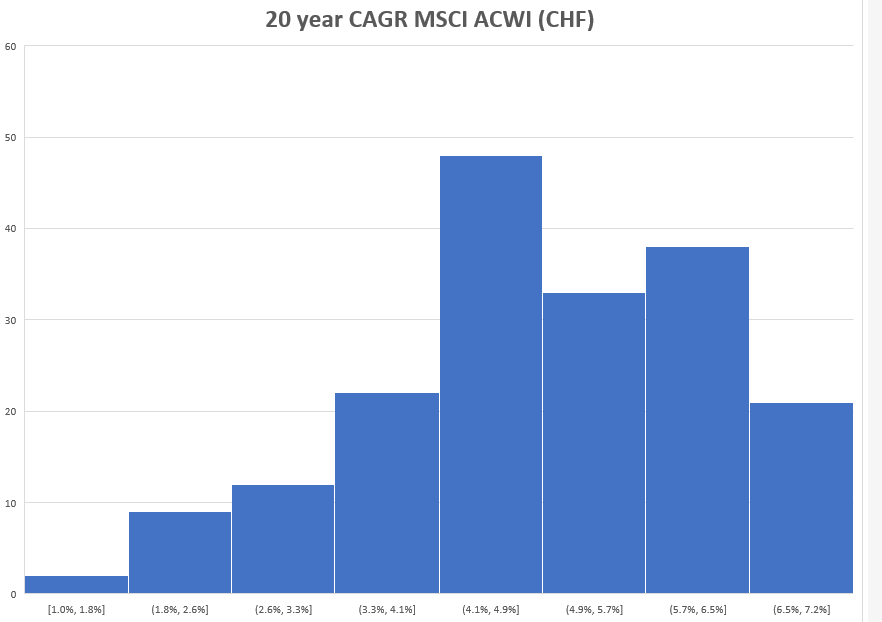
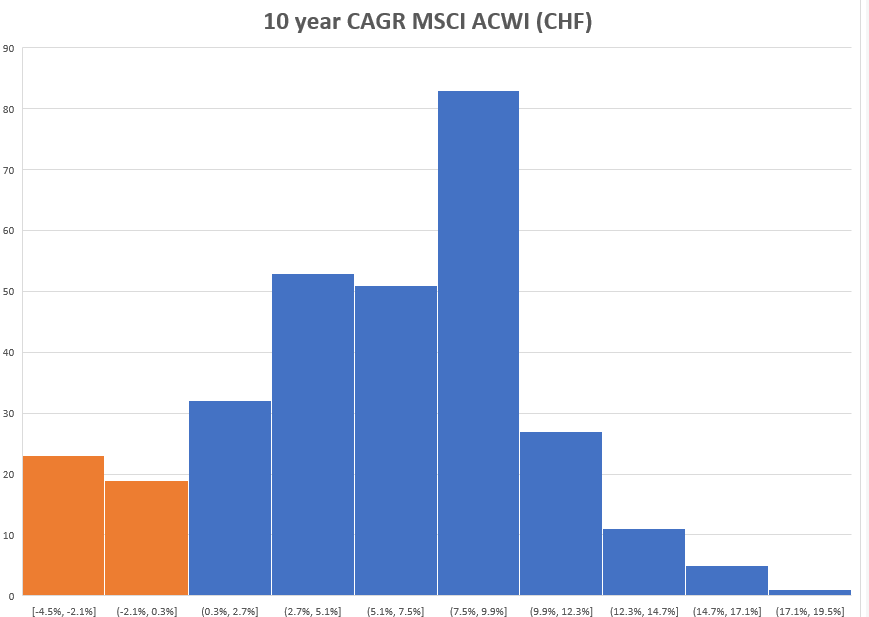
I was trying to estimate what returns people expect from MSCI ACWI and how much it depends on when they started investing. Not sure what you assume as expected return, but I typically used 5% for equities but I think it’s actually a bit lower. Maybe close to 4% after accounting for costs, dividend tax etc
Following is some data
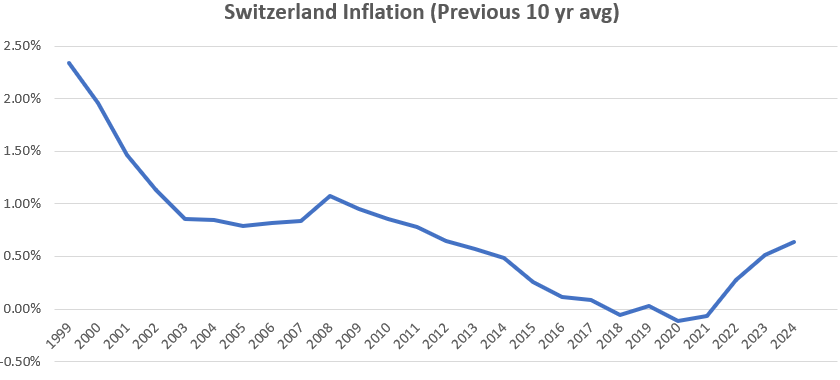
- Numbers are PRE-TAX and assuming ZERO TER%. So you need to deduct income tax, wealth tax and TER%
- Number are Nominal. So you also need to deduct the inflation to get to REAL returns
- Blue is positive, Orange is negative return
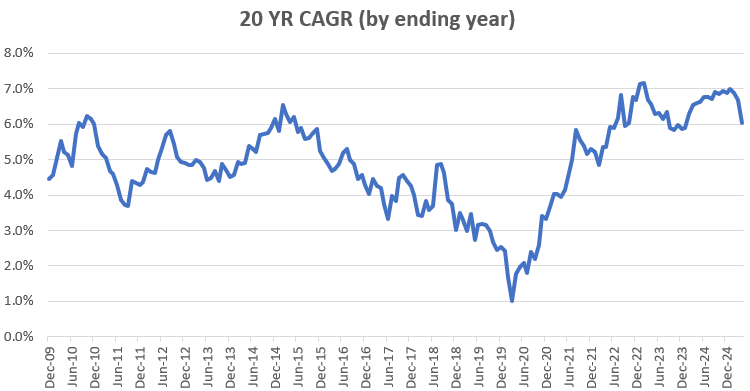
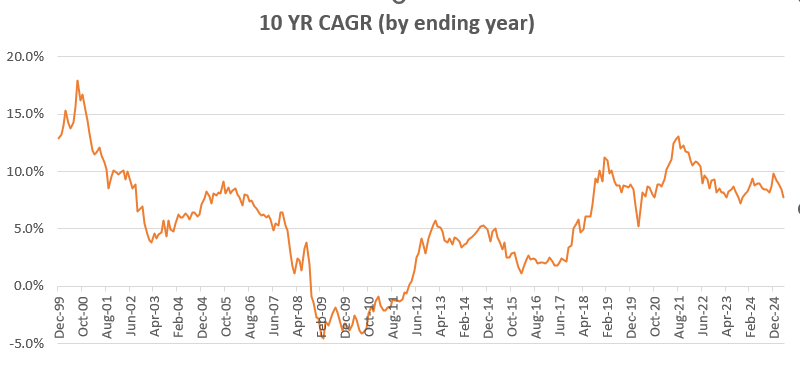
- I calculated it using MSCI ACWI data from CURVO in USD & then applying CHF/USD monthly exchange rate. I am assuming CURVO data is total return index and not just price index
- For example if investor invested 100 CHF in Jan 1990, what would be the value 10 year later and then what if they invested 100 CHF in Feb 1990, and so on..
- I used Histogram to understand the frequency of returns.
- The average is 5.7% for 10 yr period (305 observations) & 4.9% for 20 yr period (185 observations)