Just received Jason Zweig’s “The Intelligent Investor” newsletter. It’s a gem, as always (Sign up here).
I feel obliged to quote from it:
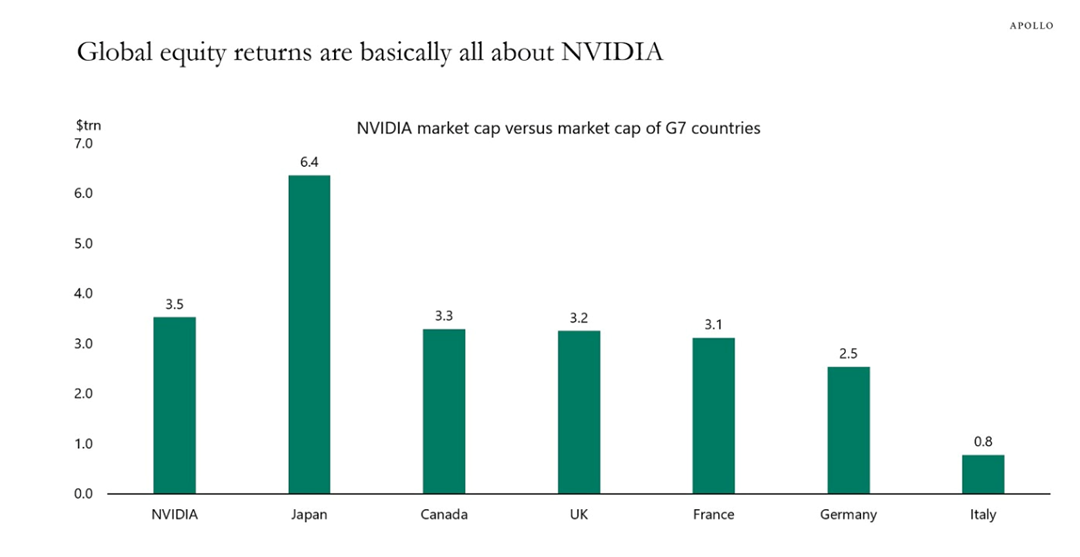
“As you can see at a glance, the chart shows that Nvidia’s market capitalization is greater than the total value of the entire stock market of five of the G7 nations.”
Hilarious, no?
Jason always includes references to art in his newsletters, which I probably like even more, as it’s kind of a little more … eternal?
"Around 1305, in a chapel in Padua, Italy, the pioneering artist Giotto di Bondone painted this figure:

Giotto, “Invidia” (ca. 1305), Scrovegni Chapel, Padua, via Wikimedia Commons
She is Invidia, or Envy."*
* The newsletter continues as follows for the history buffs:
"Giotto’s portrayal of Envy has, in a bitter irony, been defaced by centuries of visitors, who scratched her eye out and gouged off the claws that used to curve from the fingertips of her tiny hands.
But there’s little doubt that the great artist originally portrayed her as blind or with her eyes sealed shut. Giotto’s inscription beneath the image, no longer fully legible, reads in part: “Exposed here is blind envy…”
Invidia comes from the Latin invidere, with the verb “to see” (videre) at its core.
In Purgatorio, the second part of The Divine Comedy, published about 15 years after Giotto finished his painting, Dante portrayed the envious with their eyelids stitched shut by iron wires as punishment for never having seen the good around them.
It’s possible that Dante was inspired by Giotto’s painting. In its original grim glory, perhaps it showed Envy with her eyes sewed shut.
As the art historian Matthew Shoaf wrote:
What [medieval] authors mean when they say envy lacks sight is that envious persons are unable to take pleasure in what they see and misconstrue others’ goods as diminishing to themselves—material wealth, rank, honors, praise, joy, or virtue, for example. Envy, Guglielmus Peraldus writes in a much copied preacher’s manual [ca. 1236], “cannot see good things unless it sees bad in them.”
Look again at Giotto’s personification of Envy. Her jealous words turn her tongue into a snake that snaps back and bites her in the forehead. The horn on the back of her head, instead of goring someone else, stabs her. Envy’s ear, hypersensitive to good news about other people, has grown so large it resembles the ear of a bat. The flames of her resentment, like a swarm of angry snakes, roar out from under her dress.
Giotto wants us to realize that when we envy other people we only hurt ourselves.
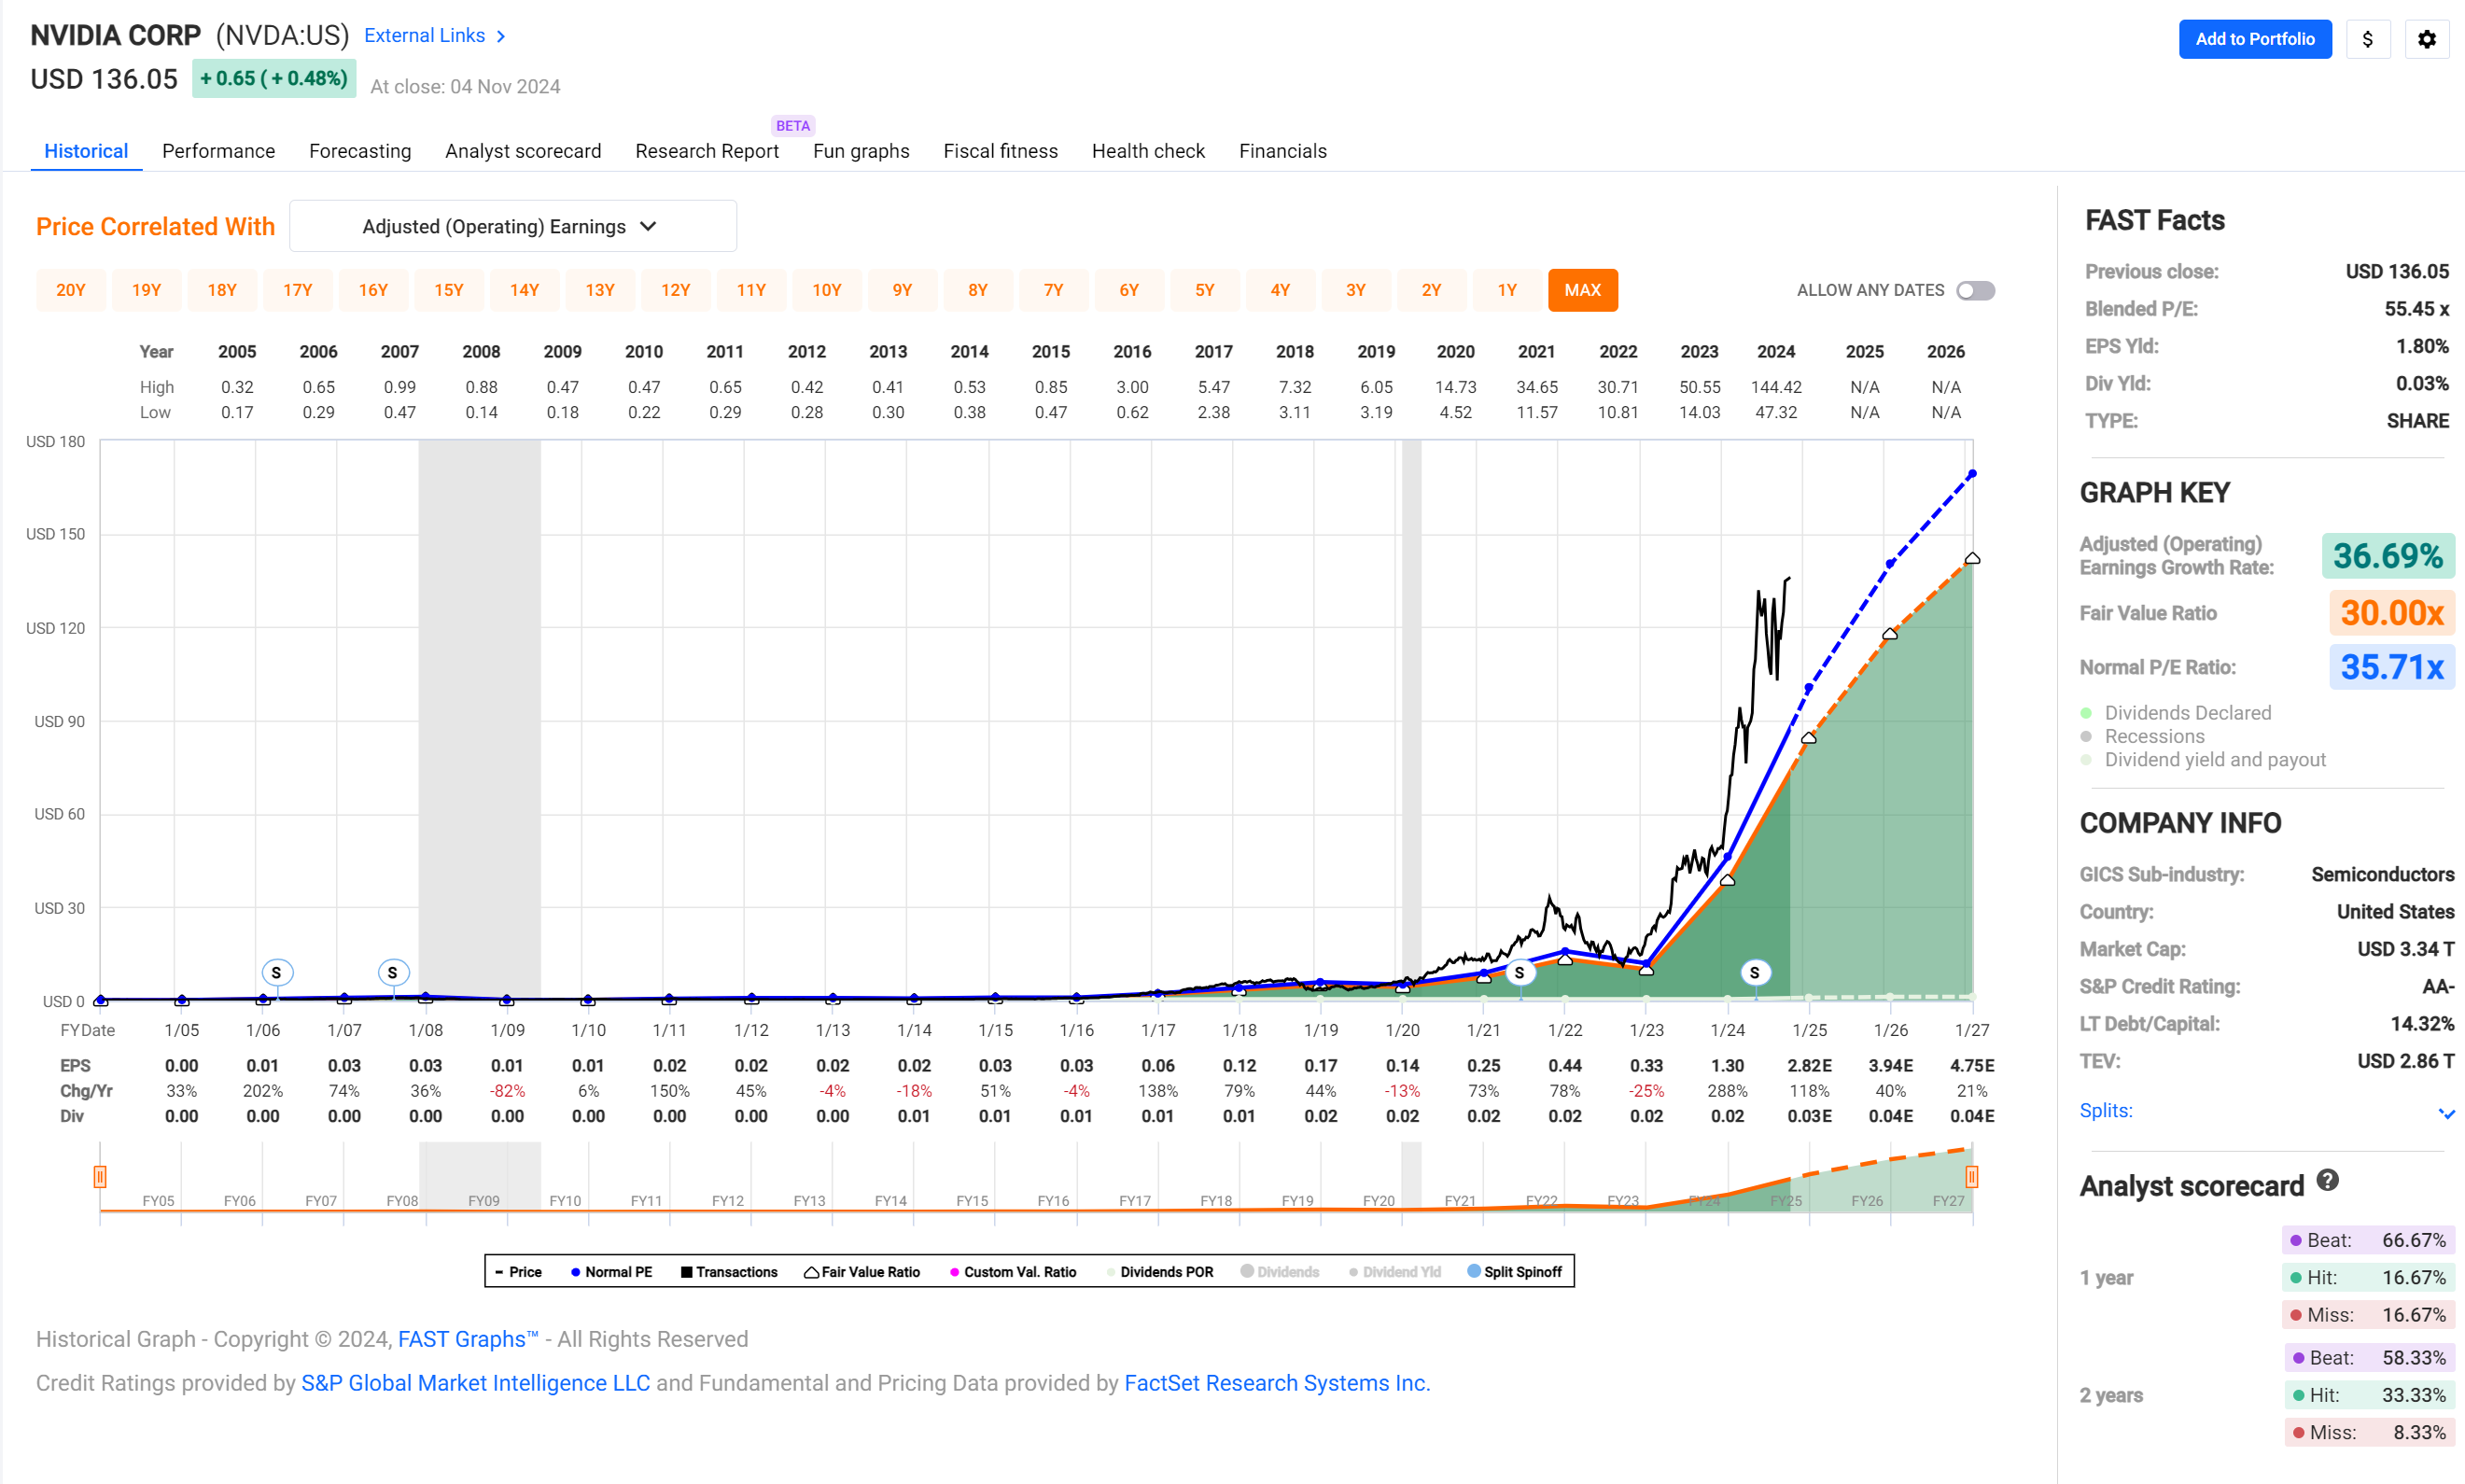
So Nvidia is up more than 180% this year and you don’t own it? Someone else made millions on Nvidia stock?
Good for them! Why is someone else’s good fortune bad for you?
It hurts you only if you let yourself be consumed by envy over it. And an asset isn’t automatically a bubble just because you don’t happen to own it.
As Charlie Munger liked to say, “Envy is a really stupid sin because it’s the only one you could never possibly have any fun at.”"