Hey all, new here but figured this is the right community for what I’m about to share, because nobody scrutinises Swiss tax math like Mustachians do.
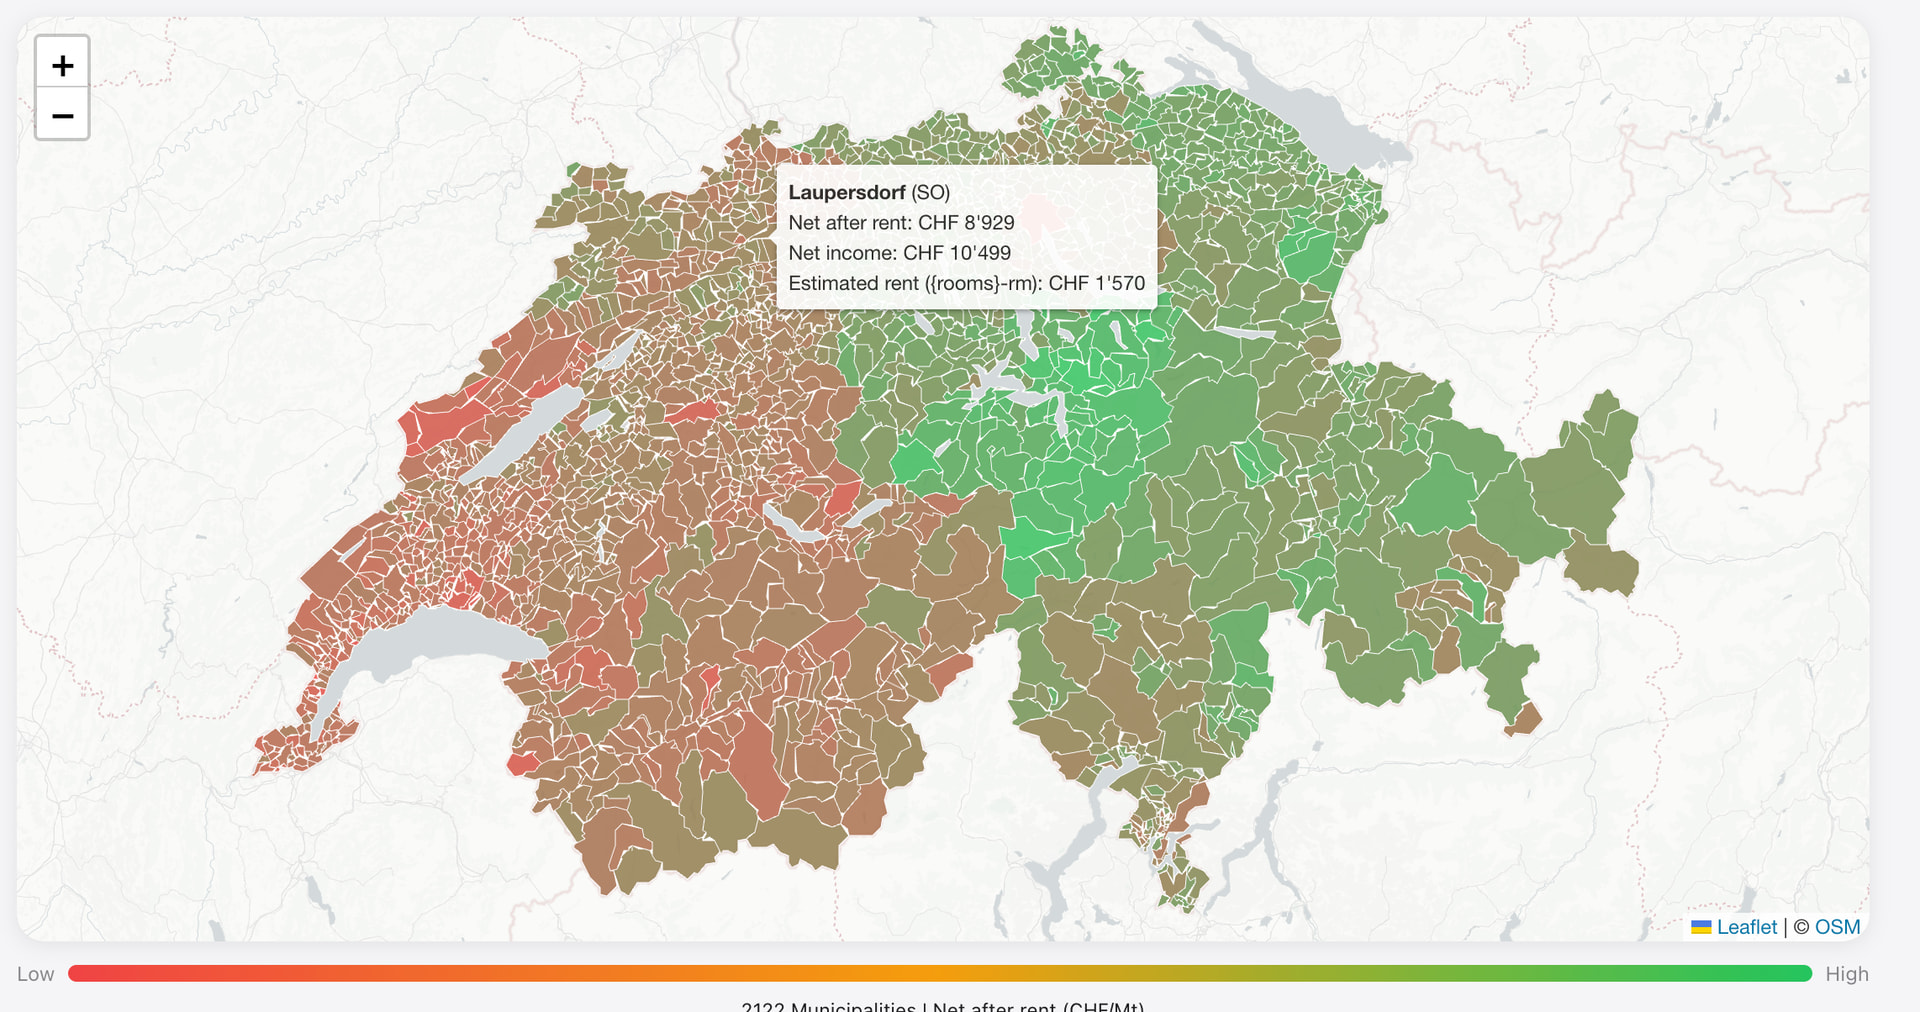
Built wheretolive.ch — a comparator for effective income + wealth tax across all 2,244 Swiss municipalities, with federal + cantonal + municipal layers decomposed. Enter income, civil status, kids, Pillar 3a / BVG contributions, then click a municipality on the map or compare two head-to-head.
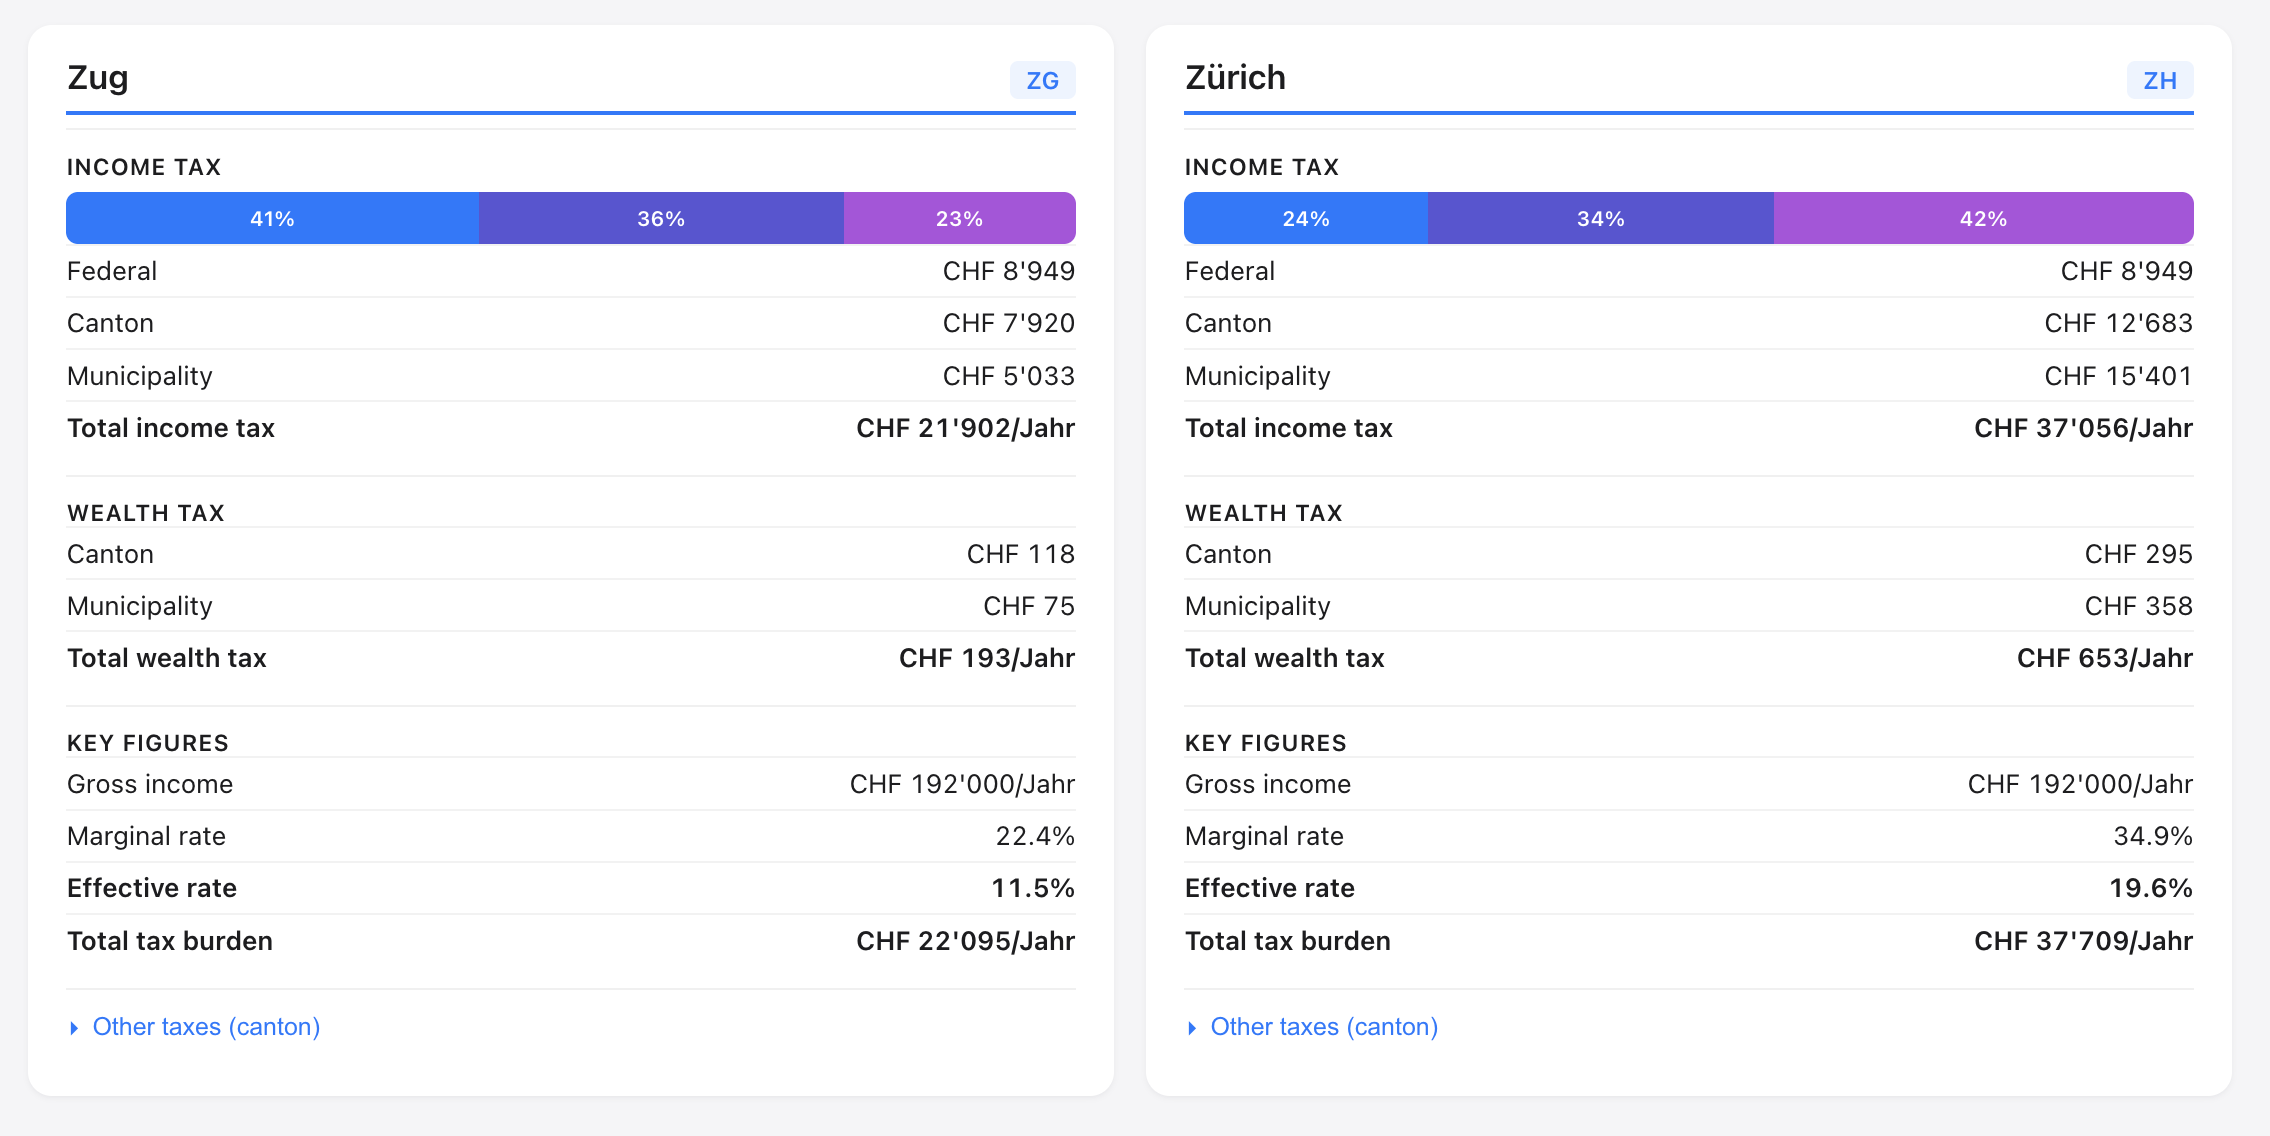
Sanity-check example, 192k gross household income, Zug vs Zürich:
Zug
Zürich
Federal income tax
8,949
8,949
Cantonal income tax
7,920
12,683
Municipal income tax
5,033
15,401
Total income tax
21,902
37,056
Wealth tax (cant. + mun.)
193
653
Total tax burden
22,095
37,709
Effective rate
11.5%
19.6%
Marginal rate
22.4%
34.9%
Delta: 15,614 CHF/year on identical gross income. The marginal-rate gap (12.5pp) is the one I keep coming back to — at the next raise you keep ~78 cents per franc in Zug vs ~65 in Zürich. Compounded over a FIRE-relevant timeframe that’s life-changing money.
Data sources / methodology:
Cantonal tax administrations, 2024/2025 rates
143,593 individual data points (family situations × income brackets × Pillar 3a / BVG deductions × wealth levels)
Federal Bundessteuer-Tarif applied separately
All three layers (federal + cantonal + municipal) decomposed in the UI
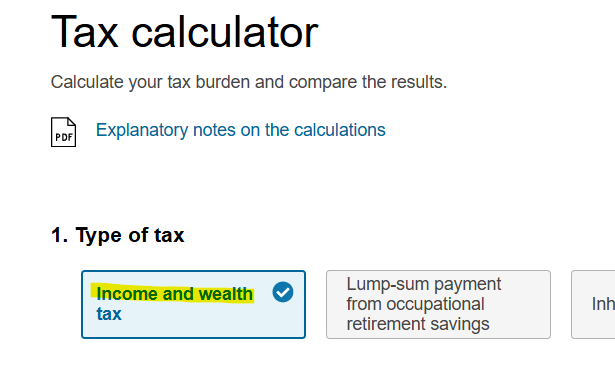
Seems like a knockoff, just maybe a tiny bit more practical, of the official website (Swiss tax calculator). A bit more practical because afaik the official website can’t do income and wealth at the same time, so why not.
However - why would you need anyone to test it for you? As far as what you explained, it’s basically the same thing just 2 features combined.
So what I’m going to propose is that you test it yourself against the official website, though I suspect that that’s where you get your data from anyways (if you don’t, why not?), so it should be correct.
I have tried it on a chrome browser on iPhone 11 but the website doesn’t display very well. It is cropped on the left side.
How do you take into comparison the projected flat price in the monthly spending ? Price seems low in Geneva district.
Hi, yes, that’s exactly where I scraped the data from. The official ESTV calculator is great as a reference, but a bit limited in practice — you basically type in one municipality and can compare it with one other. For someone without a clear idea of where to live, that quickly becomes cumbersome.
wheretolive.ch is built around much higher interactivity: it starts with a short questionnaire (where you and your partner work, etc.) and then surfaces the optimal municipalities across the whole country in one go. You can filter, re-rank, and explore trade-offs interactively rather than running comparisons one pair at a time.
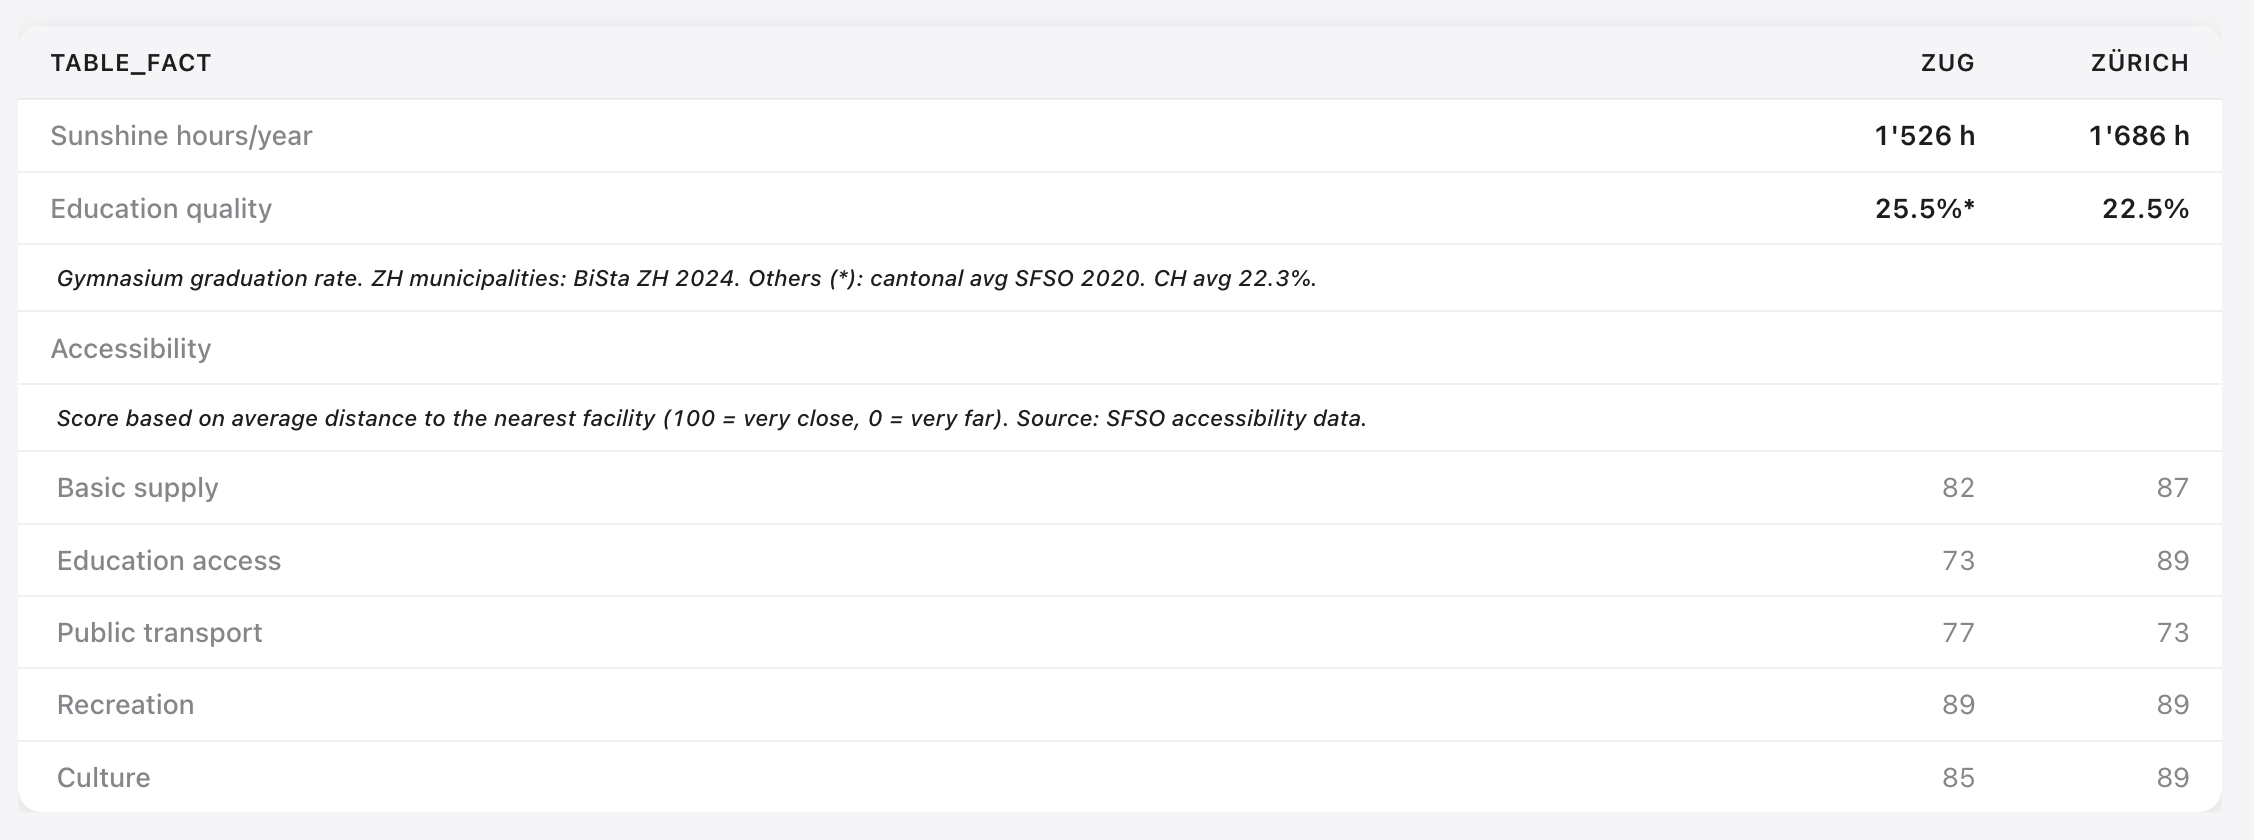
Ultimately, the idea is to go beyond taxes and bring multiple factors into the picture — though I’ll admit data quality on the non-tax side is still something I want to improve.
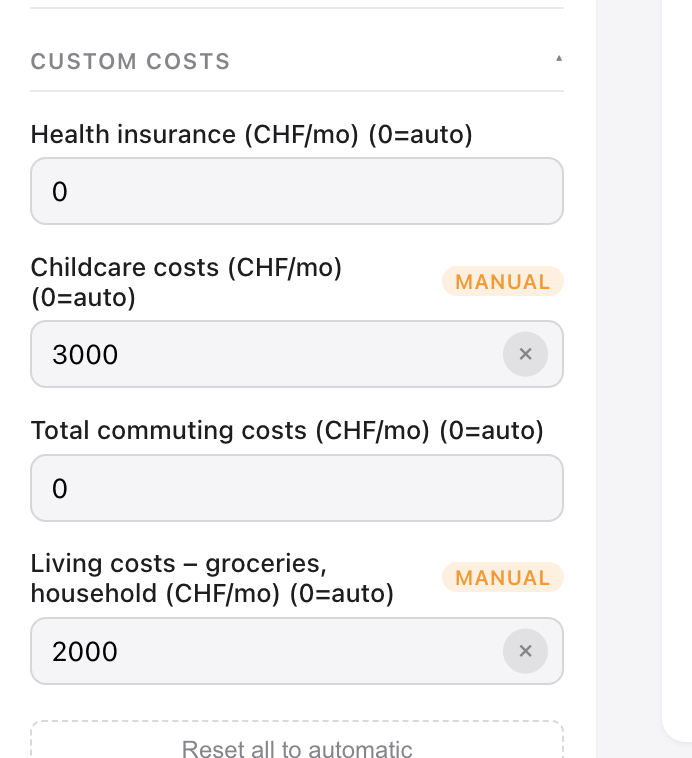
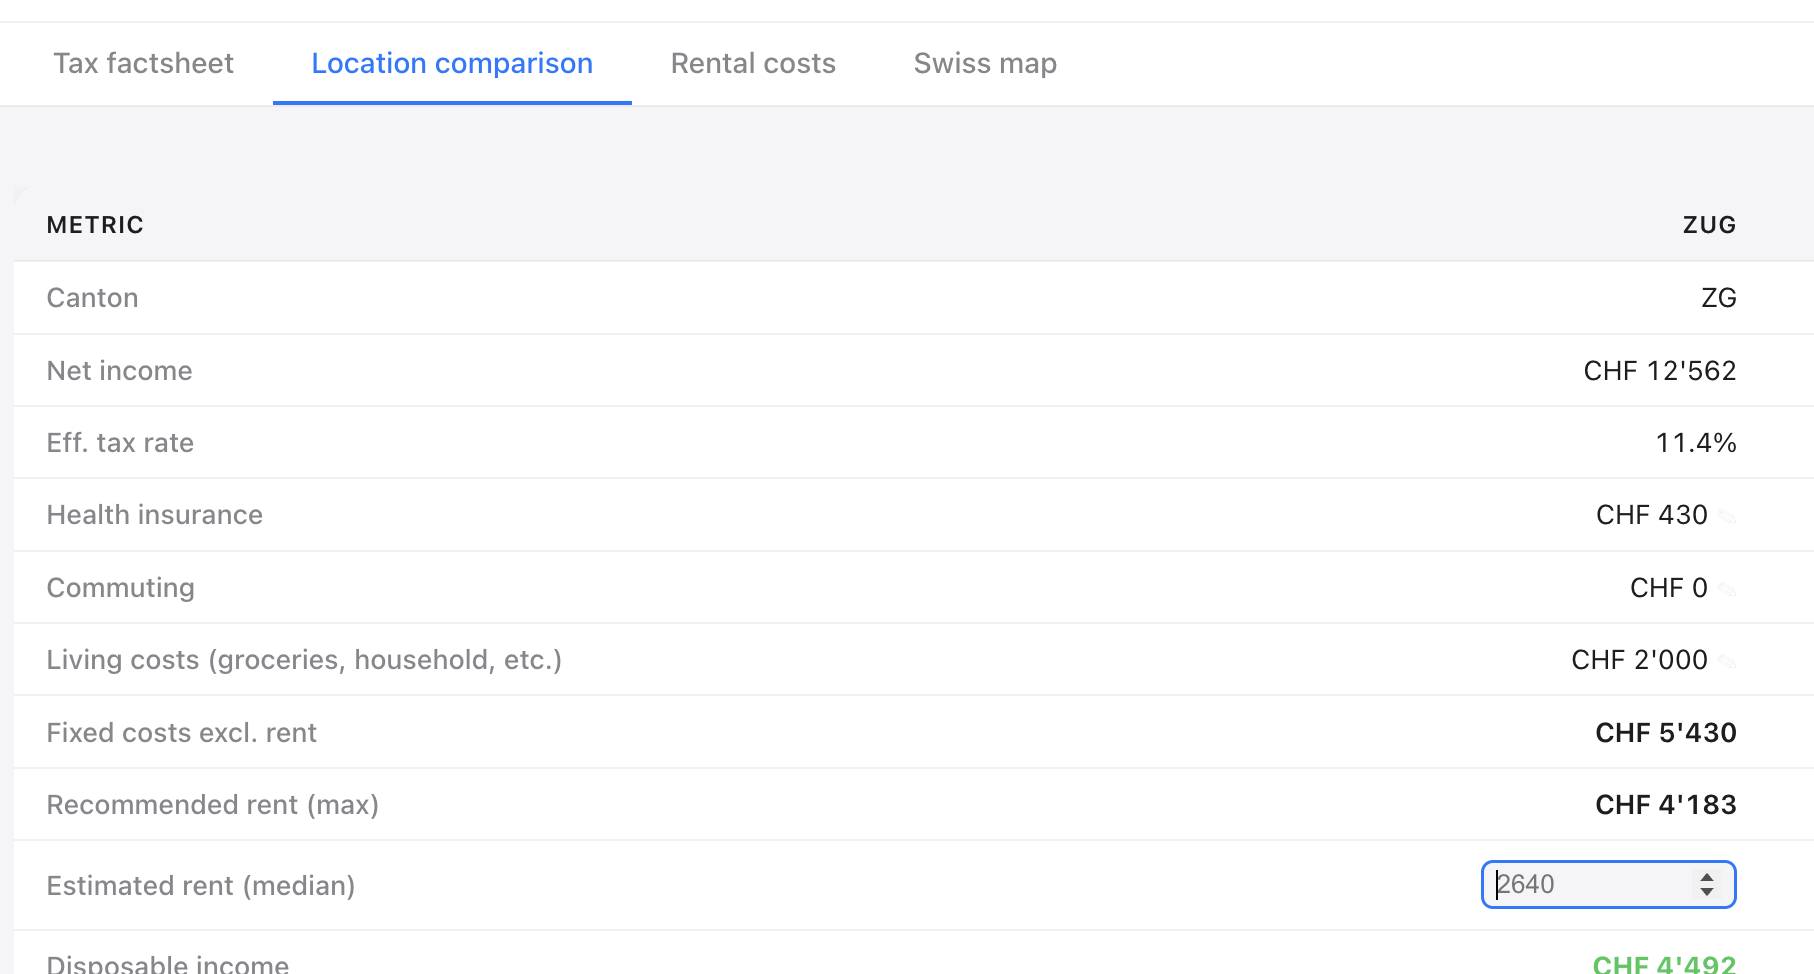
I am actually working on further breaking it down. It works best for rental prices. I had a purchase advice tab, but took it down and am working on refactoring it. And yes, data like rental prices and house prices are difficult to get right, hence I offer the option to overwrite so that you can type in specific constellations:
Second this and also add availability of amenities and public transport and schooling.
You can get daycare costs for valais municipalities on their websites. In some communes in Valais due to their low costs of childcare you end up being financially better off for having children, but that should be contrasted with remoteness and job availability.
I specified that the most important factor for me is to have short commute and that I work in Zurich, “doesn’t matter” other preferences (language, urban, etc.). The website recommends 3 communes in Ticino, with commutes between 2.5 and 3.5 hours (one way). All of three are “100/100” commute score
Mit dem Lesen und der Teilnahme an diesem Forum bestätigst du, dass du die Forum-Richtlinien gelesen hast und damit einverstanden bist sowie den Haftungsausschluss auf http://www.mustachianpost.com/de/ akzeptierst.